Method for quantitative analysis of blood vessel structure

a blood vessel and quantitative analysis technology, applied in the field of tissue characterization, can solve the problems of inability to accurately determine whether there is any detectable difference, manual process cannot be replicated exactly from one time to the next, and the contours of feature boundaries of dozens of vessel specimens a week are tedious and laborious, so as to reduce the amount of tedium involved, accurate and repeatable analysis of the shape of components

Inactive Publication Date: 2006-02-09
BIOIMAGENE
View PDF19 Cites 9 Cited by
  • Summary
  • Abstract
  • Description
  • Claims
  • Application Information

AI Technical Summary

Benefits of technology

[0012] Objectively identified criteria can be used to establish the self-consistency of the construction of boundaries. These objectively identified criteria can include information on color, intensity, morphology, connectivity, or sequencing. For example, in the case of blood vessels, one can assume that damage to the vessel is such that a lumen, adventitia, and internal elastic lamina exist and are located in a certain order. Analysis results can be overplayed on the image for review by a pathologist. The overlay can be visually enhanced to enable quick review and modification.
[0018] In a particular embodiment, the invention is directed to an accurate and repeatable analysis of the shape of components of blood vessels. Methods are disclosed to enable a measurement and analysis system to quantitatively evaluate blood vessel geometry while reducing the tedium involved in making manual measurements. The steps of the automated method involve capturing images, assembling images, highlighting features, identifying boundaries of the features, and placing results and images into a database for easy retrieval and statistical analysis.

Problems solved by technology

Manually outlining the contours of feature boundaries of dozens of vessel specimens a week is a very tedious process.
Given the variability of blood vessel shape, the manual process cannot be replicated exactly from one time to the next simply because the boundaries are not smooth and will be drawn differently each time.
However, more effort is needed to determine whether there is any detectable difference between various treatments for restenosis.
This affects the quantitative repeatable measurement of color and therefore has an adverse effect on automated feature extraction.
The vessels that have been studied have all been injured by balloon angioplasty.
However, there may be other blood vessels or tears in the tissue.
The EEL may be incomplete and open because of the angioplasty procedure.
The data may be kept in spreadsheets where it is not easily accessible, efficiently analyzed or shared.

Method used


Image

  • Method for quantitative analysis of blood vessel structure
  • Method for quantitative analysis of blood vessel structure
  • Method for quantitative analysis of blood vessel structure

Examples


Embodiment Construction

[0026] In the Applicant's co-pending U.S. patent applications Ser. Nos 09 / 338,904, No. 09 / 338,909 and No. 09 / 338,908, novel databases having structural, cell function and / or mechanical indices that correspond to statistically significant representations of tissue characteristics are disclosed

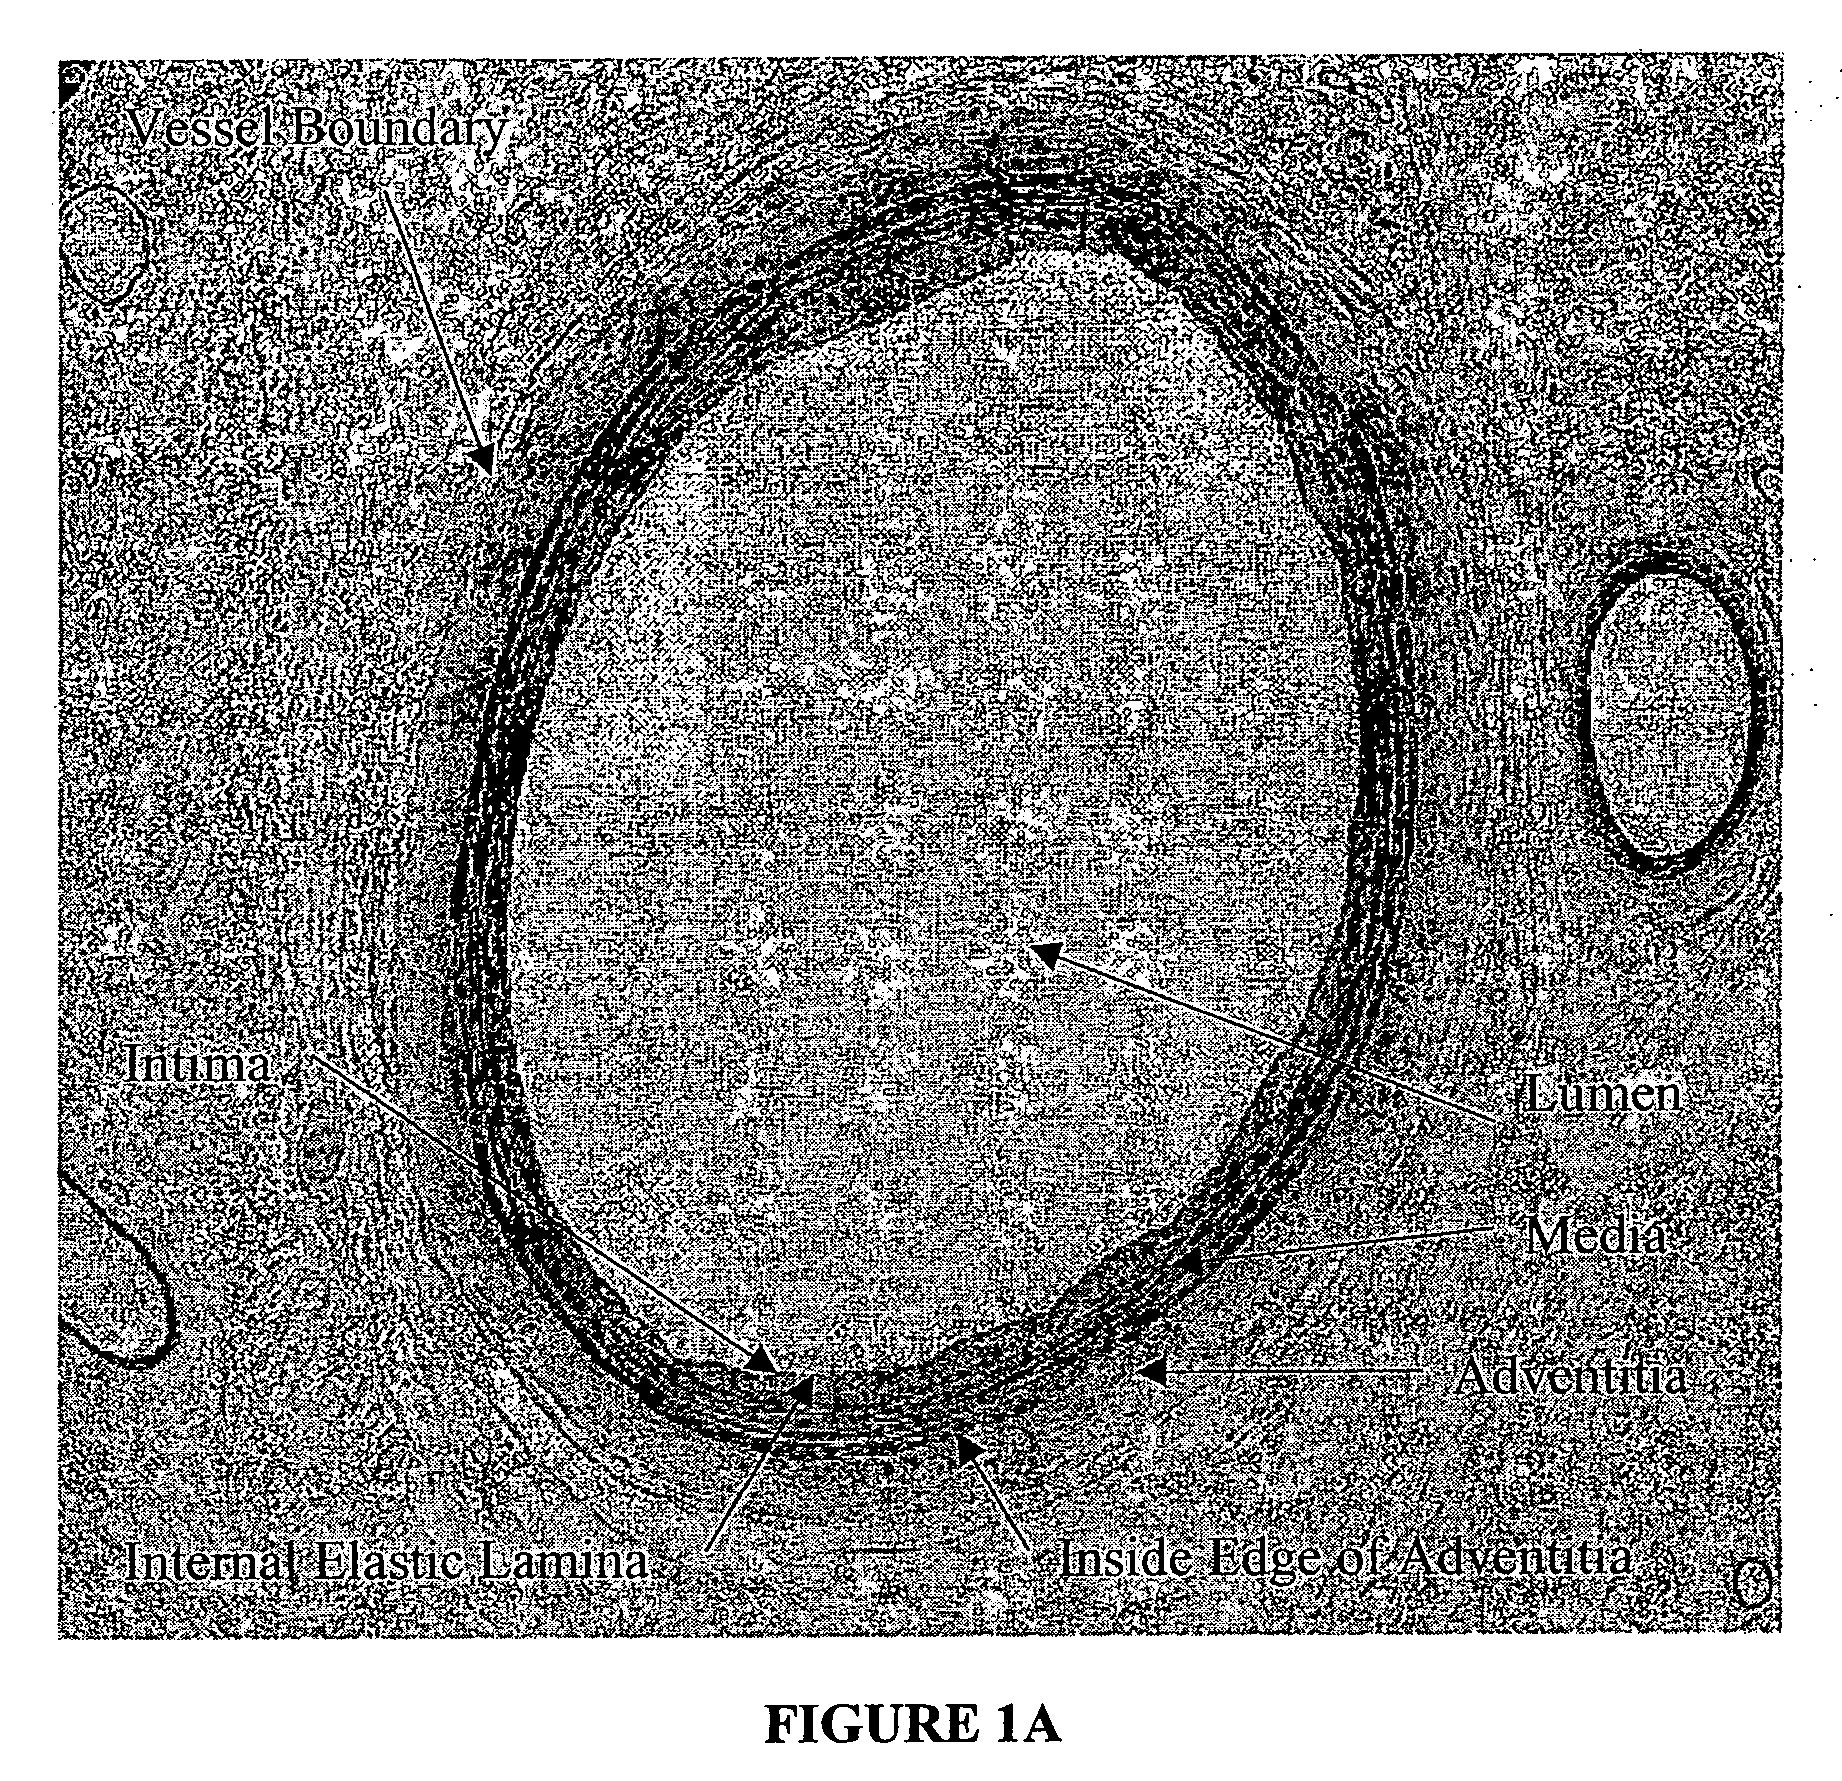
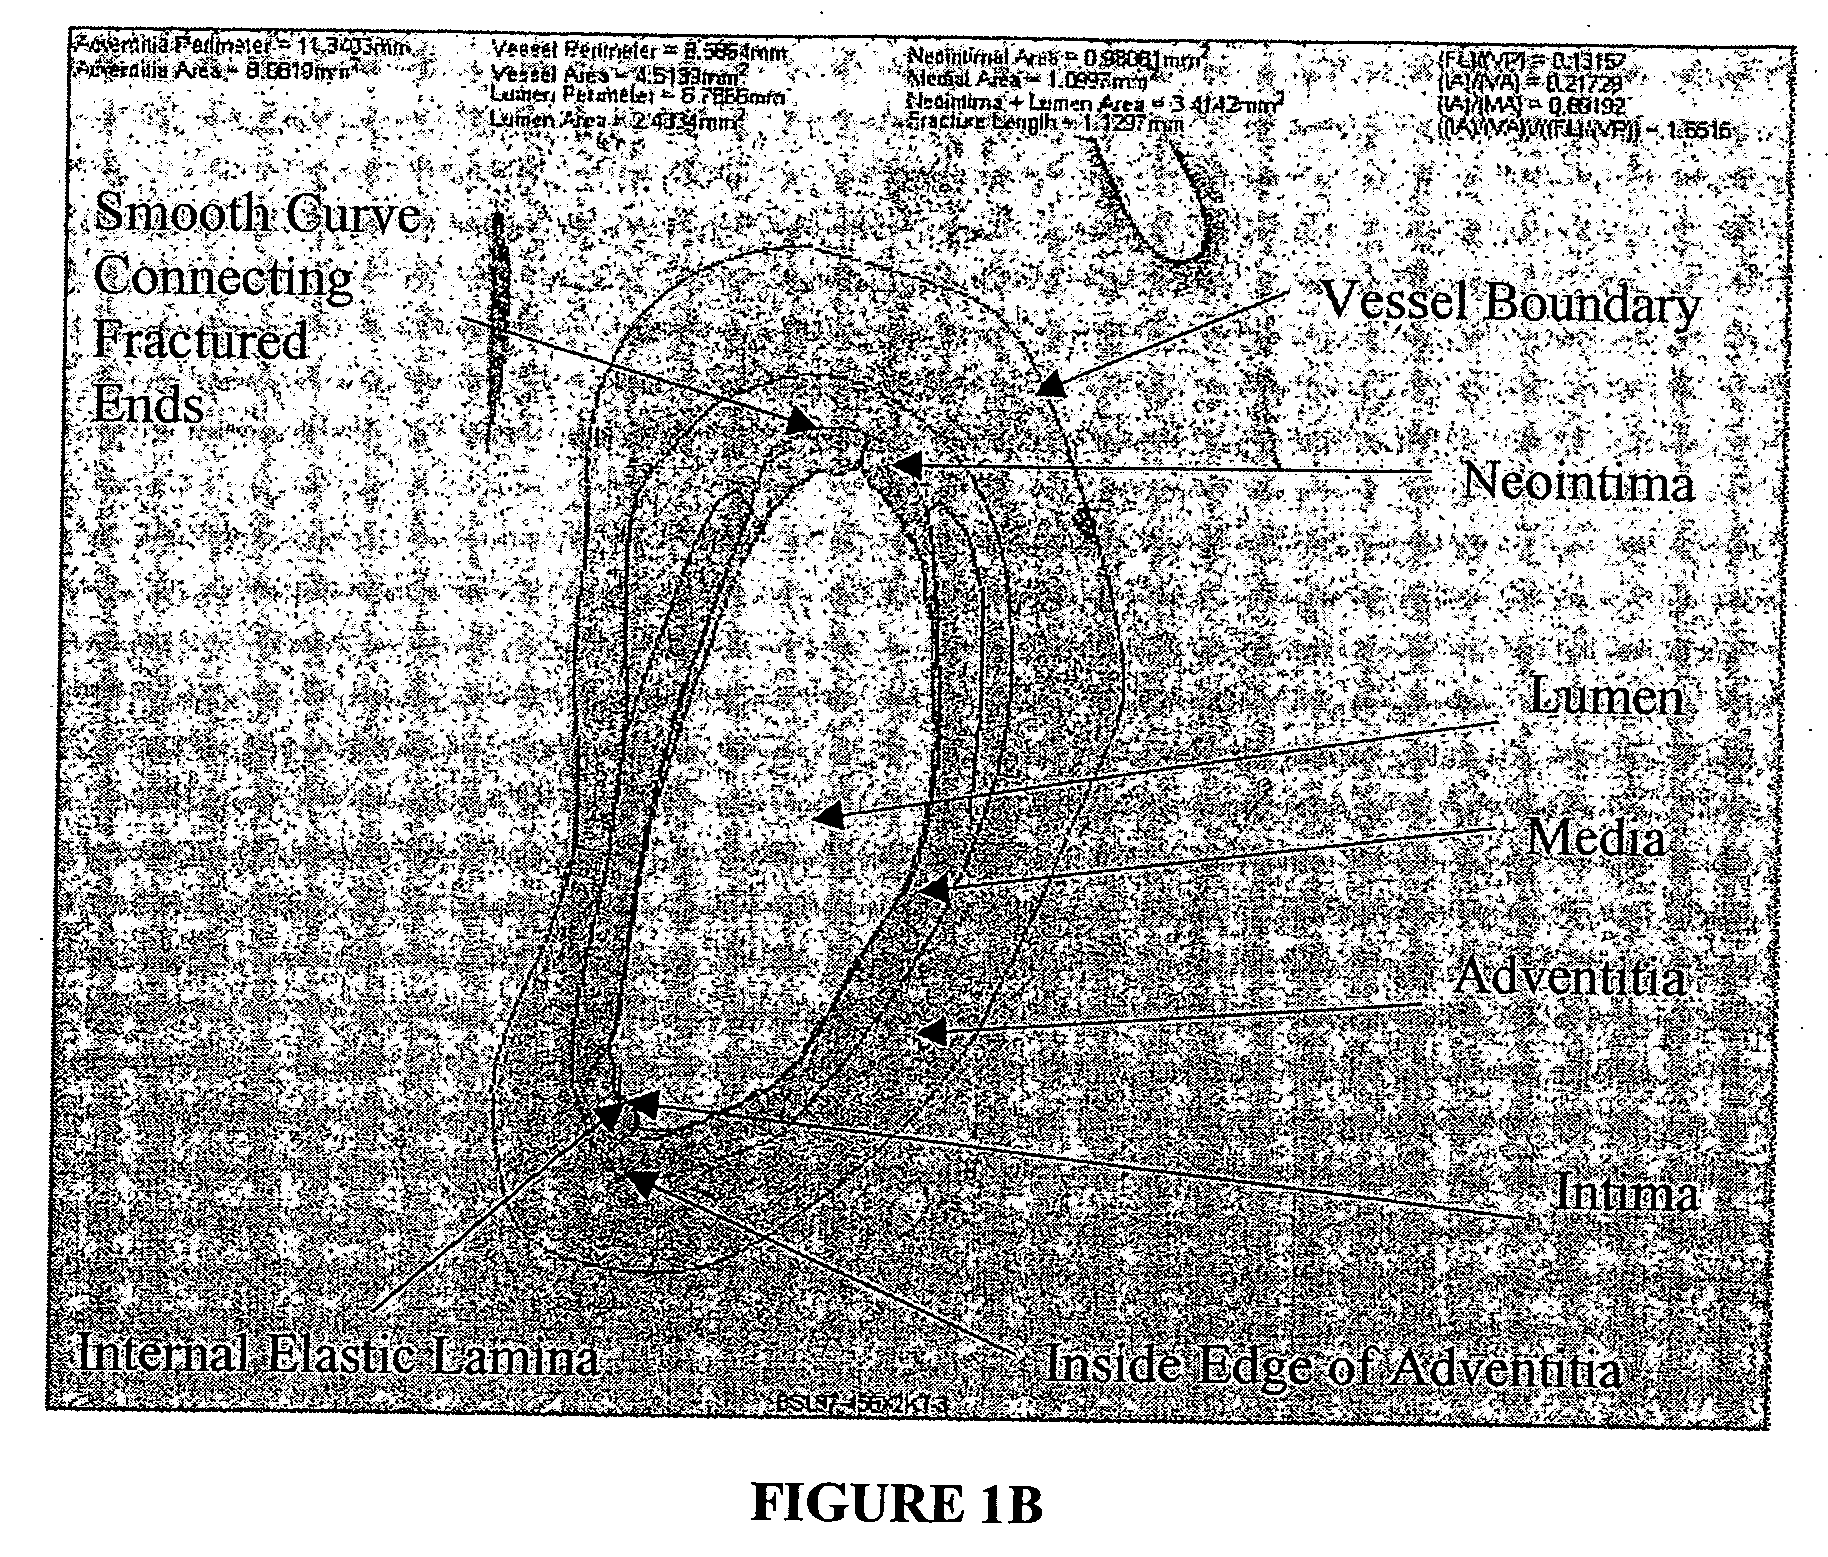
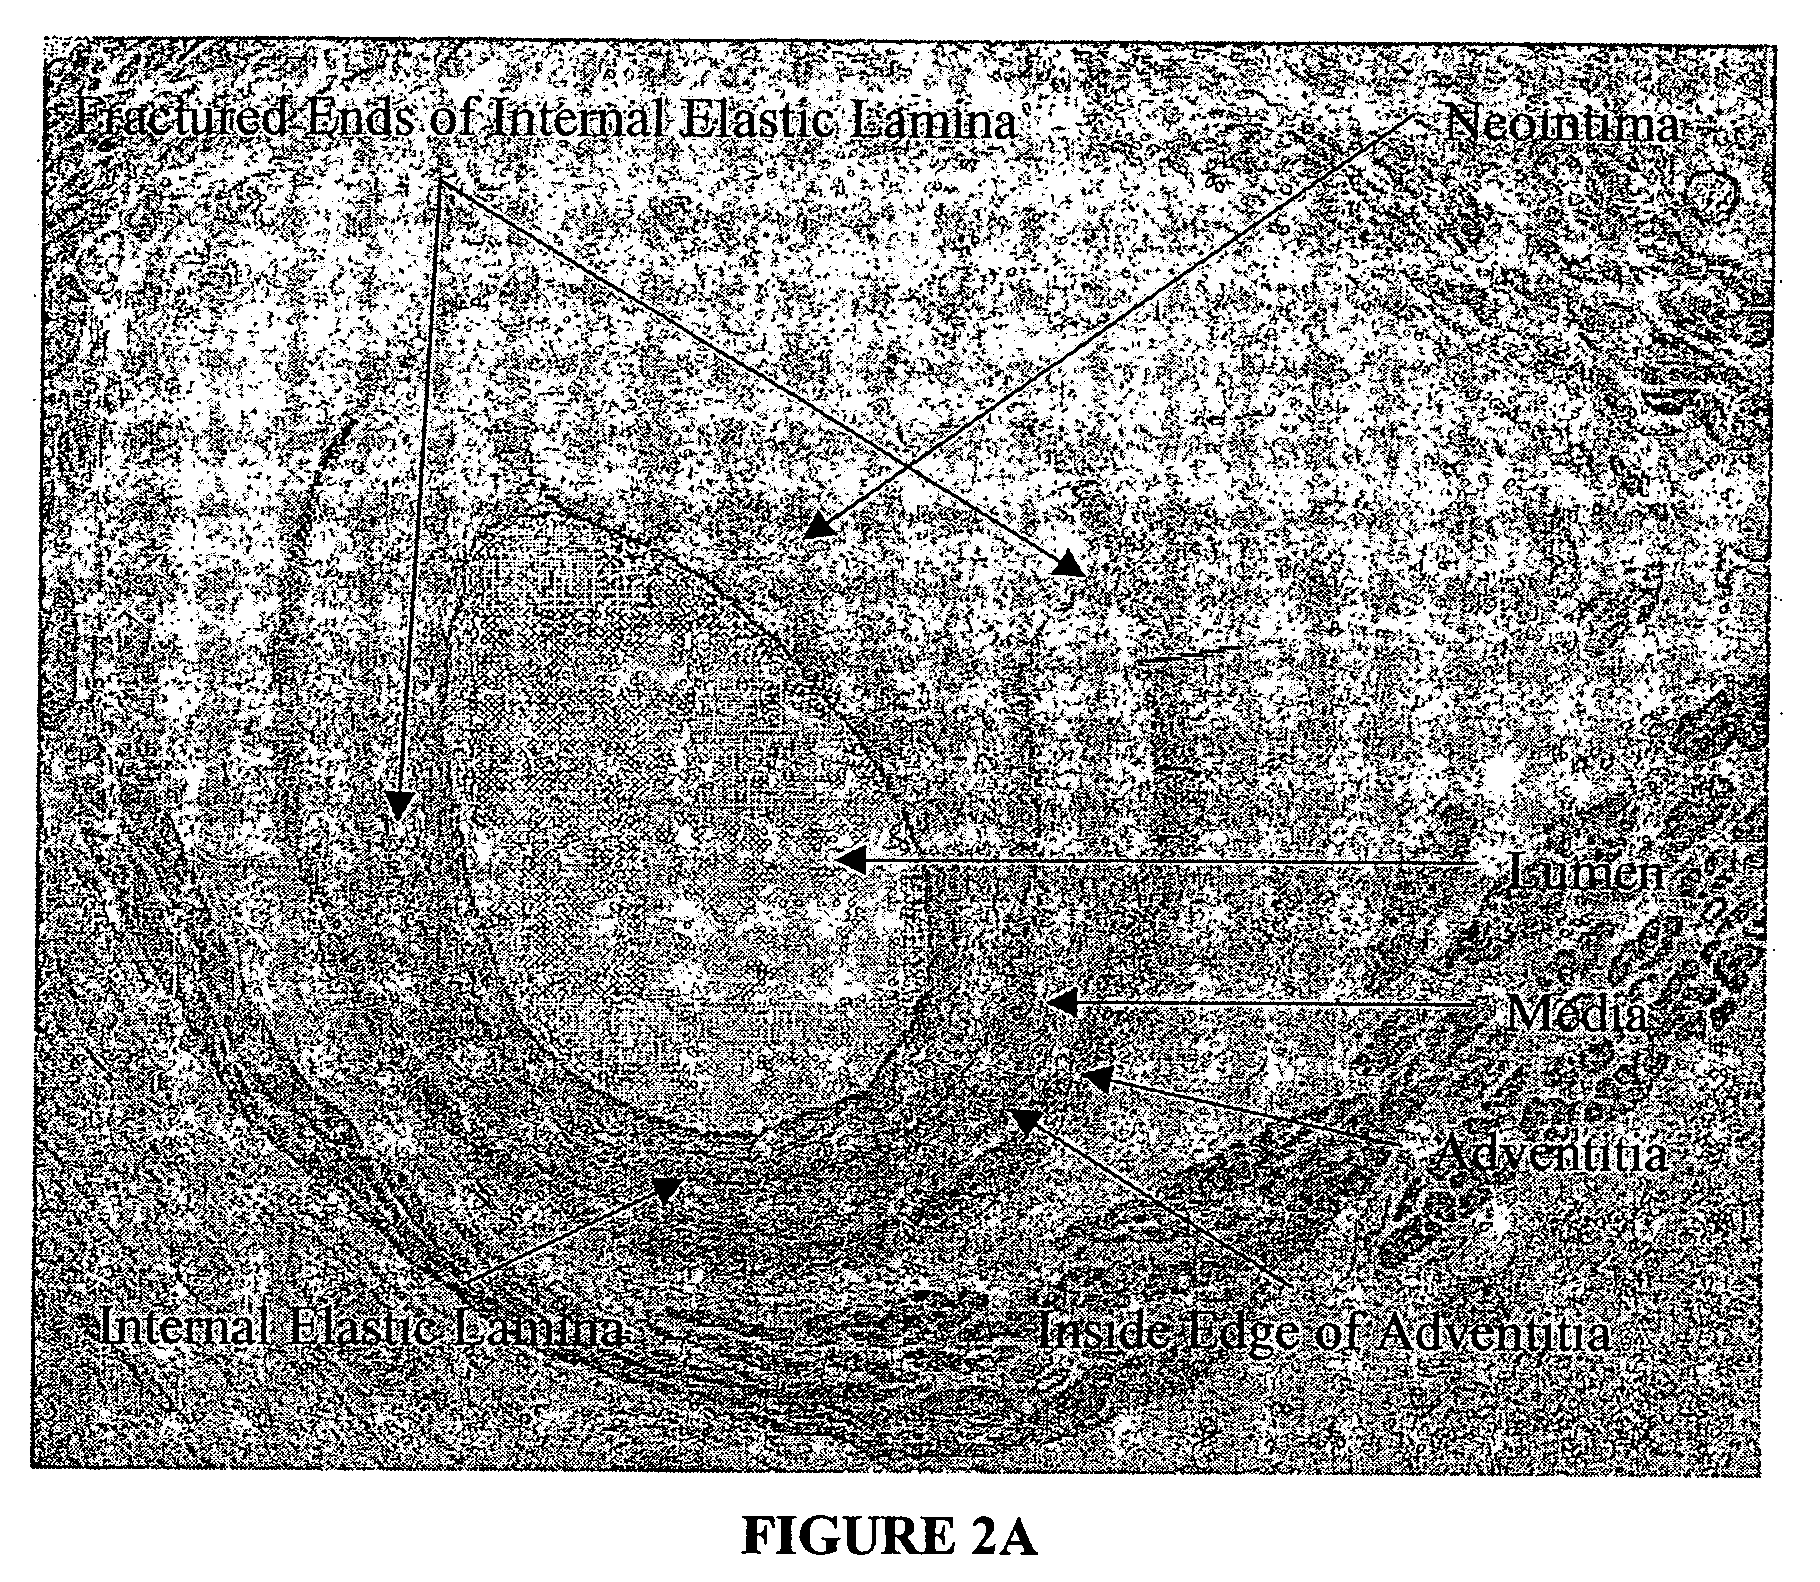
[0027] The present invention relates to a novel approach to an automated measurement and analysis system to quantitatively evaluate tissue structural indices and shape of tissue specimens (for example, cross sections of tissues or organs). The tissue specimens that can be analyzed by the present invention include liver, kidney, bile duct, gastrointestinal tract, lymphatic vessel, bronchia and blood vessels. The section (e.g., cross section) of a given tissue specimen does not necessarily exclude the presence of tissue that is naturally present surrounding the given tissue specimen under study. For example, blood vessels are present in muscle tissue. A cross section of a given blood vessel from ...


PUM


Abstract

We disclose quantitative geometrical analysis enabling the measurement of several features of images of tissues including perimeter, area, and other metrics. Automation of feature extraction creates a high throughput capability that enables analysis of serial sections for more accurate measurement of tissue dimensions. Measurement results are input into a relational database where they can be statistically analyzed and compared across studies. As part of the integrated process, results are also imprinted on the images themselves to facilitate auditing of the results. The analysis is fast, repeatable and accurate while allowing the pathologist to control the measurement process.

Description

[0001] This application is a continuation of U.S. Ser. No. 10 / 041,254, which claims the benefit of U.S. Provisional Application No. 60 / 259,822 filed Jan. 5, 2001 and is a continuation-in-part of U.S. application Ser. No. 09 / 338,904 filed Jun. 23, 1999, U.S. application Ser. No. 09 / 338,909 filed Jun. 23, 1999, and U.S. application Ser. No. 09 / 338,908 filed Jun. 23, 1999. The contents of the U.S. application Ser. Nos. 09 / 338,904, 09 / 338,909, and 09 / 338,908 are incorporated herein by reference in their entirety.FIELD OF THE INVENTION [0002] The present invention generally relates to characterization of tissue for the creation of images and associated data (“tissue information”) suitable for a robust, relational database that manages the input and retrieval of such information needed to perpetuate the tissue information for comparison and combination with tissue information obtained through studies taking place at different times, with different protocols and with measurements made by d...

Claims


Application Information

Patent Timeline
Patent Type & Authority Applications(United States)
IPC IPC(8): C12Q1/00G06K9/00G01N33/50G01N33/68G06F19/00G06T7/00
CPCA61B5/02007G06T2207/30101A61B5/418G01N33/50G01N33/5005G01N33/6803G06F19/321G06F19/3437G06F19/3443G06F19/345G06T7/0012G06T7/0083G06T7/0091G06T7/602G06T2207/10056A61B5/1075G06T7/12G06T7/155G06T7/62G16H50/50G16H50/70G16H50/20G16H30/20
Inventor JOHNSON, PETER C.DEL BRADY, MARYFUHRMAN, MICHAEL G.ABDUL-KARIM, OTHMAN A.SHAH, SUJAL
Owner BIOIMAGENE
Why Eureka
Try Eureka