
Pattern recognition of whole cell mass spectra

a whole cell and mass spectra technology, applied in the field of whole cell mass spectra pattern recognition, can solve the problems of poor reproducibility of methods relying on the detection of biomarkers, particularly those utilizing mass spectrometry, and the drift of mass spectrometers, so as to achieve dramatic improvement in the accuracy of mass spectral identification of the components of a complex mixtur

Active Publication Date: 2005-03-24
NAT INST OF HEALTH REPRESENTED BY THE SEC OF THE DEPT OF HEALTH & HUMAN SERVICES NAT INST OF HEALTH
View PDF4 Cites 53 Cited by
  • Summary
  • Abstract
  • Description
  • Claims
  • Application Information

AI Technical Summary

Benefits of technology

"The present invention provides a method for improving the accuracy of mass spectral identification of components in complex mixtures, especially in biological samples. This is achieved by deconvoluting the mass spectral data and comparing it with a library reference set of mass spectra acquired from samples of known identity. The method corrects for variations in instrument bias and sensitivity drift, which can occur over time and affect the accuracy of the analysis. It also allows for the transfer of the calibration models between different instruments, as the bias across the spectral range is unique to each individual instrument. Overall, the method improves the accuracy of mass spectral analysis and reduces the cost and time-consuming process of recalibration."

Problems solved by technology

Although they represent an improvement in throughput relative to classical methods of identification, the methods that rely on the detection of biomarkers, particularly those utilizing mass spectrometry, suffer from poor reproducibility.
One problem inherent in the field of mass spectrometry is that, over extended periods of time, mass spectrometers can experience sensitivity drift or mass discrimination drift, which is also referred to as instrument bias.

Method used


Image

  • Pattern recognition of whole cell mass spectra
  • Pattern recognition of whole cell mass spectra
  • Pattern recognition of whole cell mass spectra

Examples


example 1

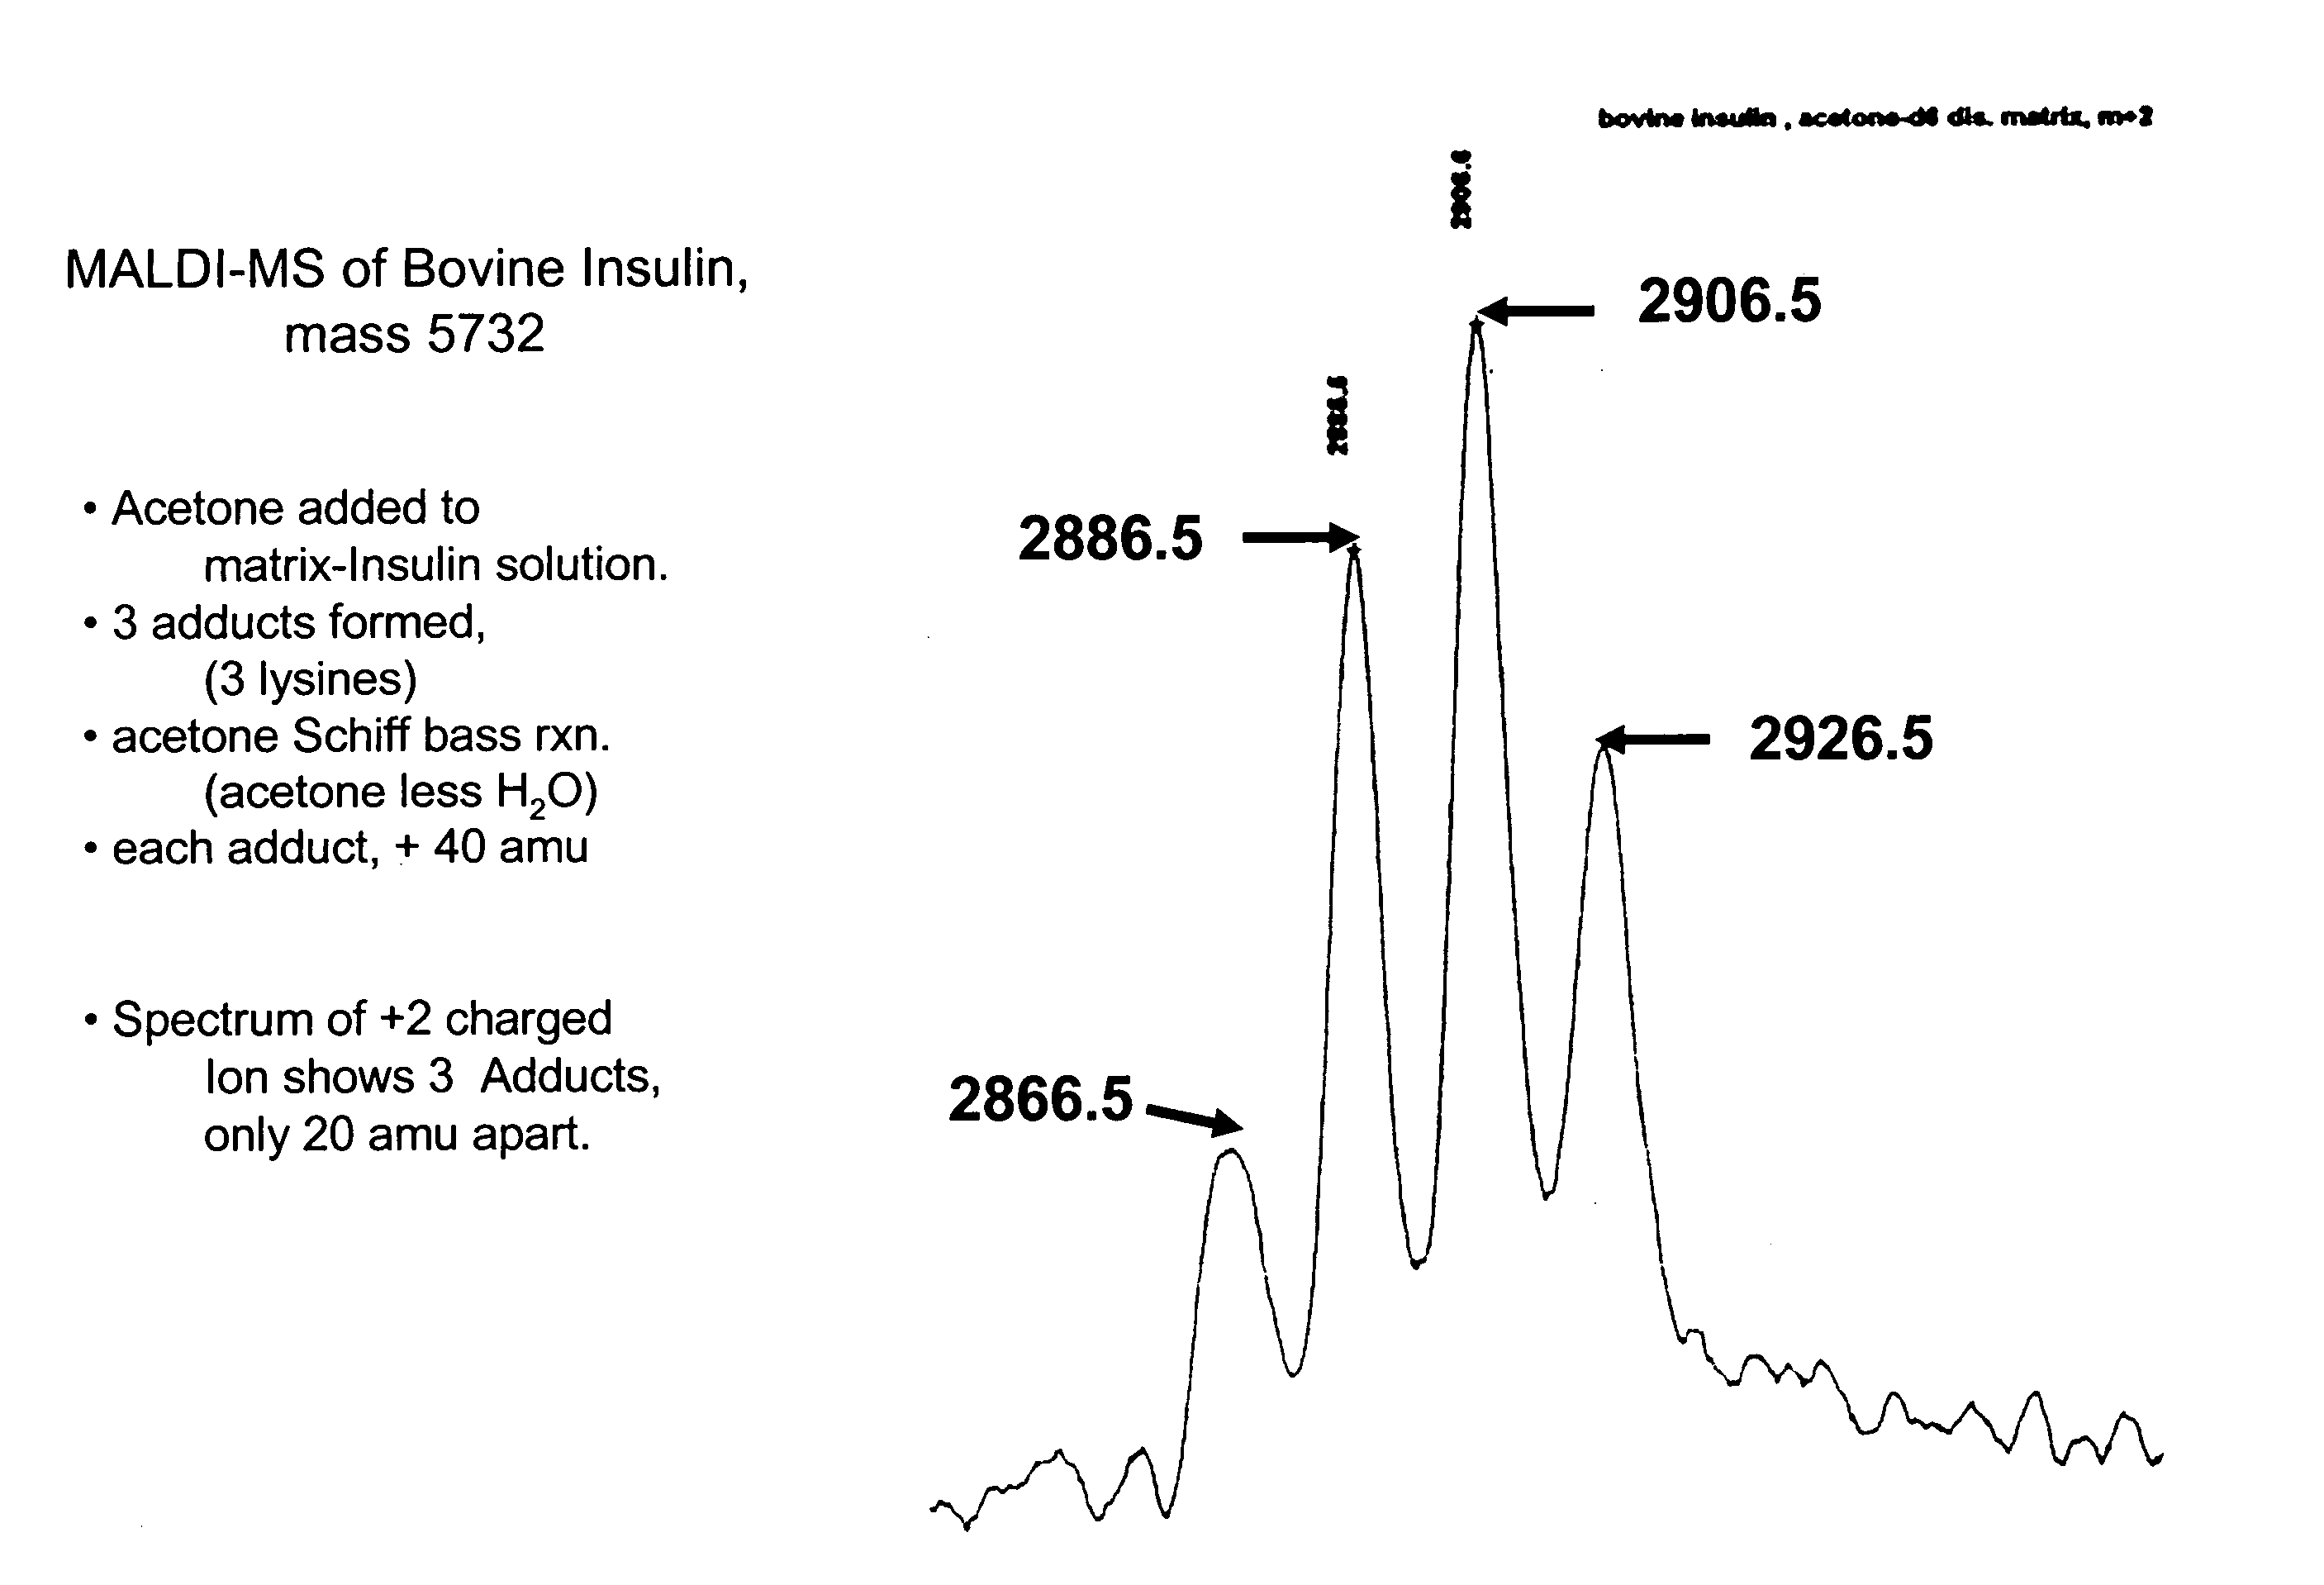
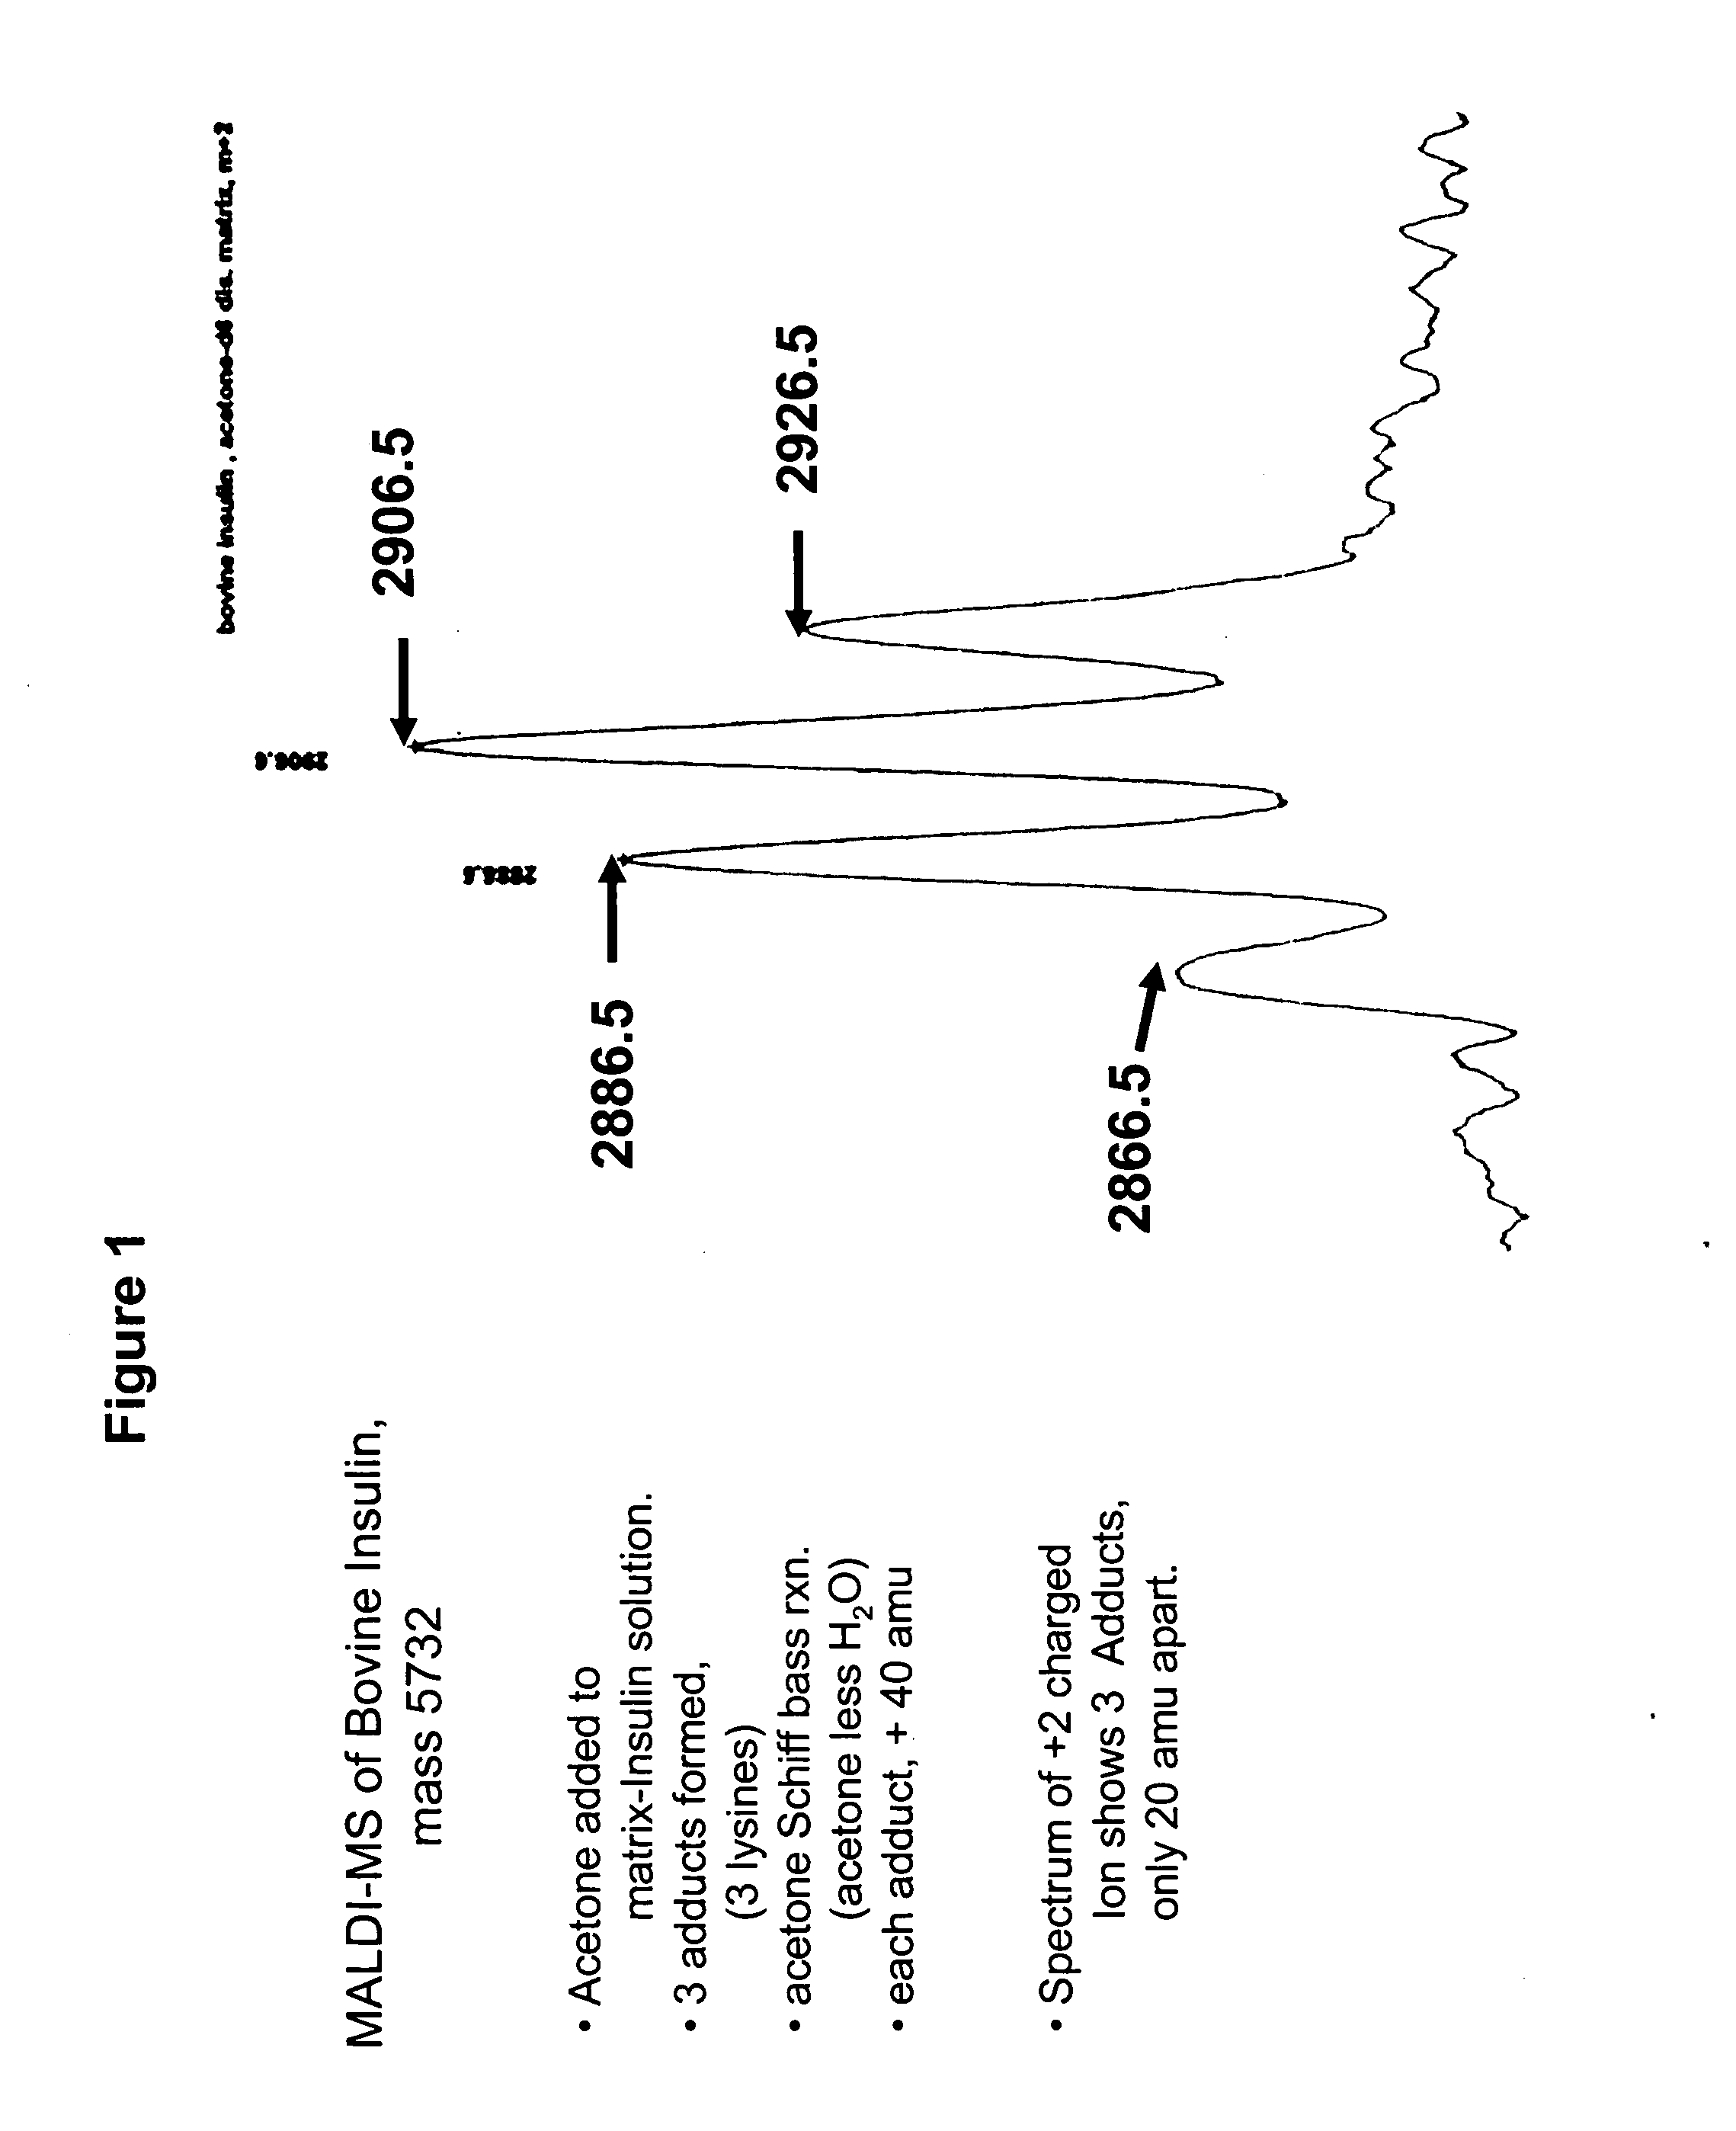
[0153] This example demonstrates that different adducts may form in a MALDI spectra from one molecular fragment in a sample.

[0154] It was hypothesized that MALDI MS applications that use ion intensity will benefit if spectra are pre-processed to sum all ions arising from a particular biomarker at a single m / z value, such as its singly protonated molecule (M+1). In Electrospray MS, a similar computational operation on spectra is known as Charge State Deconvolution.

[0155] To examine this hypothesis, a sample comprising bovine insulin was submitted to MALDI-MS. See, FIG. 1. Four peaks associated with insulin were observed, representing insulin and three different acetone fragment adducts. Acetone (M.W. 58) can react with aromatic amines to form an adduct in which water (M.W. 18) is lost (a Schiff Base reaction.). The adduct is 40 mass units heavier than the original amine. In FIG. 1 the four peaks represent unreacted insulin, and insulin with—respectively—one, two, or three of the av...

example 2

[0156] This example demonstrates that deconvolution of MALDI spectra data from complex biological samples improves reproducibility of the data.

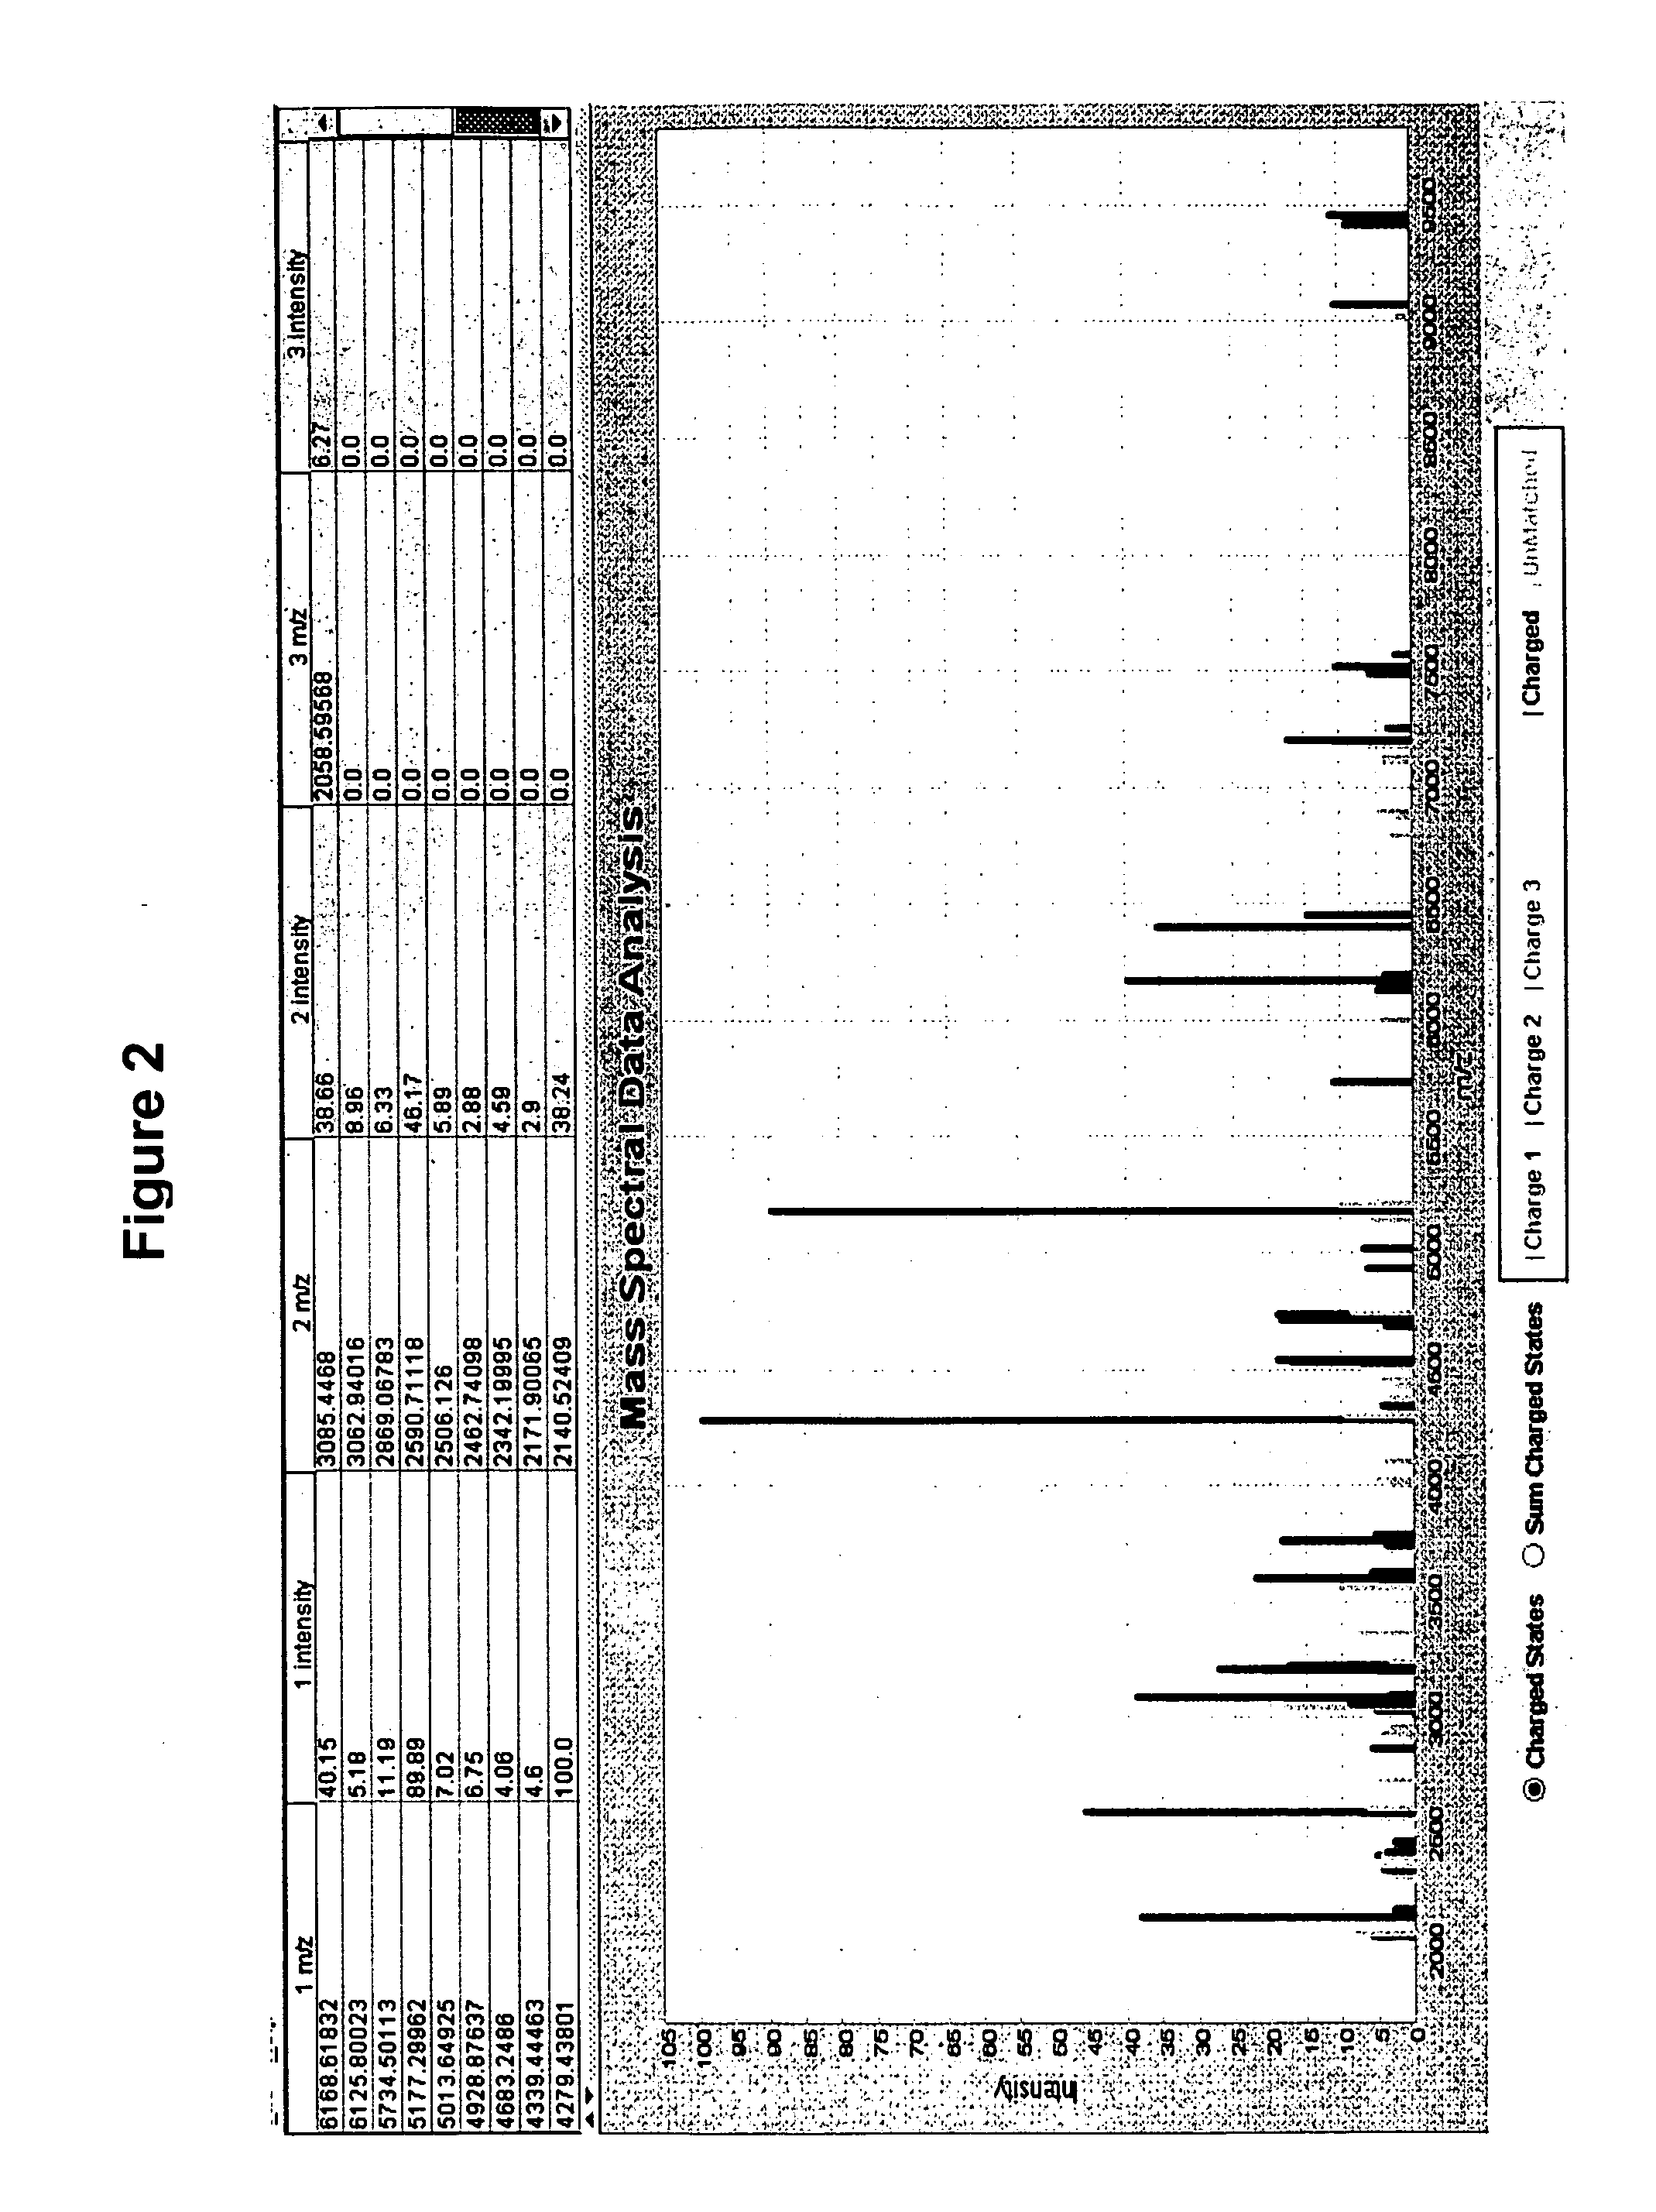
[0157] To identify charge state of each ion cluster, we performed the following analyses on twenty-nine Salmonella enterica isolates (21 of serotype Heidelberg, 3 Anatum, 3 Worthington and 2 Muenster) from a turkey production environment. From the high mass end of the spectrum, we divided each ion peak by 2 or 3, look there for a corresponding peak. Ions at small integer dividends are then tabulated together with the largest, assumed to be a+1 charge state. Based on the assigned charge state, sum intensities (in the raw spectra) arising from nearby adducts or losses were calculated at their charge-state-predicted interval. The total around each same-charge-state cluster were added to the total for the same biomarker at its other identified charge states. Spectra were smoothed, the background was subtracted and then peaks were detected. Decon...


PUM


Abstract

A method for reproducibly analyzing mass spectra from different sample sources is provided. The method deconvolutes the complex spectra by collapsing multiple peaks of different molecular mass that originate from the same molecular fragment into a single peak. The differences in molecular mass are apparent differences caused by different charge states of the fragment and / or different metal ion adducts and / or reactant products of one or more of the charge states. The deconvoluted spectrum is compared to a library of mass spectra acquired from samples of known identity to unambiguously determine the identity of one or more components of the sample undergoing analysis.

Description

CROSS-REFERENCE TO RELATED PATENT APPLICATIONS [0001] The present application claims benefit of priority to U.S. Provisional Patent Application No. 60 / 476,435, filed Jun. 6, 2003, which is incorporate by reference for any purpose.BACKGROUND OF THE INVENTION [0002] Instrumental techniques for identifying one or more components of a complex mixture are of use in diverse fields. Mass spectrometry is a robust and versatile instrumental technique that provides the ability to rapidly sort through complex mixtures and identify the components of the mixture. [0003] The use of mass spectrometry to analyze mixtures of proteins, peptides, oligonucleotides, and noncovalent complexes is rapidly being adopted in biological research, especially for proteome characterization, protein profiling and genomics. There is a well-recognized need for the high throughput identification of these and other species, for example proteins and their post-translational modifications that are, for example, up-regul...

Claims


Application Information

Patent Timeline
Patent Type & Authority Applications(United States)
IPC IPC(8): H01J49/00H01J49/04
CPCH01J49/04
Inventor SHVARTSBURG, ALEXANDREWILKES, JON G.CHIARELLI, PAULHOLLAND, RICKY D.BUZATU, DAN A.BEAUDOIN, MICHAEL A.
Owner NAT INST OF HEALTH REPRESENTED BY THE SEC OF THE DEPT OF HEALTH & HUMAN SERVICES NAT INST OF HEALTH
Learn More