Methods for determining oil and water compositions in drilling muds

a technology of oil and water composition and drilling mud, which is applied in the field of magnetic resonance diagnostic schemes, can solve the problems of time-consuming devices, slow measurement procedures, and limited sampling of drilling materials, and achieve the effects of reducing the number of drilling mud samples, and reducing the accuracy of drilling

Active Publication Date: 2020-01-07
RGT UNIV OF CALIFORNIA
View PDF16 Cites 2 Cited by
  • Summary
  • Abstract
  • Description
  • Claims
  • Application Information

AI Technical Summary

Benefits of technology

[0021]Another aspect of the described technology is to provide a system and method that can provide very quick analysis of oil and water ratios of drilling mud within an actively pumped pipeline contained in a nuclear magnetic resonance spectrometer magnet and radio frequency coil. The flow is stopped and the 1-D or 2-D nuclear magnetic resonance procedure is applied to measure the oil and water volume percent of the fluid.

Problems solved by technology

Circulation of drilling muds to the drill bit and back to the surface can often take several hours to complete.
This measurement procedure is slow and can only be performed on a small volume of the sample of drilling material.
Distillation apparatuses such as retorts are typically used to measure the oil and water compositions in drilling muds, but these devices are time consuming to operate and clean.
A weakness with T2 measurement techniques is possible overlap of the peaks that are attributed to oil and water.
This is problematic as this requires the peak to have a shoulder in order to partition the peak.
This is problematic for solutions where the overlapped peak is already at a very short relaxation time.
However, adding a paramagnetic ion is not practical for in-line and on-line determination of water and oil fractions in a stream of drilling mud.

Method used


Image

  • Methods for determining oil and water compositions in drilling muds
  • Methods for determining oil and water compositions in drilling muds
  • Methods for determining oil and water compositions in drilling muds

Examples


example 1

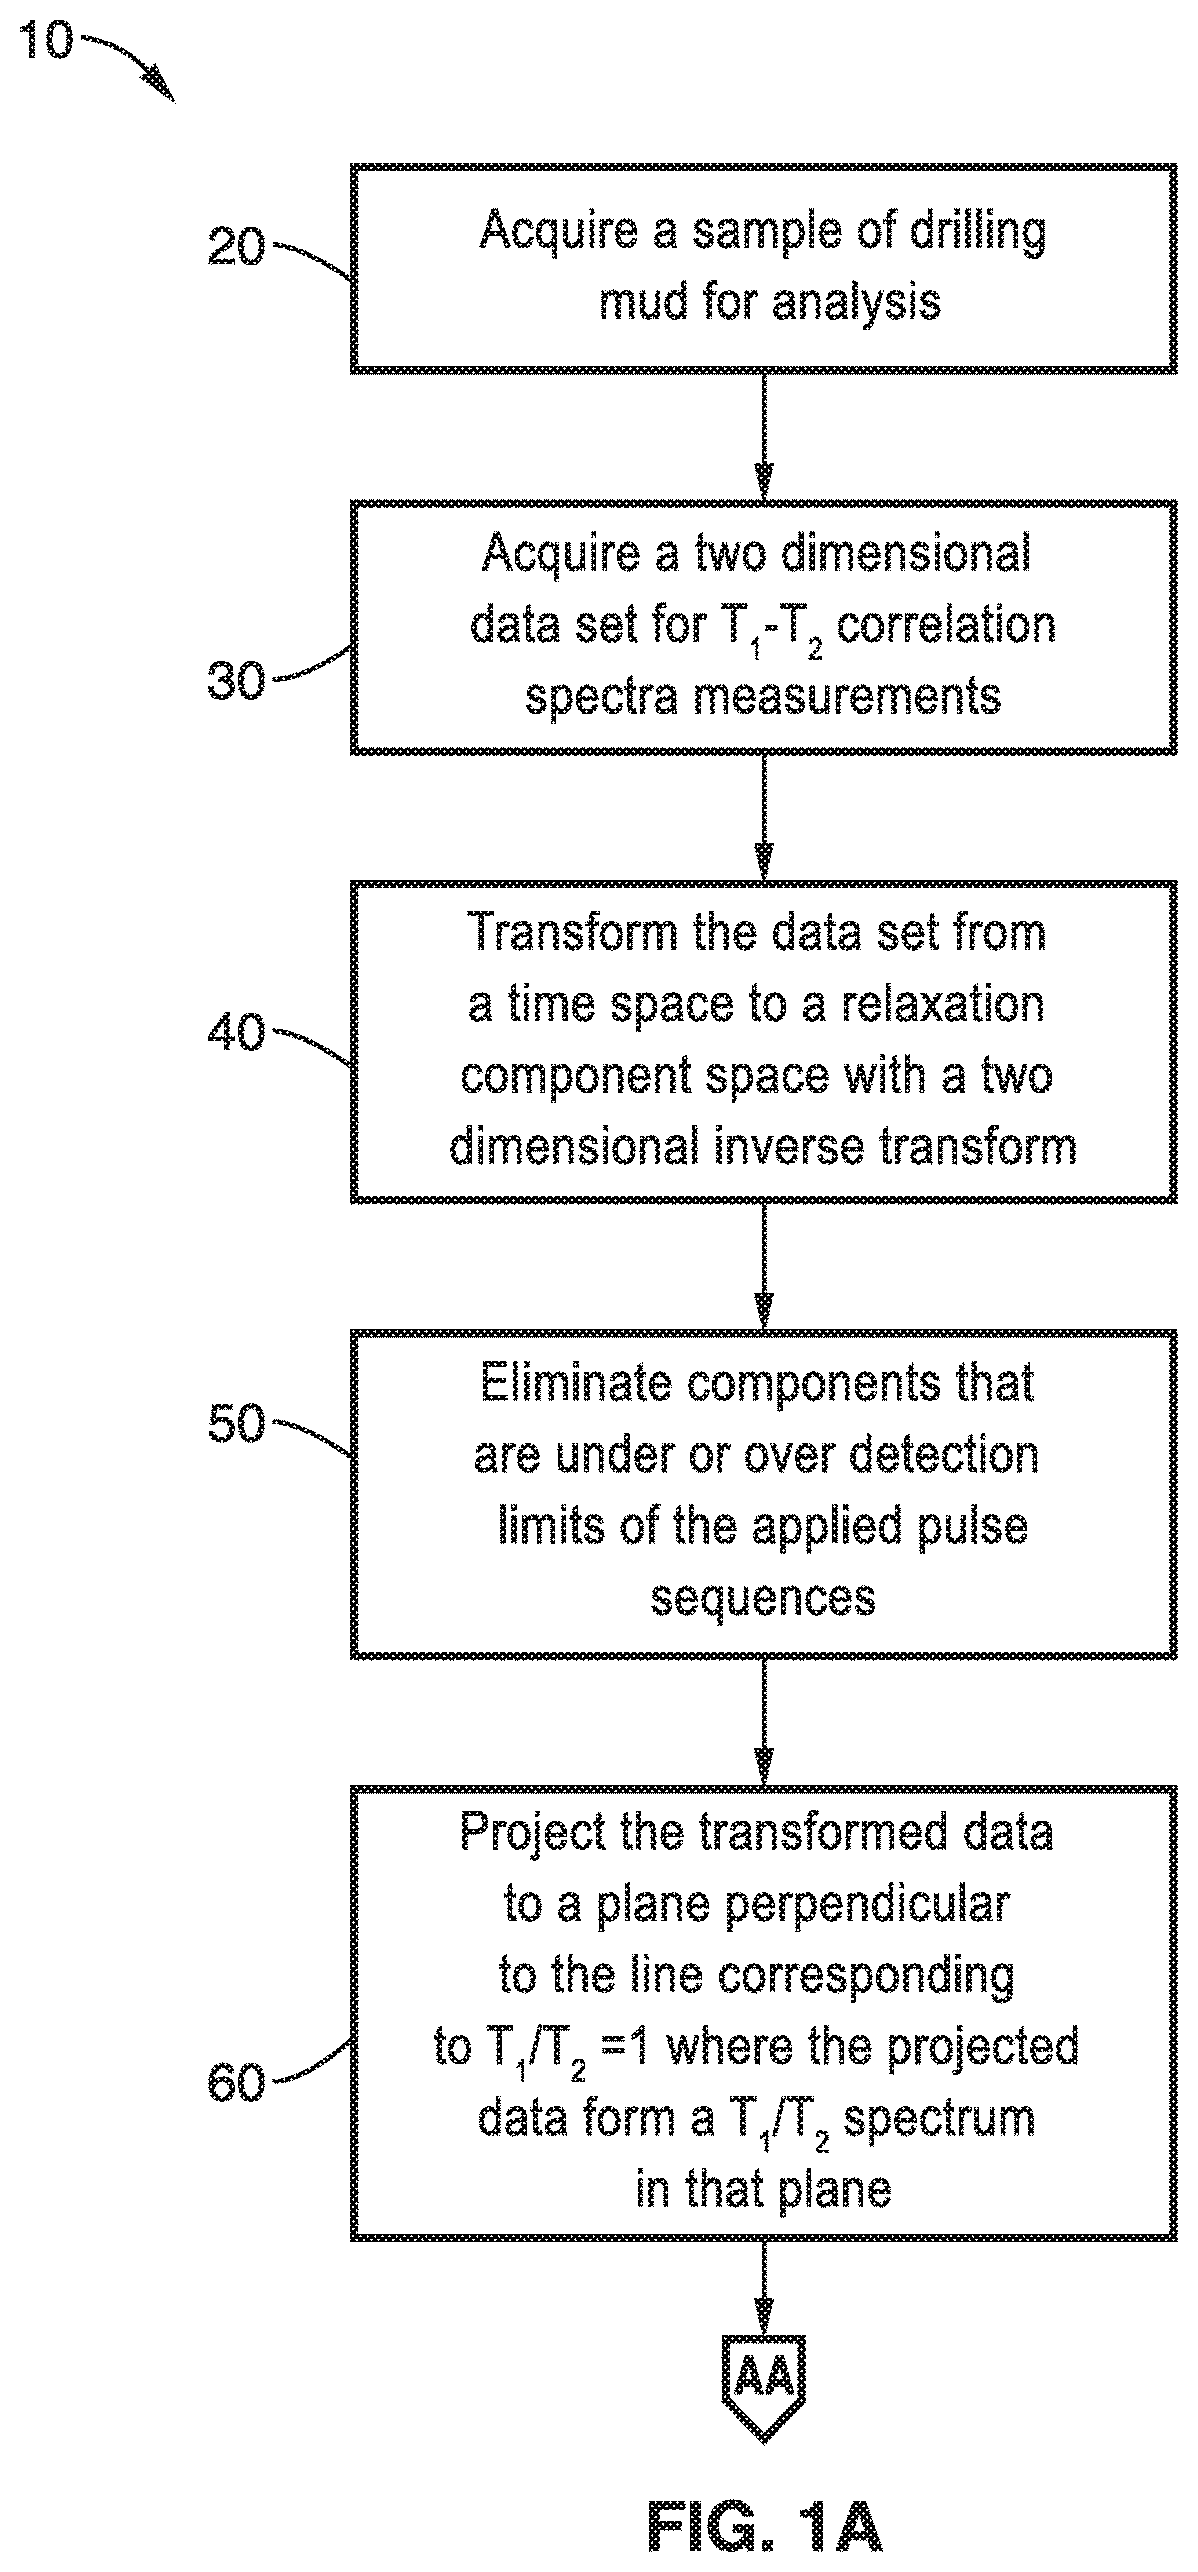
[0042]In order to demonstrate the technology, analysis of different samples of drilling mud with a range of water and oil percentages was conducted. Water cut measurements were performed on the well blended samples that were loaded into small vials. The range of water cut of interest is 10%-30%. A mud with 28.57% water cut was used as the base mud. Different amounts of diesel were added to the base mud to create various samples of mud with different water cut percentages within the range of interest. Water was added to drilling mud samples to increase their water fraction [m / m]. As the water percentage was increased, the ratio of the signals from the transformed data gave a linear response. Based on the water added, the original water content could also be determined.

[0043]The first method tested for the NMR measurement of watercut of the samples was the one-dimensional NMR method. The one-dimensional method only used with drilling muds that show a distinctive separation of water an...

example 2

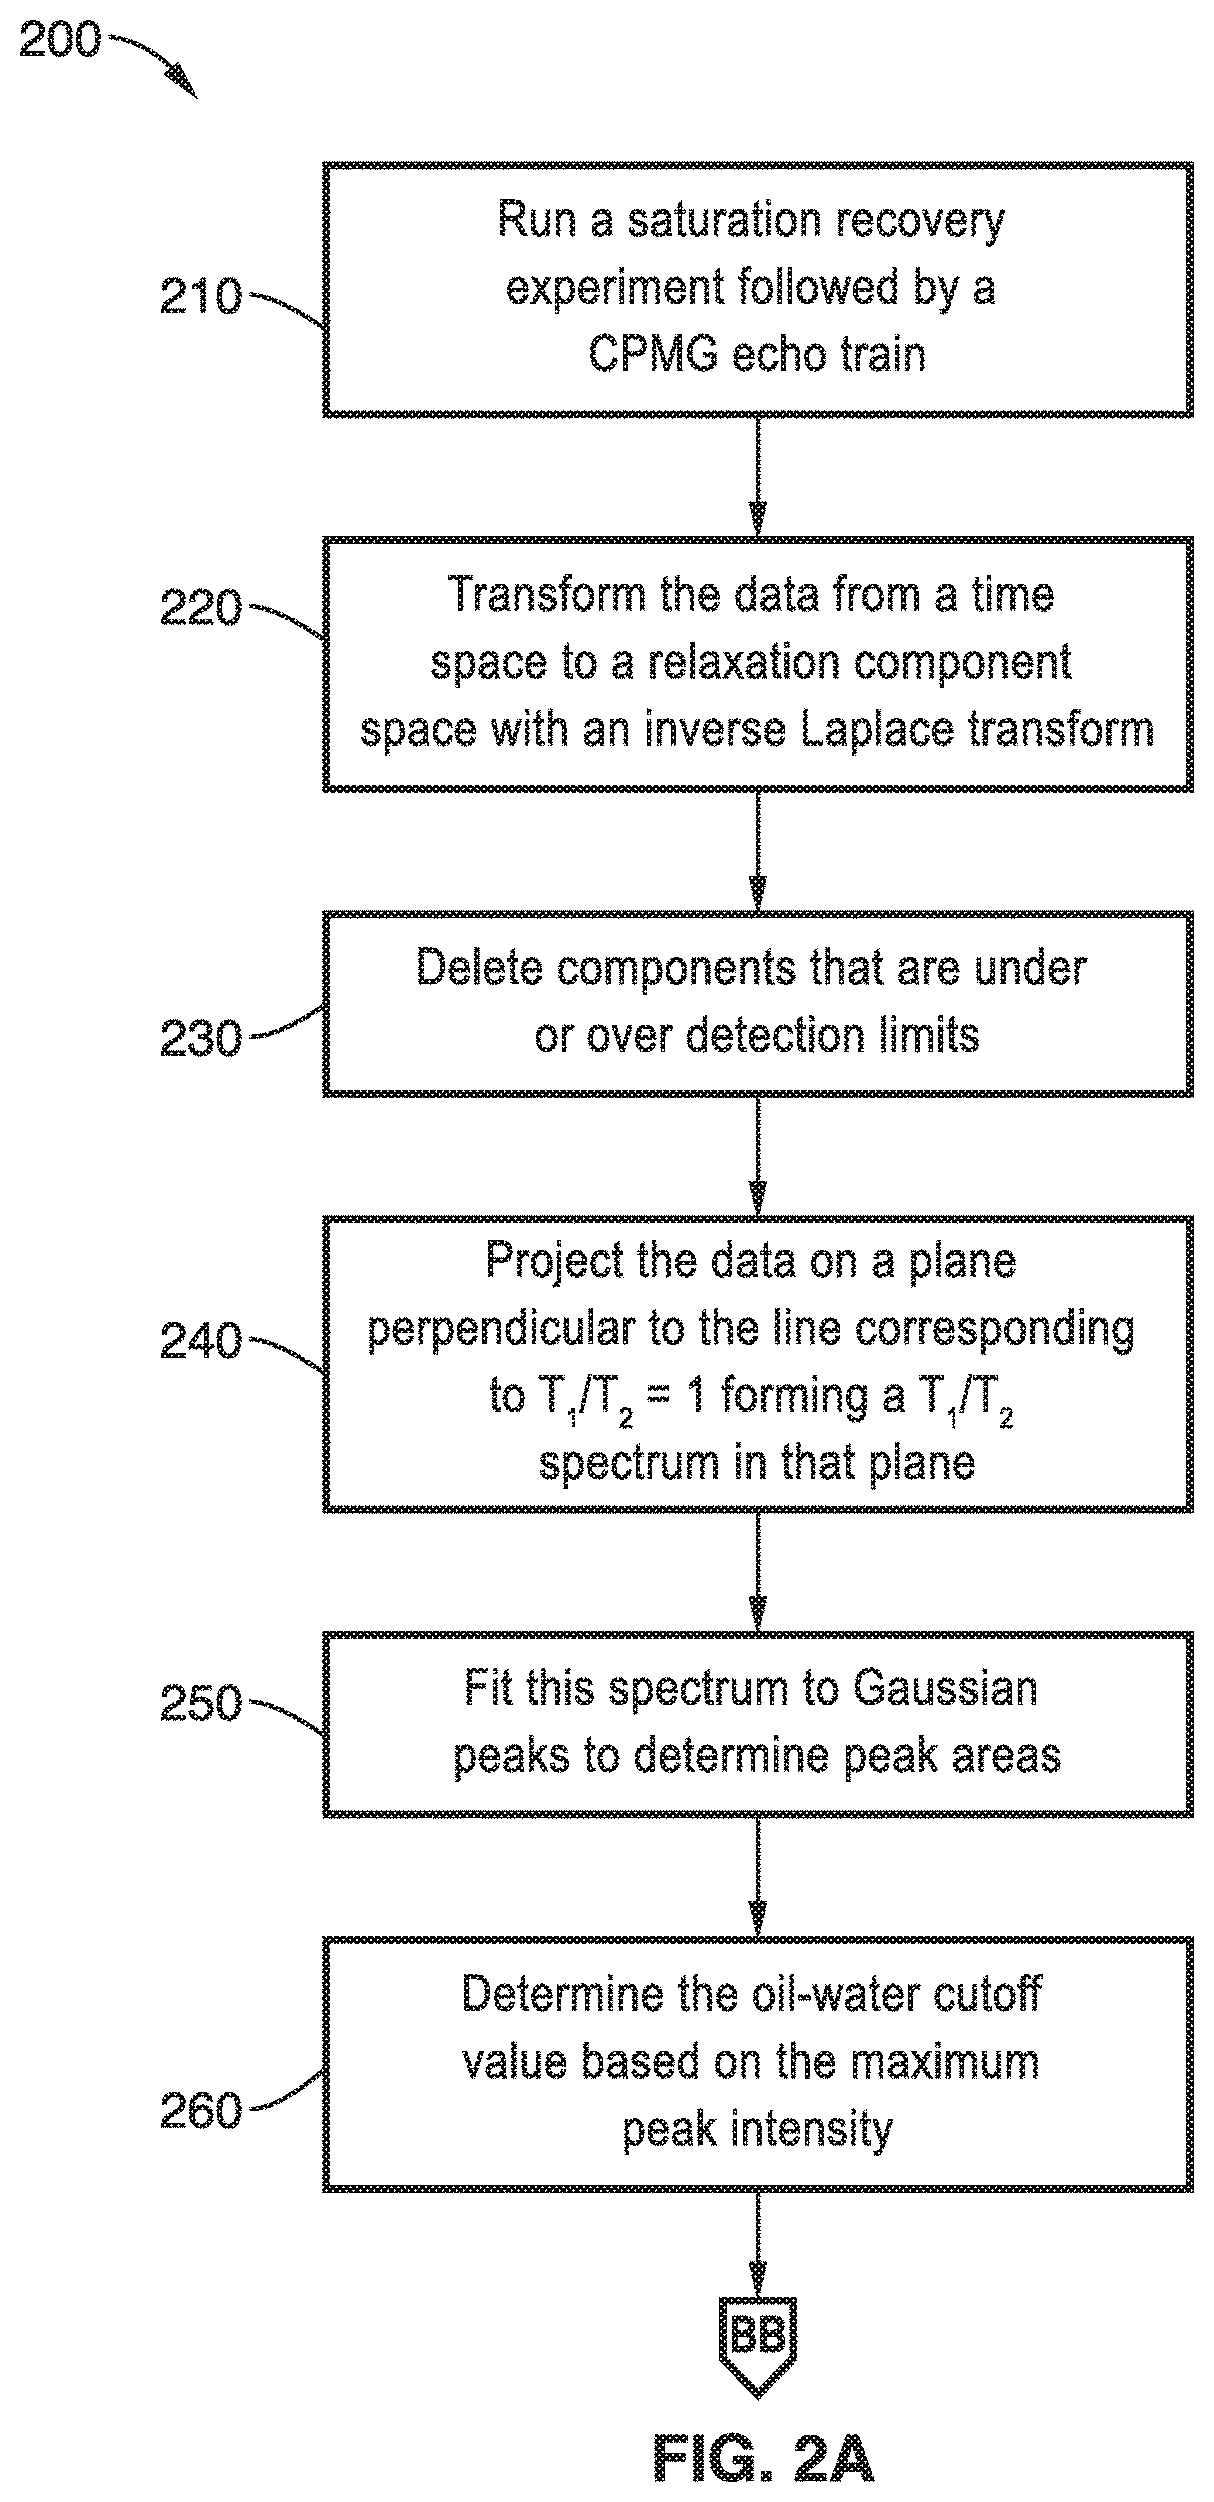
[0045]To further demonstrate the operational principles of the methods, a variety of drilling muds with differing oil and water contents were analyzed using a two-dimensional method. Referring now to FIG. 2A and FIG. 2B, an illustration of the method 200 using a two-dimensional approach is shown schematically. Drilling mud was placed in the NMR spectrometer or pumped to the coil of the spectrometer in a flow setup. The sample was measured using a saturation recovery sequence followed by a CPMG echo train with optimized parameters at block 210 of FIG. 2A.

[0046]The saturation recovery pulse sequence was used to record the T1 relaxation behavior, and the CPMG sequence was used to capture the T2 relaxation behavior for each of the delay or repetition times in the saturation recovery pulse sequence.

[0047]The T1-T2 relaxation data was transformed at block 220 to a two dimensional T1-T2 correlation spectrum using a two dimensional inverse Laplace transformation. The components that were ob...


PUM

PropertyMeasurementUnit
thresholdaaaaaaaaaa
nuclear magnetic resonanceaaaaaaaaaa
NMRaaaaaaaaaa

Abstract

A nuclear magnetic resonance (NMR) system and method for determining oil and water composition in drilling mud by separating out signals from oil and water in a two dimensional relaxation space wherein the oil and water ratio is a function of the separated out signals. The spin-lattice relaxation time distribution or a spin-spin relaxation time distribution of the sample is measured and a spin-lattice versus spin-spin or a spin-spin versus diffusion two-dimensional procedure is applied to separate the components of the drilling fluid. The signal intensities from the oil and water regions of the one-dimensional or two-dimensional NMR measurements are used to quantify the relative portion of the proton NMR signal from the oil and water and to determine the ratio of oil and water in the drilling mud.

Description

CROSS-REFERENCE TO RELATED APPLICATIONS[0001]This application is a 35 U.S.C. § 111(a) continuation of PCT international application number PCT / US2015 / 031165 filed on May 15, 2015, incorporated herein by reference in its entirety, which claims priority to, and the benefit of, U.S. provisional patent application Ser. No. 61 / 993,560 filed on May 15, 2014, incorporated herein by reference in its entirety. Priority is claimed to each of the foregoing applications.[0002]The above-referenced PCT international application was published as PCT International Publication No. WO 2015 / 175985 on Nov. 19, 2015, which publication is incorporated herein by reference in its entirety.STATEMENT REGARDING FEDERALLY SPONSORED RESEARCH OR DEVELOPMENT[0003]Not Applicable.INCORPORATION-BY-REFERENCE OF COMPUTER PROGRAM APPENDIX[0004]Not ApplicableBACKGROUND[0005]1. Technical Field[0006]The present technology pertains generally to magnetic resonance diagnostic schemes and more particularly to an NMR based met...

Claims


Application Information

Patent Timeline
Patent Type & Authority Patents(United States)
IPC IPC(8): G01V3/00G01R33/44G01R33/50G01N24/08
CPCG01R33/50G01N24/081G01R33/448
Inventor MCCARTHY, MICHAEL J.LIM, VICTORZHANG, LU
Owner RGT UNIV OF CALIFORNIA
Why Eureka
Try Eureka