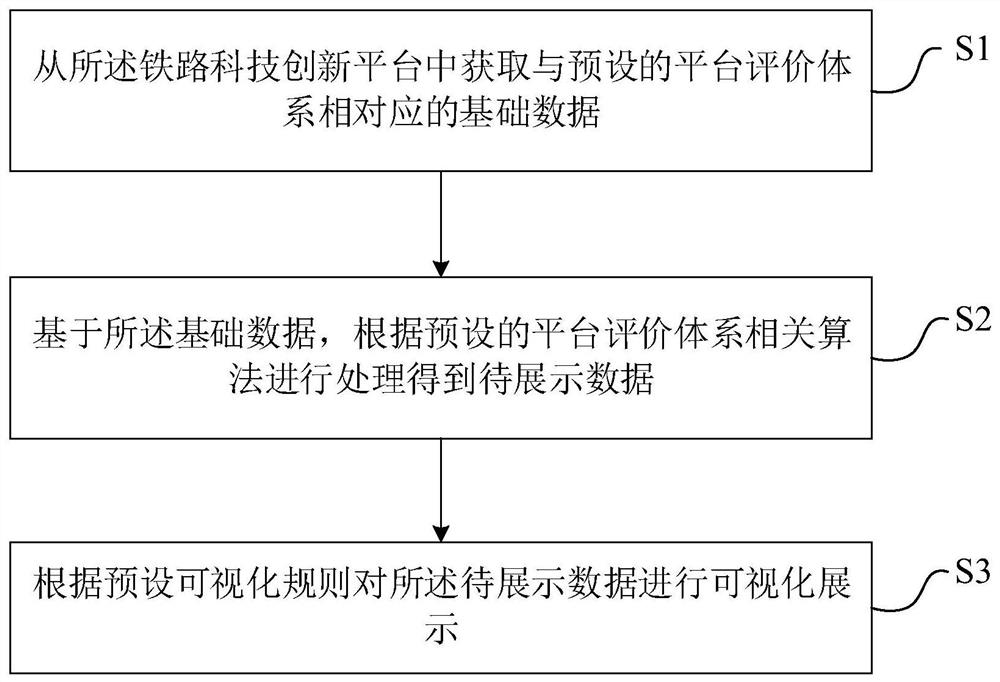
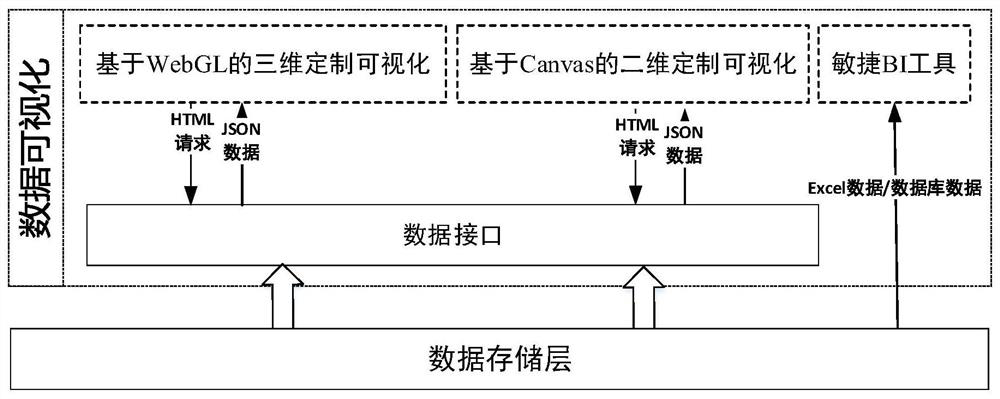
Data visualization method and system based on railway technology innovation platform
A basic data and data technology, applied in the field of data processing, can solve the problems of lack of research and application of data visualization technology, evaluation system and related algorithm application data analysis and visualization system, lack of visual analysis and visualization system and method, etc.
- Summary
- Abstract
- Description
- Claims
- Application Information
AI Technical Summary
Problems solved by technology
Method used
Image
Examples
example 1
[0093] Example 1: Multi-dimensional personnel portraits provide management reference for managers. In terms of talent reserve and training, in addition to paying attention to the basic information such as professional skills, academic degrees, and technical titles of relevant personnel in the scientific and technological innovation platform, we must also pay attention to the time and frequency of academic research activities such as scientific research and testing that each person participates in. Maximize the professional expertise of each person, pay attention to the absorption and training of outstanding scientific research talents, and commit to building a research team with strong innovation ability and reasonable structure. In this regard, the introduction of portraits of scientific research workers provides comprehensive and multi-dimensional analysis and visual display of each scientific research worker, providing decision support for talent reserve and training. For e...
example 2
[0095] Example 2: Perform data analysis while performing multi-angle three-dimensional chord diagram display on equipment data. In the management and construction of scientific and technological innovation platforms, instruments and equipment are the prerequisite for quality assurance of laboratory work. Since the "average operating rate of equipment above 300,000 yuan" indicator is a key indicator in the annual report of the national key laboratory of the enterprise, it is necessary to visualize and analyze the equipment data.
[0096] The algorithm of the machine time rate is: the standard machine time of each equipment is K=1800 hours / year; the research work switchboard time (D) refers to the total time used by the laboratory researchers for each instrument every year; the service work switchboard time (E ) refers to the total time that each instrument is used by non-laboratory staff each year; machine time rate (%)=(D+E) / K.
[0097] Select the computer time rate of the eq...
example 3
[0098] Example 3: In terms of patent authorization, based on the visualization method and technical framework proposed in this invention, the Sankey diagram is used for visual analysis, and the three types of patents, namely invention, utility model, and design, are associated with the laboratories of the scientific and technological innovation platform Correspondingly, through the visual view, it can be seen intuitively which laboratory has more outstanding achievements in invention patents and utility models.
[0099] Compared with the prior art, the present invention has the following beneficial effects:
PUM
 Abstract
Description
Claims
Application Information
 - Generate Ideas
- Intellectual Property
- Life Sciences
- Materials
- Tech Scout
- Unparalleled Data Quality
- Higher Quality Content
- 60% Fewer Hallucinations
Browse by: Latest US Patents, China's latest patents, Technical Efficacy Thesaurus, Application Domain, Technology Topic, Popular Technical Reports.
© 2025 PatSnap. All rights reserved.Legal|Privacy policy|Modern Slavery Act Transparency Statement|Sitemap|About US| Contact US: help@patsnap.com


