Cross-multi-data-center data distributed processing acceleration method and system
A distributed processing and multi-data technology, applied in the field of data analysis, can solve problems such as insufficient consideration of site heterogeneity
- Summary
- Abstract
- Description
- Claims
- Application Information
AI Technical Summary
Problems solved by technology
Method used
Image
Examples
Embodiment 1
[0205] This embodiment evaluates the performance of SDTP by comparing SDTP with several classic task placement methods, and comparing the average response time and average slowdown, mainly by reducing the average response time and average slowdown compared with various methods to draw conclusions. Among them, slowdown is defined as the reduction rate of response time of a single job compared with other methods. For example, the response time of job A using In-Place is , the response time of job A using SDTP is ; Therefore, compared to using the In-Place response time, the slowdown of job A is . The average slowdown is the sum of all slowdowns for each job divided by the number of jobs.
[0206] Figure 9 (a) shows SDTP's improvement in average job response time with varying numbers of stations. Clearly, SDTP significantly outperforms other baseline methods. In particular, when the number of sites is 10, our method reduces the average job response time of all job type...
Embodiment 2
[0214] This example will quantify the effect of various parameters on SDTP, including and the number of compute instances, It is the ratio of the intermediate data volume to the input data import stage.
[0215] Figure 12 (a) depicts Impact. The figure shows the different The value of the response time and the the ratio of Yes response time. It can be seen that the job response time varies with increased by the increase. This is because the larger Will generate more intermediate data. Transmitting these intermediate data during the shuffle phase and processing this intermediate data during the reduce phase may increase the overall response time.
[0216] Figure 12 (b) illustrates the difference compared to In-Place, Iridium and Tetrium The reduction in the average response time of the value. It can be observed that as q increases, the reduction in average response time increases compared to Tetrium, while the reduction in average response time is rela...
Embodiment 3
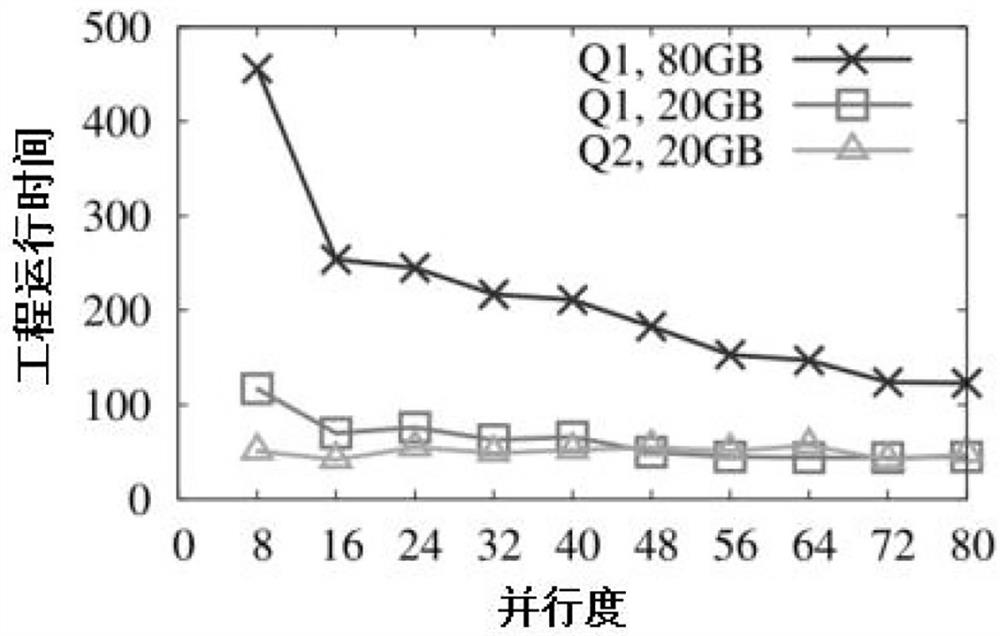
[0220] This embodiment considers the impact of parallelism in parallel computing. The effect of the prediction method on the response time of different stages is first evaluated. Thereafter, the impact of computational properties on different methods in parallel computing and the improvement in the average response time of methods is evaluated taking into account the degree of parallelism.
[0221] This embodiment uses BigDataBench to measure the time of multiple queries running on Spark with different data volumes and degrees of parallelism. According to the results, this embodiment uses a multiple linear regression algorithm to build a prediction model for the calculation time of each stage. The results showed that the R2 statistic was greater than 0.9, where R was the correlation coefficient. The value of the F statistic is greater than the value according to the F distribution table. The probabilities p corresponding to the F statistic are all less than 0.0001. That is...
PUM
 Abstract
Description
Claims
Application Information
 - R&D
- Intellectual Property
- Life Sciences
- Materials
- Tech Scout
- Unparalleled Data Quality
- Higher Quality Content
- 60% Fewer Hallucinations
Browse by: Latest US Patents, China's latest patents, Technical Efficacy Thesaurus, Application Domain, Technology Topic, Popular Technical Reports.
© 2025 PatSnap. All rights reserved.Legal|Privacy policy|Modern Slavery Act Transparency Statement|Sitemap|About US| Contact US: help@patsnap.com


