CCD adaptive integration time and frequency spectrum visualization system
An integration time and self-adaptive technology, applied in the field of spectrum detection, can solve problems such as unfavorable data visualization analysis, stuck linearity, large relative error, etc., and achieve the effect of solving delay stuck phenomenon, saving operation time, and reducing integration time
- Summary
- Abstract
- Description
- Claims
- Application Information
AI Technical Summary
Problems solved by technology
Method used
Image
Examples
Embodiment Construction
[0041] The present invention will be further described below in conjunction with the accompanying drawings and embodiments.
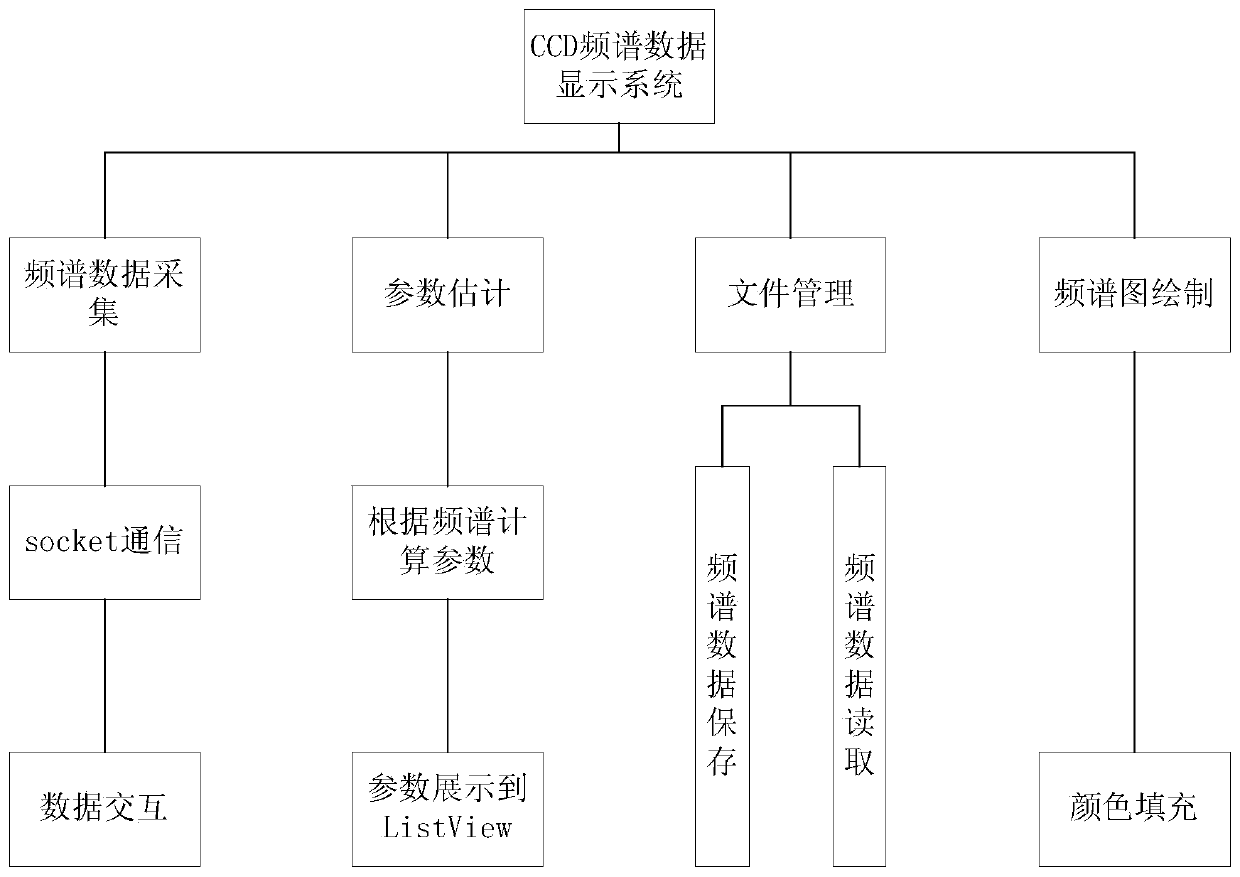
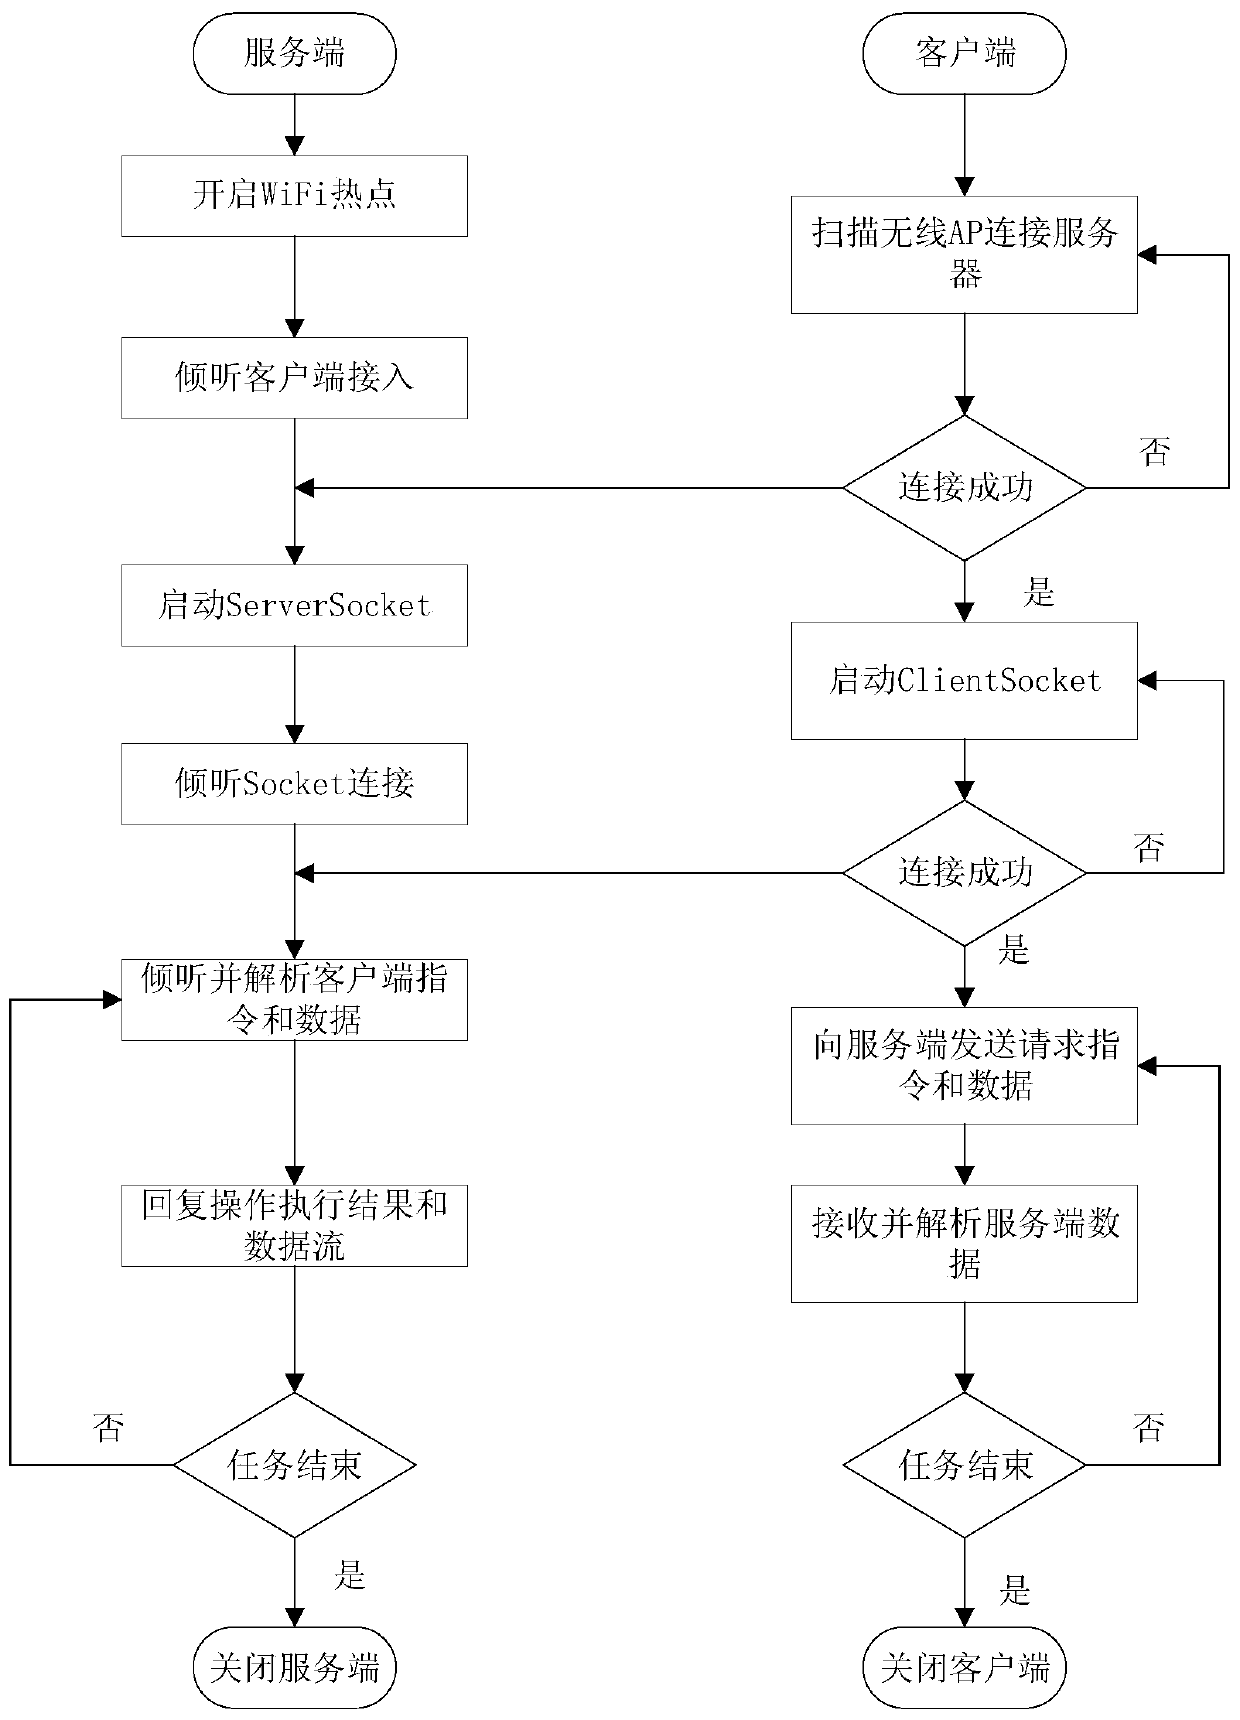
[0042] refer to Figure 1 to Figure 7 , a CCD adaptive integration time and spectrum visualization system, including a spectrum distribution data collection part, a parameter estimation part, a file management part and a spectrum diagram drawing part, the spectrum distribution data collection part includes opening and connecting the collection device, setting the collection integration Time and collection spectrum commands; the parameter estimation part analyzes and processes the collected data, calculates the spectrum parameters, and displays them in the ListView; the file management part saves the spectrum distribution data in the SD card in the form of a flow to specify In the folder, the saved data can be viewed in real time; the spectrogram drawing part includes spectrogram drawing, with N discrete wavelengths between 380nm and 780nm as the absciss...
PUM
 Abstract
Description
Claims
Application Information
 - R&D
- Intellectual Property
- Life Sciences
- Materials
- Tech Scout
- Unparalleled Data Quality
- Higher Quality Content
- 60% Fewer Hallucinations
Browse by: Latest US Patents, China's latest patents, Technical Efficacy Thesaurus, Application Domain, Technology Topic, Popular Technical Reports.
© 2025 PatSnap. All rights reserved.Legal|Privacy policy|Modern Slavery Act Transparency Statement|Sitemap|About US| Contact US: help@patsnap.com


