
Historical data analysis-based abnormality monitoring method and system of power distribution network

A technology for historical data and abnormal monitoring, applied in information technology support systems, electrical components, circuit devices, etc., can solve problems such as difficulty in popularization and application, inability to access power distribution information to automation systems, and inability to monitor branch lines.

Active Publication Date: 2018-01-19
STATE GRID SHANDONG ELECTRIC POWER +1
View PDF7 Cites 6 Cited by
  • Summary
  • Abstract
  • Description
  • Claims
  • Application Information

AI Technical Summary

Problems solved by technology

[0003] 1. There are still a considerable number of non-automated power distribution equipment in the distribution network that do not have the conditions for transformation, and their power distribution information cannot be connected to the automation system, resulting in a large number of branch lines that cannot be monitored
[0004] 2. The communication methods of existing automated power distribution equipment are not unified, and there are many methods, such as EPON (Ethernet Passive Optical Network, Ethernet Passive Optical Network), power line carrier, wireless private network, wireless public network, etc., different communication methods, Its reliability and security are different, and the accuracy and availability of data are insufficient.
[0005] 3. Part of the power distribution equipment has defects or failures, which makes its remote signaling and telemetry data unavailable
First of all, the premise of this method is that a sufficient number of automation equipment with high reliability and real-time remote signaling and telemetry functions are installed in the distribution network. However, in the existing domestic distribution network field, only the core urban areas of large and medium-sized cities Some of the distribution lines can be equipped with complete distribution automation equipment, so its application range is limited; secondly, the method has a huge amount of data, especially the amount of calculation, and has high requirements for technical support systems, so it is difficult to popularize and apply it in power supply enterprises; , the readability of its data is poor, whether it is a high-dimensional space-time monitoring matrix or a matrix after dimensionality reduction, it is impossible to artificially understand the information contained in its massive data

Method used


Image

  • Historical data analysis-based abnormality monitoring method and system of power distribution network
  • Historical data analysis-based abnormality monitoring method and system of power distribution network
  • Historical data analysis-based abnormality monitoring method and system of power distribution network

Examples


Embodiment Construction

[0092] In order to enable those skilled in the art to better understand the technical solutions in this application, the technical solutions in the embodiments of the present invention will be clearly and completely described below in conjunction with the drawings in the embodiments of the present invention. Obviously, the described implementation Examples are only some of the embodiments of the present invention, not all of them. Based on the embodiments of the present invention, all other embodiments obtained by those skilled in the art without creative efforts shall fall within the protection scope of the present invention.

[0093] A distribution network abnormality monitoring method and system based on historical data analysis provided by the embodiments of the present invention will be described in detail below in conjunction with the accompanying drawings. Although the present invention provides the method operation steps described in the following embodiments or flow ch...


PUM


Abstract

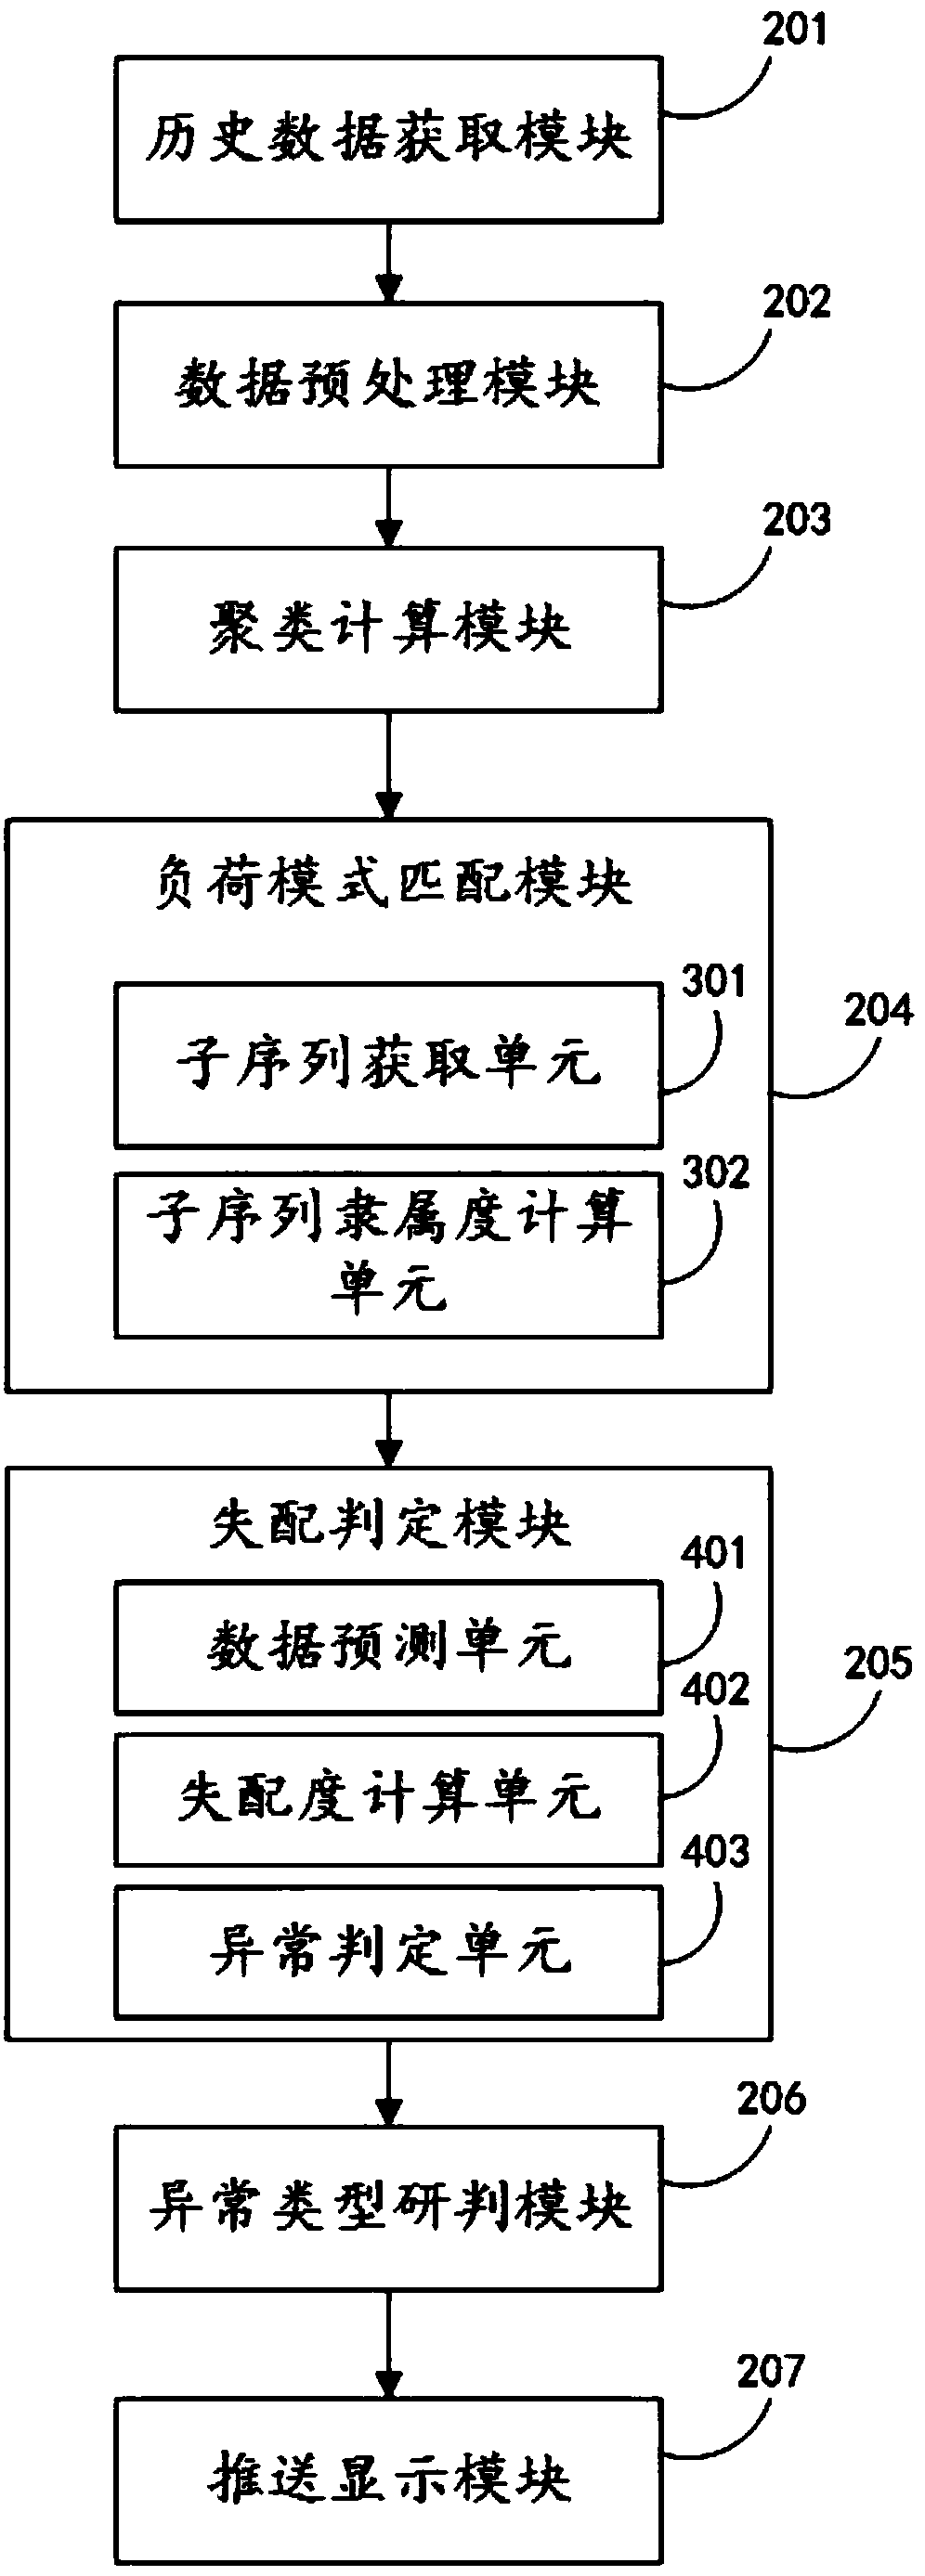
The invention provides a historical data analysis-based abnormality monitoring method and system of a power distribution network. The method comprises the steps of acquiring historical current data ofa 10KV main line where a power distribution line is located, standardizing the historical current data by taking circuit current limit number as a reference, clustering the historical current data according to a circuit load mode, performing load mode matching on current load data, calculating mismatching degree, judging whether a mismatching degree judgment circuit is abnormal or not, and further determining, pushing and displaying a circuit abnormality type. The method is high in data accuracy and high in reliability and is easy to read and process, so that the constraint that existing power distribution network equipment cannot be used for supporting fault monitoring is got rid of; and moreover, the method is small in data volume, fast in calculation speed and low in calculation equipment requirement, and is easy to promote and implement, existing equipment and data of a power supply enterprise can be fully compatible, and the construction cost is low.

Description

technical field [0001] The invention relates to the field of distribution automation, in particular to a distribution network abnormality monitoring method based on historical data analysis. Background technique [0002] Distribution Automation System (DAS) is an automation system that enables power supply companies to monitor, coordinate and operate power distribution equipment in real time in a remote location. and service quality. Due to the variety and quantity of power distribution equipment connected to the system, and the different levels of economic development in various regions, the following problems generally exist in power distribution automation systems: [0003] 1. There are still a considerable number of non-automated distribution equipment in the distribution network that do not have the conditions for transformation, and their distribution information cannot be connected to the automation system, resulting in a large number of branch lines that cannot be m...

Claims


Application Information

Patent Timeline
IPC IPC(8): H02H7/26H02J13/00
CPCY02E60/00Y04S10/20
Inventor 林祺蓉施冬明王俏俏贾玉健尹茂林臧宏伟尚力刘勇王悦孙雯霍健刘红霞杨福
Owner STATE GRID SHANDONG ELECTRIC POWER
Learn More