Gold ion probe and its preparation method and application
A technology of gold ions and probes, which is applied in the field of gold ion probes and its preparation and application, can solve the problems of difficult operation, long analysis time, expensive instruments, etc., and achieve good selectivity and specificity, and large pH changes The scope and the effect of simple and easy preparation process
- Summary
- Abstract
- Description
- Claims
- Application Information
AI Technical Summary
Problems solved by technology
Method used
Image
Examples
Embodiment 1
[0024] Embodiment 1 prepares gold ion fluorescent probe
[0025] Dissolve 200mg of 4,5-fluorescein bisaldehyde in 40ml of ethanol solution, and slowly add 5ml of methanol solution containing 112mg of hydrazinopyridine dropwise within 30min; under the protection of nitrogen, react at room temperature for 12 hours; after the reaction, The reaction product was precipitated out, filtered, and the obtained solid was dried in a vacuum oven to obtain a crude product; washed with n-pentane to obtain 170 mg of a light pink solid, which was the pure gold ion fluorescent probe ( 1 H-NMR chart and high-resolution mass spectrogram see Image 6 , Figure 7 ). The measured molecular weight of the obtained pure fluorescent probe is 570.
[0026] Present embodiment process route:
[0027]
Embodiment 2
[0028] Embodiment 2 makes the spectral properties of gold ion fluorescent probe reacting with various ions
[0029] Weigh 5.7 mg of the gold ion fluorescent probe prepared in Example 1, and prepare 10 mL of DMSO solution with a concentration of 1 mM as the mother solution.
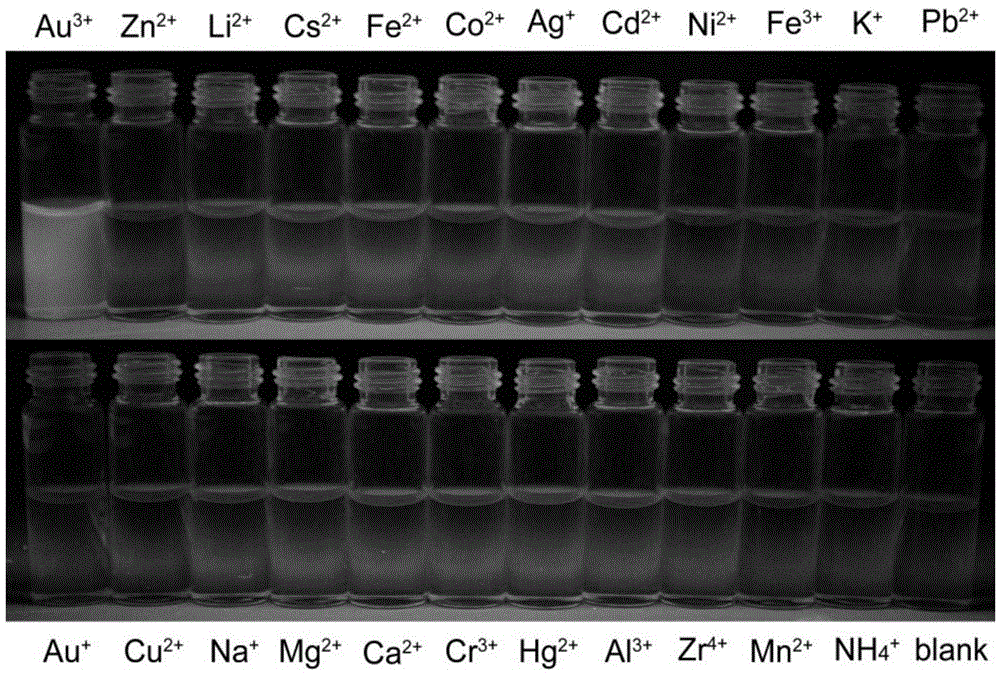
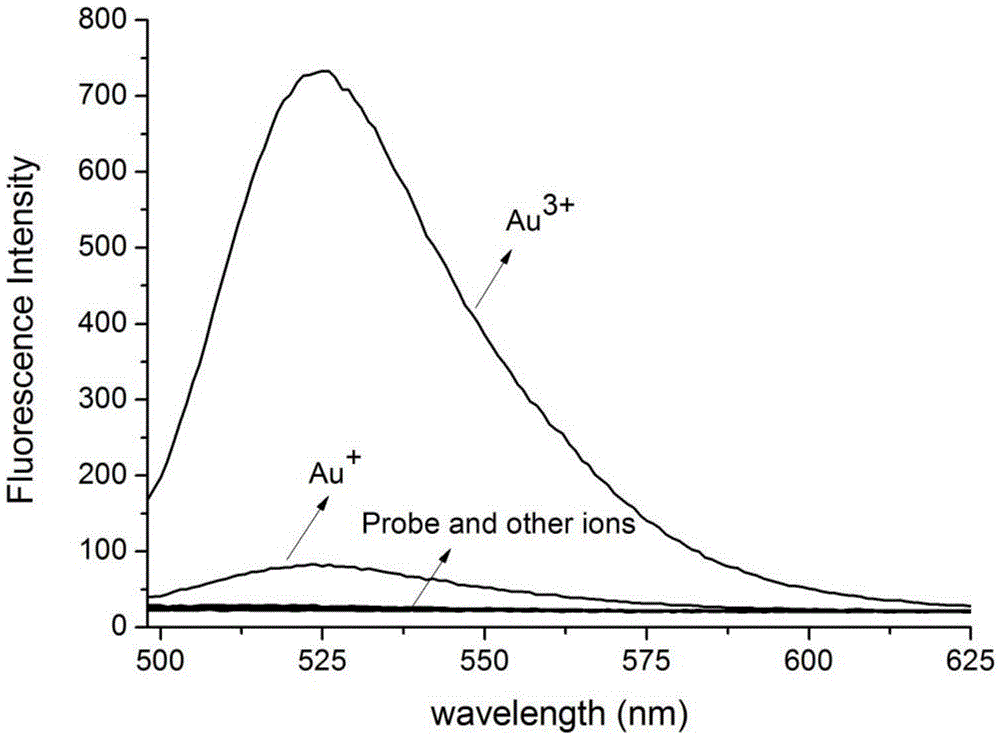
[0030] Fluorescence spectrum test: Add 30μL of the above mother solution into a certain amount of 10mM HEPES buffer solution (pH7.4), and then add various ions: Zn 2+ , Li 2+ ,Cs 2+ , Fe 2+ ,Co 2+ , Ag + ,Cd 2+ , Ni 2+ , Fe 3+ , K + ,Pb 2+ ,Au + ,Cu 2+ , Na + ,Mg 2+ , Ca 2+ ,Cr 3+ ,Hg 2+ ,Al 3+ ,Zr 4+ ,Mn 2+ ,NH 4 + The final concentration of ions was 100 μM, and the final concentration of fluorescent probe was 10 μM. The fluorescence emission spectrum was tested immediately under the excitation light wavelength of 493nm. The slit width for excitation and emission is 1.5 / 3.0nm. The result is as figure 1 shown. The solution prepared above was irradiated with a 365nm ultraviolet lam...
Embodiment 3
[0034] Embodiment 3 makes the spectroscopic property of gold ion fluorescent probe and gold ion reaction product
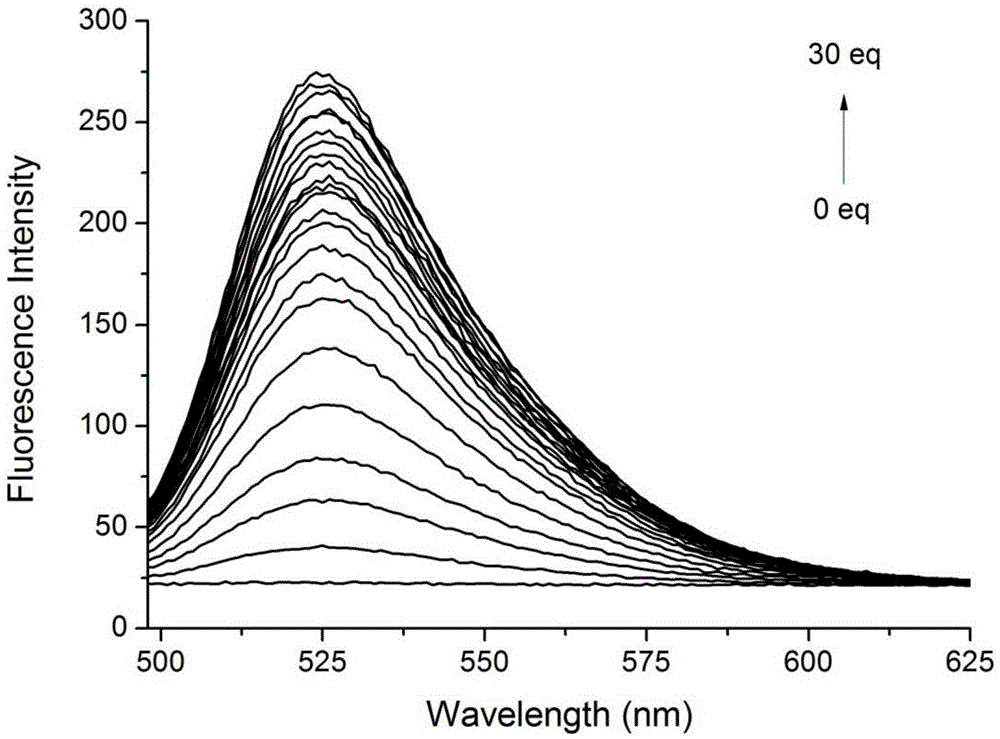
[0035] Add 30 μL of the mother liquor in Example 2 to a certain amount of 10 mM HEPES buffer solution (pH 7.4), and then add different equivalents of gold ions so that the final concentration of the fluorescent probe is 10 μM, and the final concentrations of gold ions are 0 μM and 10 μM respectively , 20 μM, 30 μM, 40 μM, 50 μM, 60 μM, 70 μM, 80 μM, 90 μM, 100 μM, 110 μM, 120 μM, 130 μM, 140 μM, 150 μM, 160 μM, 170 μM, 180 μM, 190 μM, 200 μM, 250 μM, 300 μM. Immediately after the addition of ions, their fluorescence emission spectra were measured. The fluorescence emission spectrum is excited at 493nm; the slit width of excitation and emission is 1.5 / 1.5nm. The resulting fluorescence increment graph is shown in image 3; Make a working curve with the fluorescence intensity data at 523nm, the results are shown in Figure 4 .
[0036] The experimental results sh...
PUM
 Abstract
Description
Claims
Application Information
 - Generate Ideas
- Intellectual Property
- Life Sciences
- Materials
- Tech Scout
- Unparalleled Data Quality
- Higher Quality Content
- 60% Fewer Hallucinations
Browse by: Latest US Patents, China's latest patents, Technical Efficacy Thesaurus, Application Domain, Technology Topic, Popular Technical Reports.
© 2025 PatSnap. All rights reserved.Legal|Privacy policy|Modern Slavery Act Transparency Statement|Sitemap|About US| Contact US: help@patsnap.com


