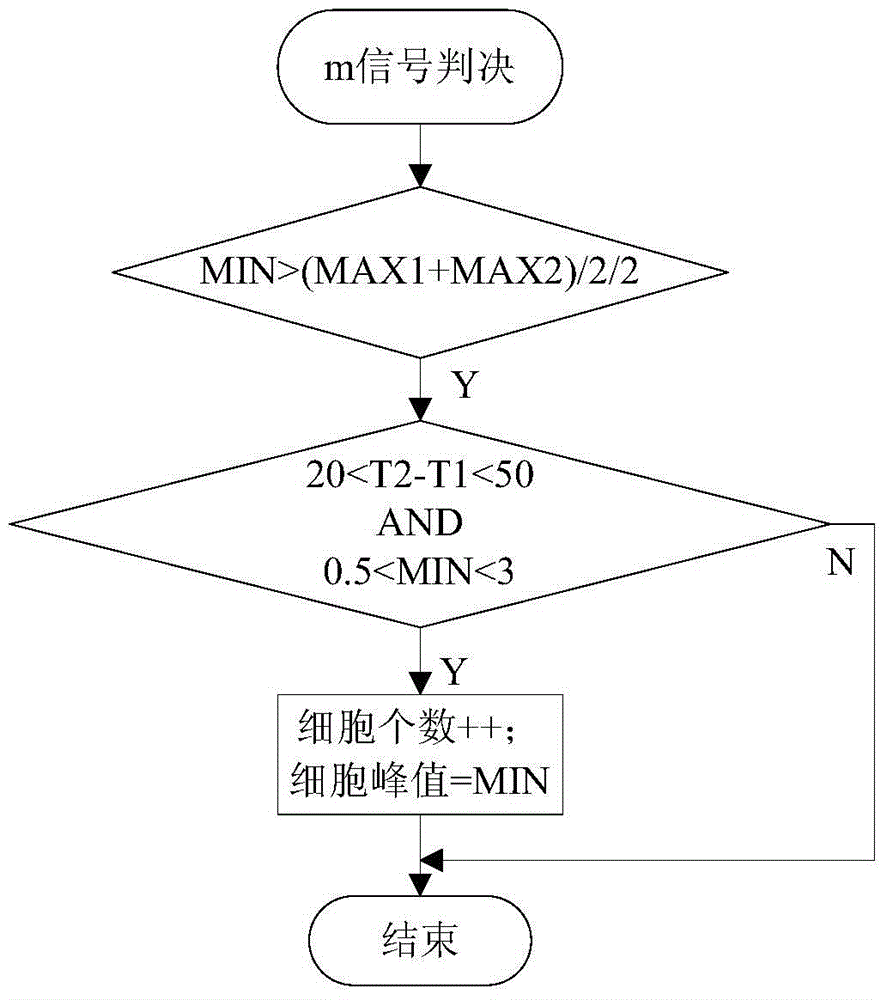
Method for detecting and counting blood cell pulse signals based on DSP Builder
A technology of pulse signal and statistical method, applied in the field of blood cell pulse signal detection and statistics, can solve the problems of statistical error of cell number, inaccurate pulse amplitude value, inability to provide diagnostic reference, etc., and achieves high accuracy, high reliability of recognition accuracy, The effect of shortening the development cycle
- Summary
- Abstract
- Description
- Claims
- Application Information
AI Technical Summary
Problems solved by technology
Method used
Image
Examples
Embodiment 1
[0039] Embodiment 1: Step 1: Set S N is the sampling value at time N, S N-1 is the sampling value at time N-1, the signal start level C 1 =140mV, the differential lower limit value D=70mV / us in the rising stage at the starting point of the signal;
[0040] signal when S N >C 1 and (S N -S N-1 ) / 1us>D, then point N is the starting point of the signal;
[0041] Step two:
[0042] State A: When the differential value has a maximum value, record the time coordinate as T1=10;
[0043] State B: When the differential value becomes zero or changes from positive to negative, the first peak value of the signal appears, and the recorded value is MAX1=2.8;
[0044] C state: When the differential value becomes zero again or changes from negative to positive, the valley value of the signal appears, and the recorded value is MIN=1.2;
[0045] D state; when the differential value becomes zero for the third time or changes from positive to negative, the second peak value of the signal...
Embodiment 2
[0050] Embodiment 2: Step 1: Set S N is the sampling value at time N, S N-1 is the sampling value at time N-1, the signal start level C 1 =140mV, the differential lower limit value D=70mV / us in the rising stage at the starting point of the signal;
[0051] signal when S N >C 1 and (S N -S N-1 ) / 1us>D, then point N is the starting point of the signal;
[0052] Step two:
[0053] State A: When the differential value has a maximum value, record the time coordinate as T1=15;
[0054] State B: When the differential value becomes zero or changes from positive to negative, the first peak value of the signal appears, and the recorded value is MAX1=2;
[0055] C state: When the differential value becomes zero again or changes from negative to positive, the valley value of the signal appears, and the recorded value is MIN=1.5;
[0056] D state; when the differential value becomes zero for the third time or changes from positive to negative, the second peak value of the signal a...
Embodiment 3
[0061] Embodiment 3: Step 1: Set S N is the sampling value at time N, S N-1 is the sampling value at time N-1, the signal start level C 1 =140mV, the differential lower limit value D=70mV / us in the rising stage at the starting point of the signal;
[0062] signal when S N >C 1 and (S N -S N-1 ) / 1us>D, then point N is the starting point of the signal;
[0063] Step two:
[0064] State A: When the differential value has a maximum value, record the time coordinate as T1=15;
[0065] State B: When the differential value becomes zero or changes from positive to negative, the first peak value of the signal appears, and the recorded value is MAX1=0.6;
[0066] C state: When the differential value becomes zero again or changes from negative to positive, the valley value of the signal appears, and the recorded value is MIN=0.2;
[0067] D state; when the differential value becomes zero for the third time or changes from positive to negative, the second peak value of the signal...
PUM
 Abstract
Description
Claims
Application Information
 - R&D
- Intellectual Property
- Life Sciences
- Materials
- Tech Scout
- Unparalleled Data Quality
- Higher Quality Content
- 60% Fewer Hallucinations
Browse by: Latest US Patents, China's latest patents, Technical Efficacy Thesaurus, Application Domain, Technology Topic, Popular Technical Reports.
© 2025 PatSnap. All rights reserved.Legal|Privacy policy|Modern Slavery Act Transparency Statement|Sitemap|About US| Contact US: help@patsnap.com


