Real-time fluorescence PCR detection method of Ceratocystis fagacearum (Bretz) Hunt
A real-time fluorescence and detection method technology, applied in the biological field, can solve problems such as unreported, and achieve the effects of strong reliability, shortened quarantine period, and high sensitivity
- Summary
- Abstract
- Description
- Claims
- Application Information
AI Technical Summary
Problems solved by technology
Method used
Image
Examples
Embodiment 1
[0026] Example 1 Specific detection of Real-time PCR primers of Fusarium oxysporum
[0027] 1. Extract the DNA of the known samples of Fusarium wilt and the hypha DNA of the control strain in Table 1
[0028] 1.1 Strain culture and mycelium collection
[0029] The strain was attached to the PDA medium and cultured in the dark at 20-25°C for 10 days. The hyphae were gently scraped off with an inoculating needle, placed in a centrifuge tube, freeze-dried, and stored at -20°C for later use.
[0030] 1.2 Use the improved CTAB method to extract mycelial DNA, the specific operation is as follows:
[0031] 1) Take 0.5g of frozen mycelium and place it in a 2.0ml flat-bottomed centrifuge tube, add 2 steel balls with a diameter of 3mm, close the tube cap, place it on the Oscillating Mill MM400, and grind for 3 minutes at 30f / min;
[0032] 2) Take out the steel ball, add 500μl CTAB, freeze in liquid nitrogen for 2 minutes, then 75°C water bath for 2 minutes, repeat twice, and finally melt in 75°C w...
Embodiment 2
[0050] Example 2 Real-time PCR sensitivity test
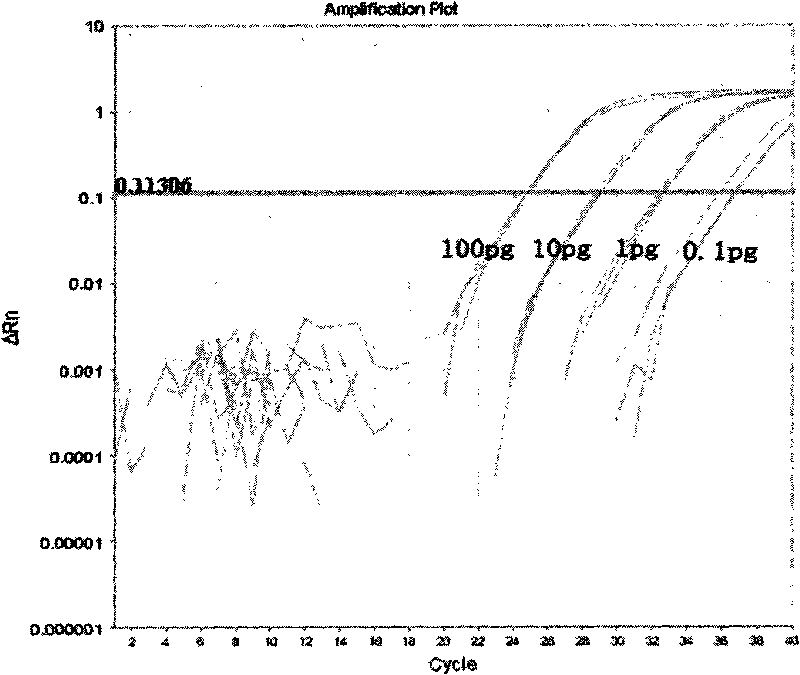
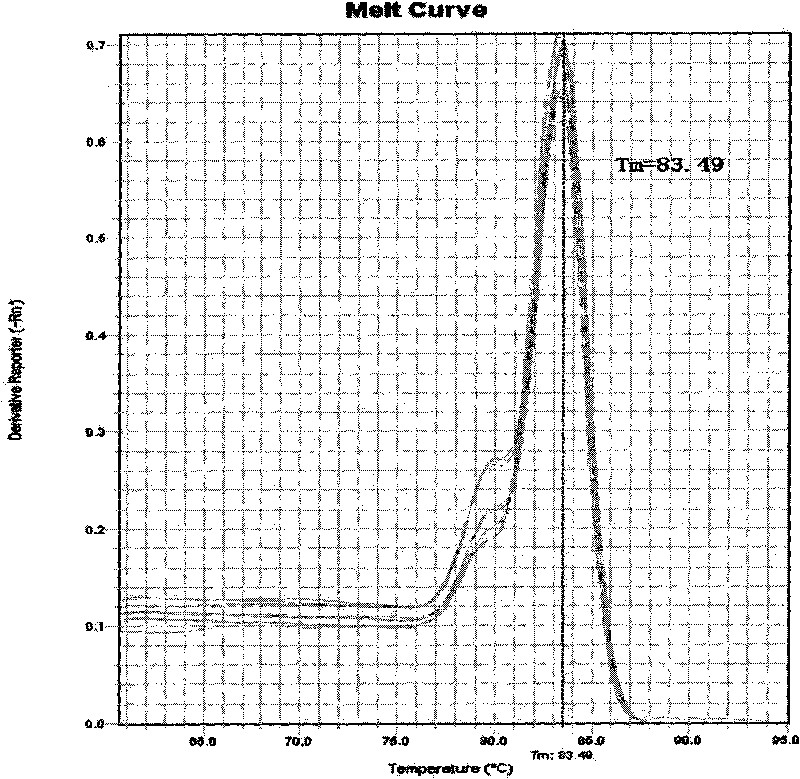
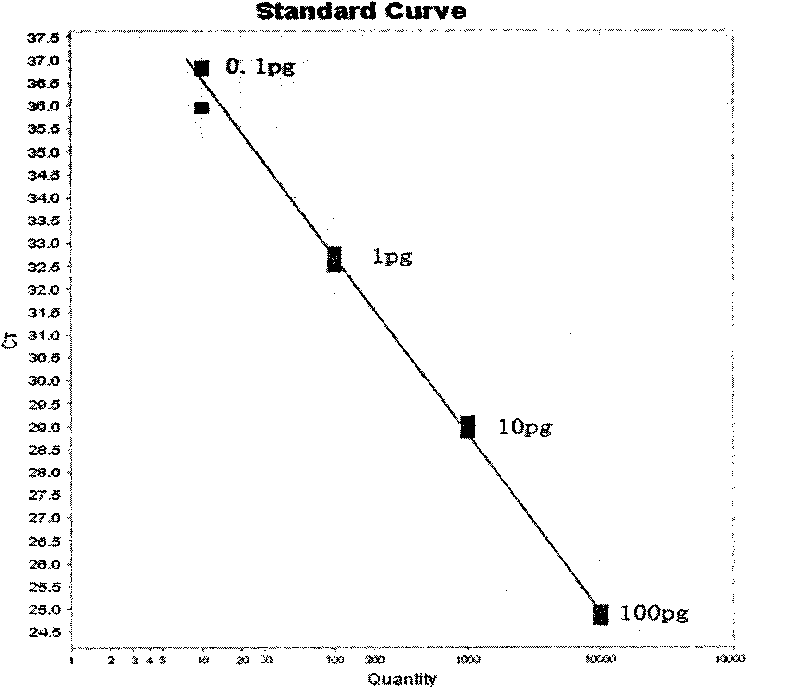
[0051] The DNA of the extracted strain Ceratocystis fagacearum ATCC 200423 was measured on a spectrophotometer and then diluted to 1×10 in a 10-fold gradient. 2 pg / μl, 10pg / μl, 1pg / μl, 1×10 -1 pg / μl, 1×10 -2 pg / μl standard gradient solution, take 1μl as the template, and perform amplification on the ABI 7500Fast fluorescent quantitative PCR instrument according to the conditions of step 2 in Example 1. The results show that figure 1 In the amplification curve, 4 "S" amplification curves can be seen, that is, 4 concentrations of DNA have been amplified, so the lowest detectable DNA concentration of pathogens is 0.1 pg / μl. in figure 2 In the middle, the melting curve Tm=83.5±0.5°C, when it is used to test samples in the future, the possibility of false positives can be ruled out based on this Tm value. In addition, see image 3 , The linear relationship of the standard curve, r 2 =0.997 is very close to 1, which shows that the 10-f...
Embodiment 3
[0052] Example 3 Using Real-time PCR to detect the number of pathogenic spores in soil
[0053] 1.1 Test of spores carrying pathogens in simulated soil
[0054] Add 1×10 to 0.3g sterilized soil 5 Pcs, 1×10 4 Pcs, 1×10 3 Pcs, 1×10 2 A spore suspension of Ceratocystis fagacearum ATCC 200423 with a total of 6 gradients of 1, 10, 1
[0055] 1.2 Extract DNA from soil samples with bacteria
[0056] 1) Take 0.3 g of soil, dry it, and grind it with a grinder;
[0057] 2) Add the ground fine powder into a 2.0ml centrifuge tube, add 500μl of 0.4% (mass / volume) skimmed milk powder solution, vortex and mix well, centrifuge at 12000rpm for 15 minutes;
[0058] 3) Take the supernatant, add an equal volume of proteinase K buffer (50mM Tris-HCl PH=8., 2.5mM EDTAPH=8.0, 1% SDS and 10μg / ml proteinase K), and bathe in water at 55°C for 1-3 hours;
[0059] 4) Add 1 / 2 of the total volume of 7.5M NH 4 AC solution, mix upside down, centrifuge at 12000rpm for 15 minutes;
[0060] 5) Aspirate the supernatant and a...
PUM
 Abstract
Description
Claims
Application Information
 - Generate Ideas
- Intellectual Property
- Life Sciences
- Materials
- Tech Scout
- Unparalleled Data Quality
- Higher Quality Content
- 60% Fewer Hallucinations
Browse by: Latest US Patents, China's latest patents, Technical Efficacy Thesaurus, Application Domain, Technology Topic, Popular Technical Reports.
© 2025 PatSnap. All rights reserved.Legal|Privacy policy|Modern Slavery Act Transparency Statement|Sitemap|About US| Contact US: help@patsnap.com


