
Traffic based availability analysis

a traffic-based availability and analysis technology, applied in the field of telecommunications systems, can solve the problems of inability to predict system availability, inability to accurately assess the impact of network failures, and inability to accurately predict system availability, etc., to achieve the effect of reducing the burden, reducing the impact of failures on service interruptions, and accurate assessment of network impa

Active Publication Date: 2010-11-09
AVAYA INC
View PDF44 Cites 15 Cited by
  • Summary
  • Abstract
  • Description
  • Claims
  • Application Information

AI Technical Summary

Benefits of technology

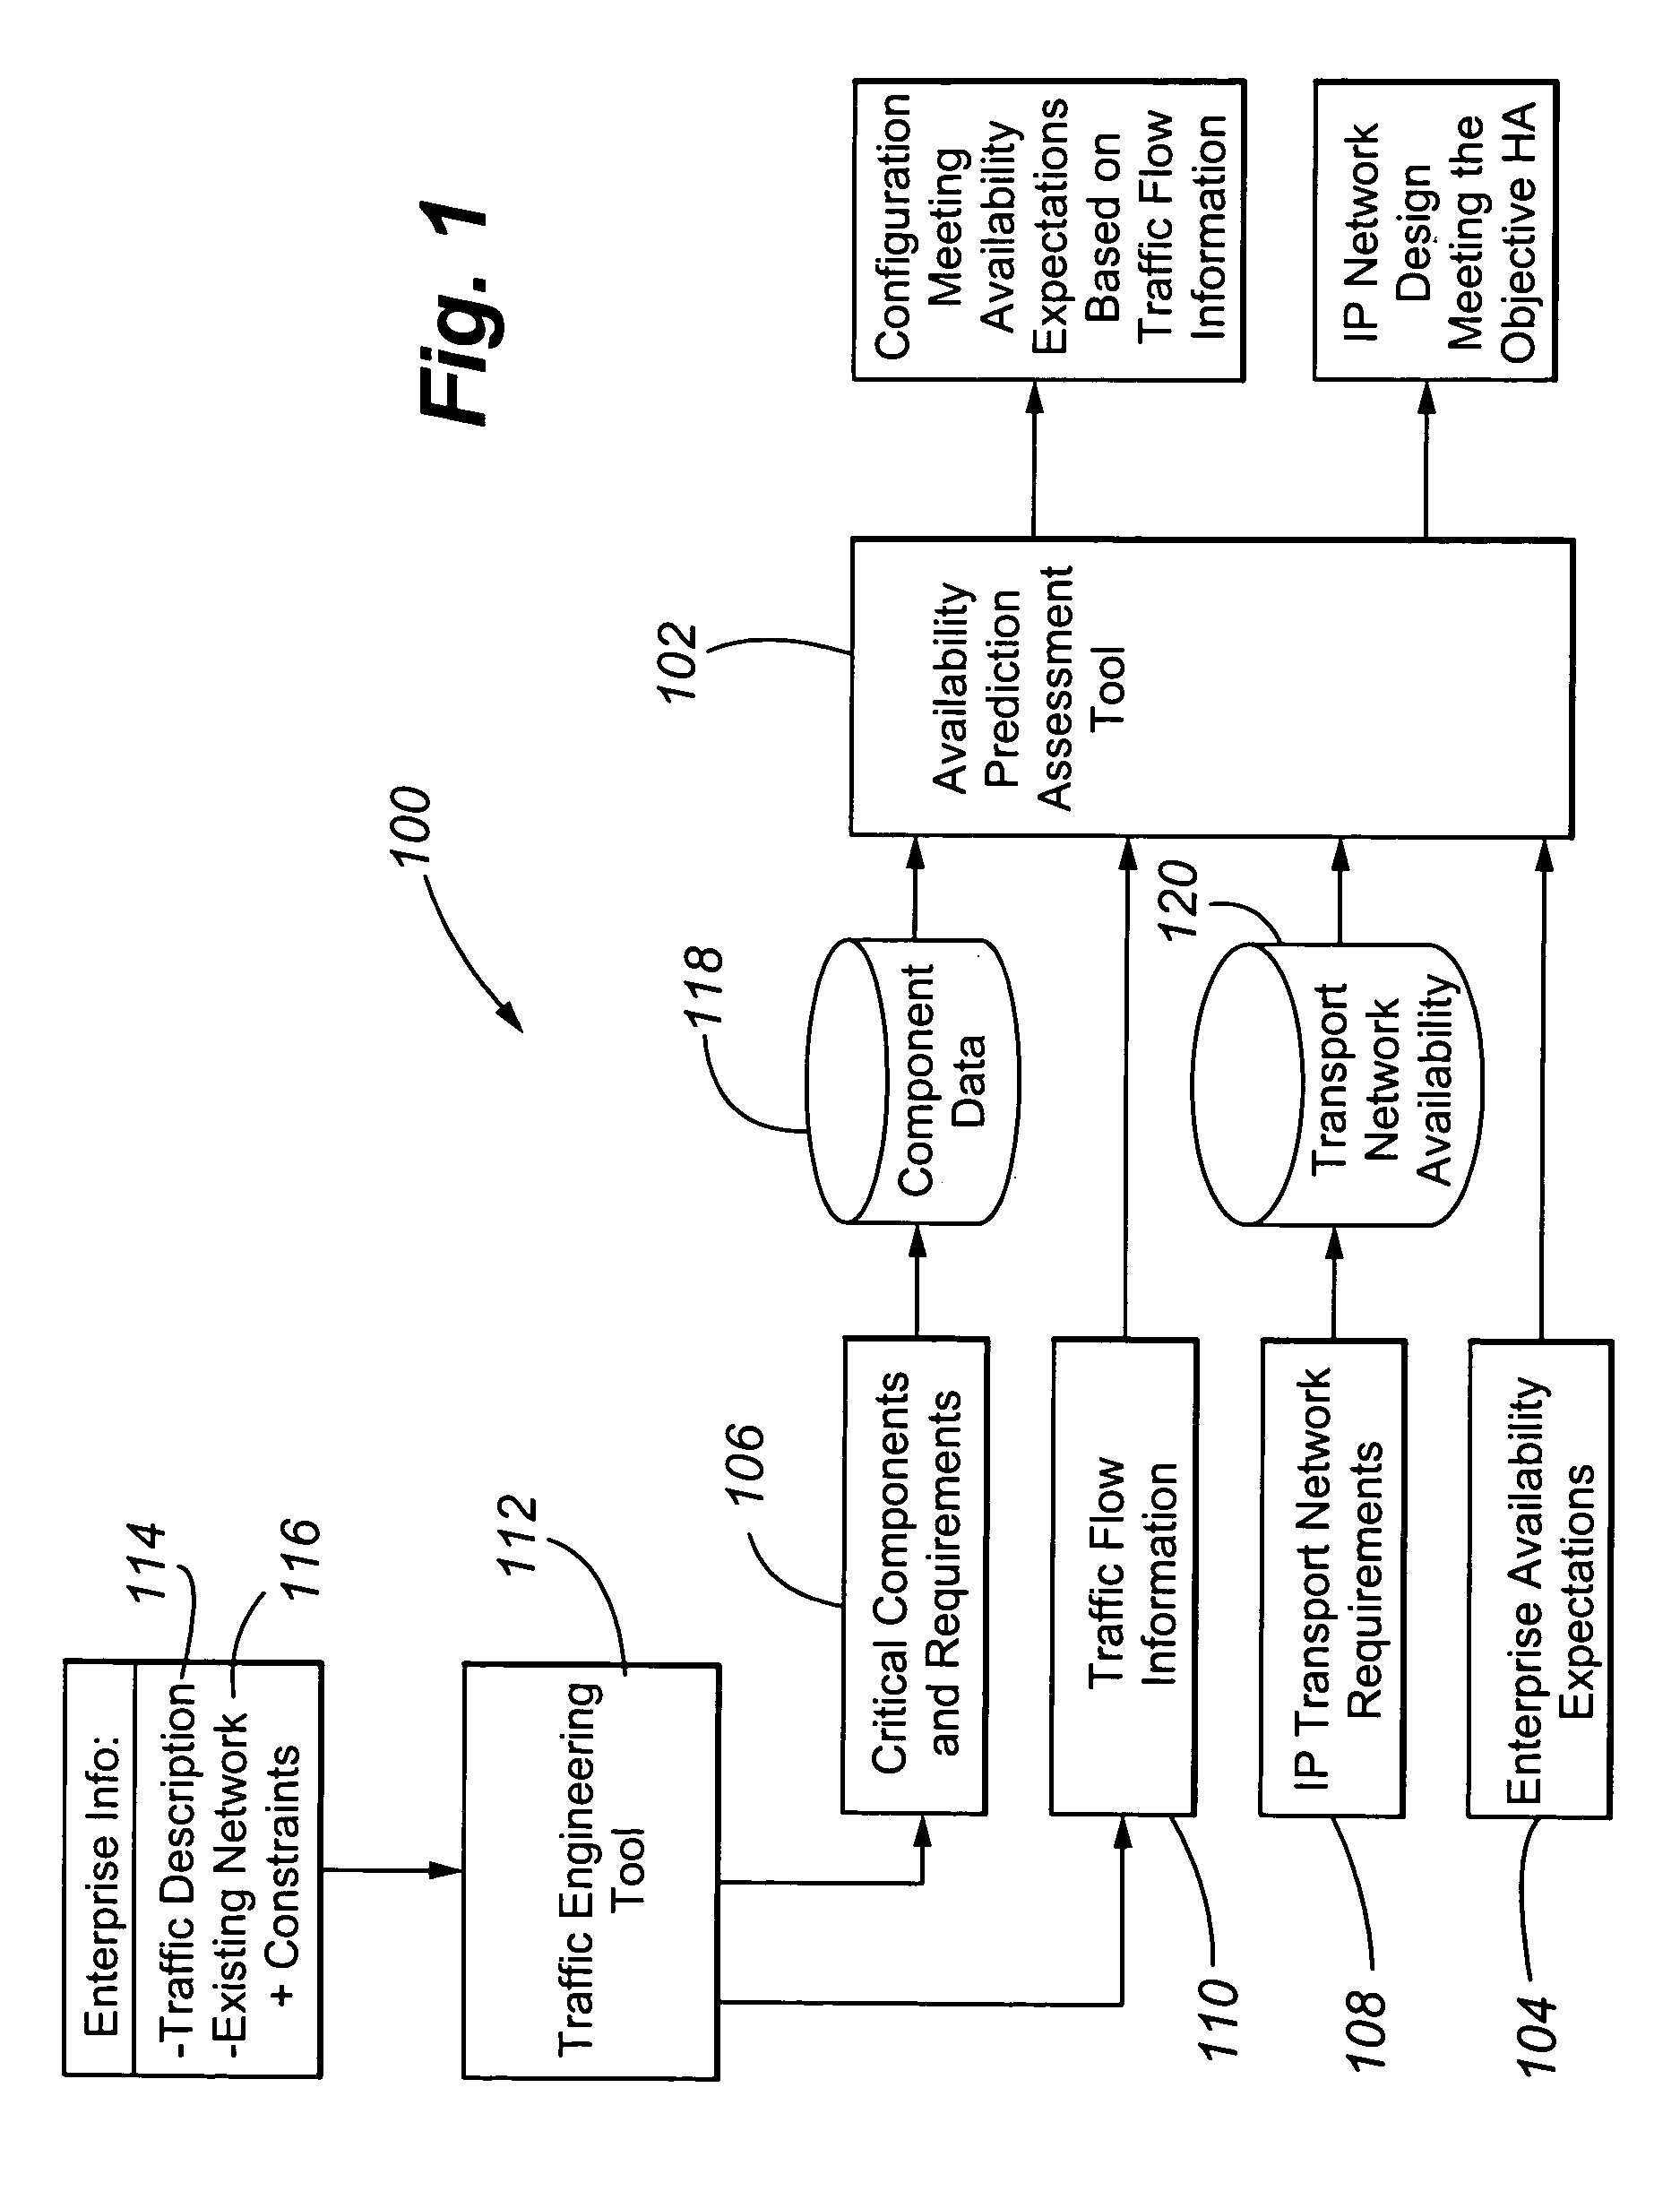
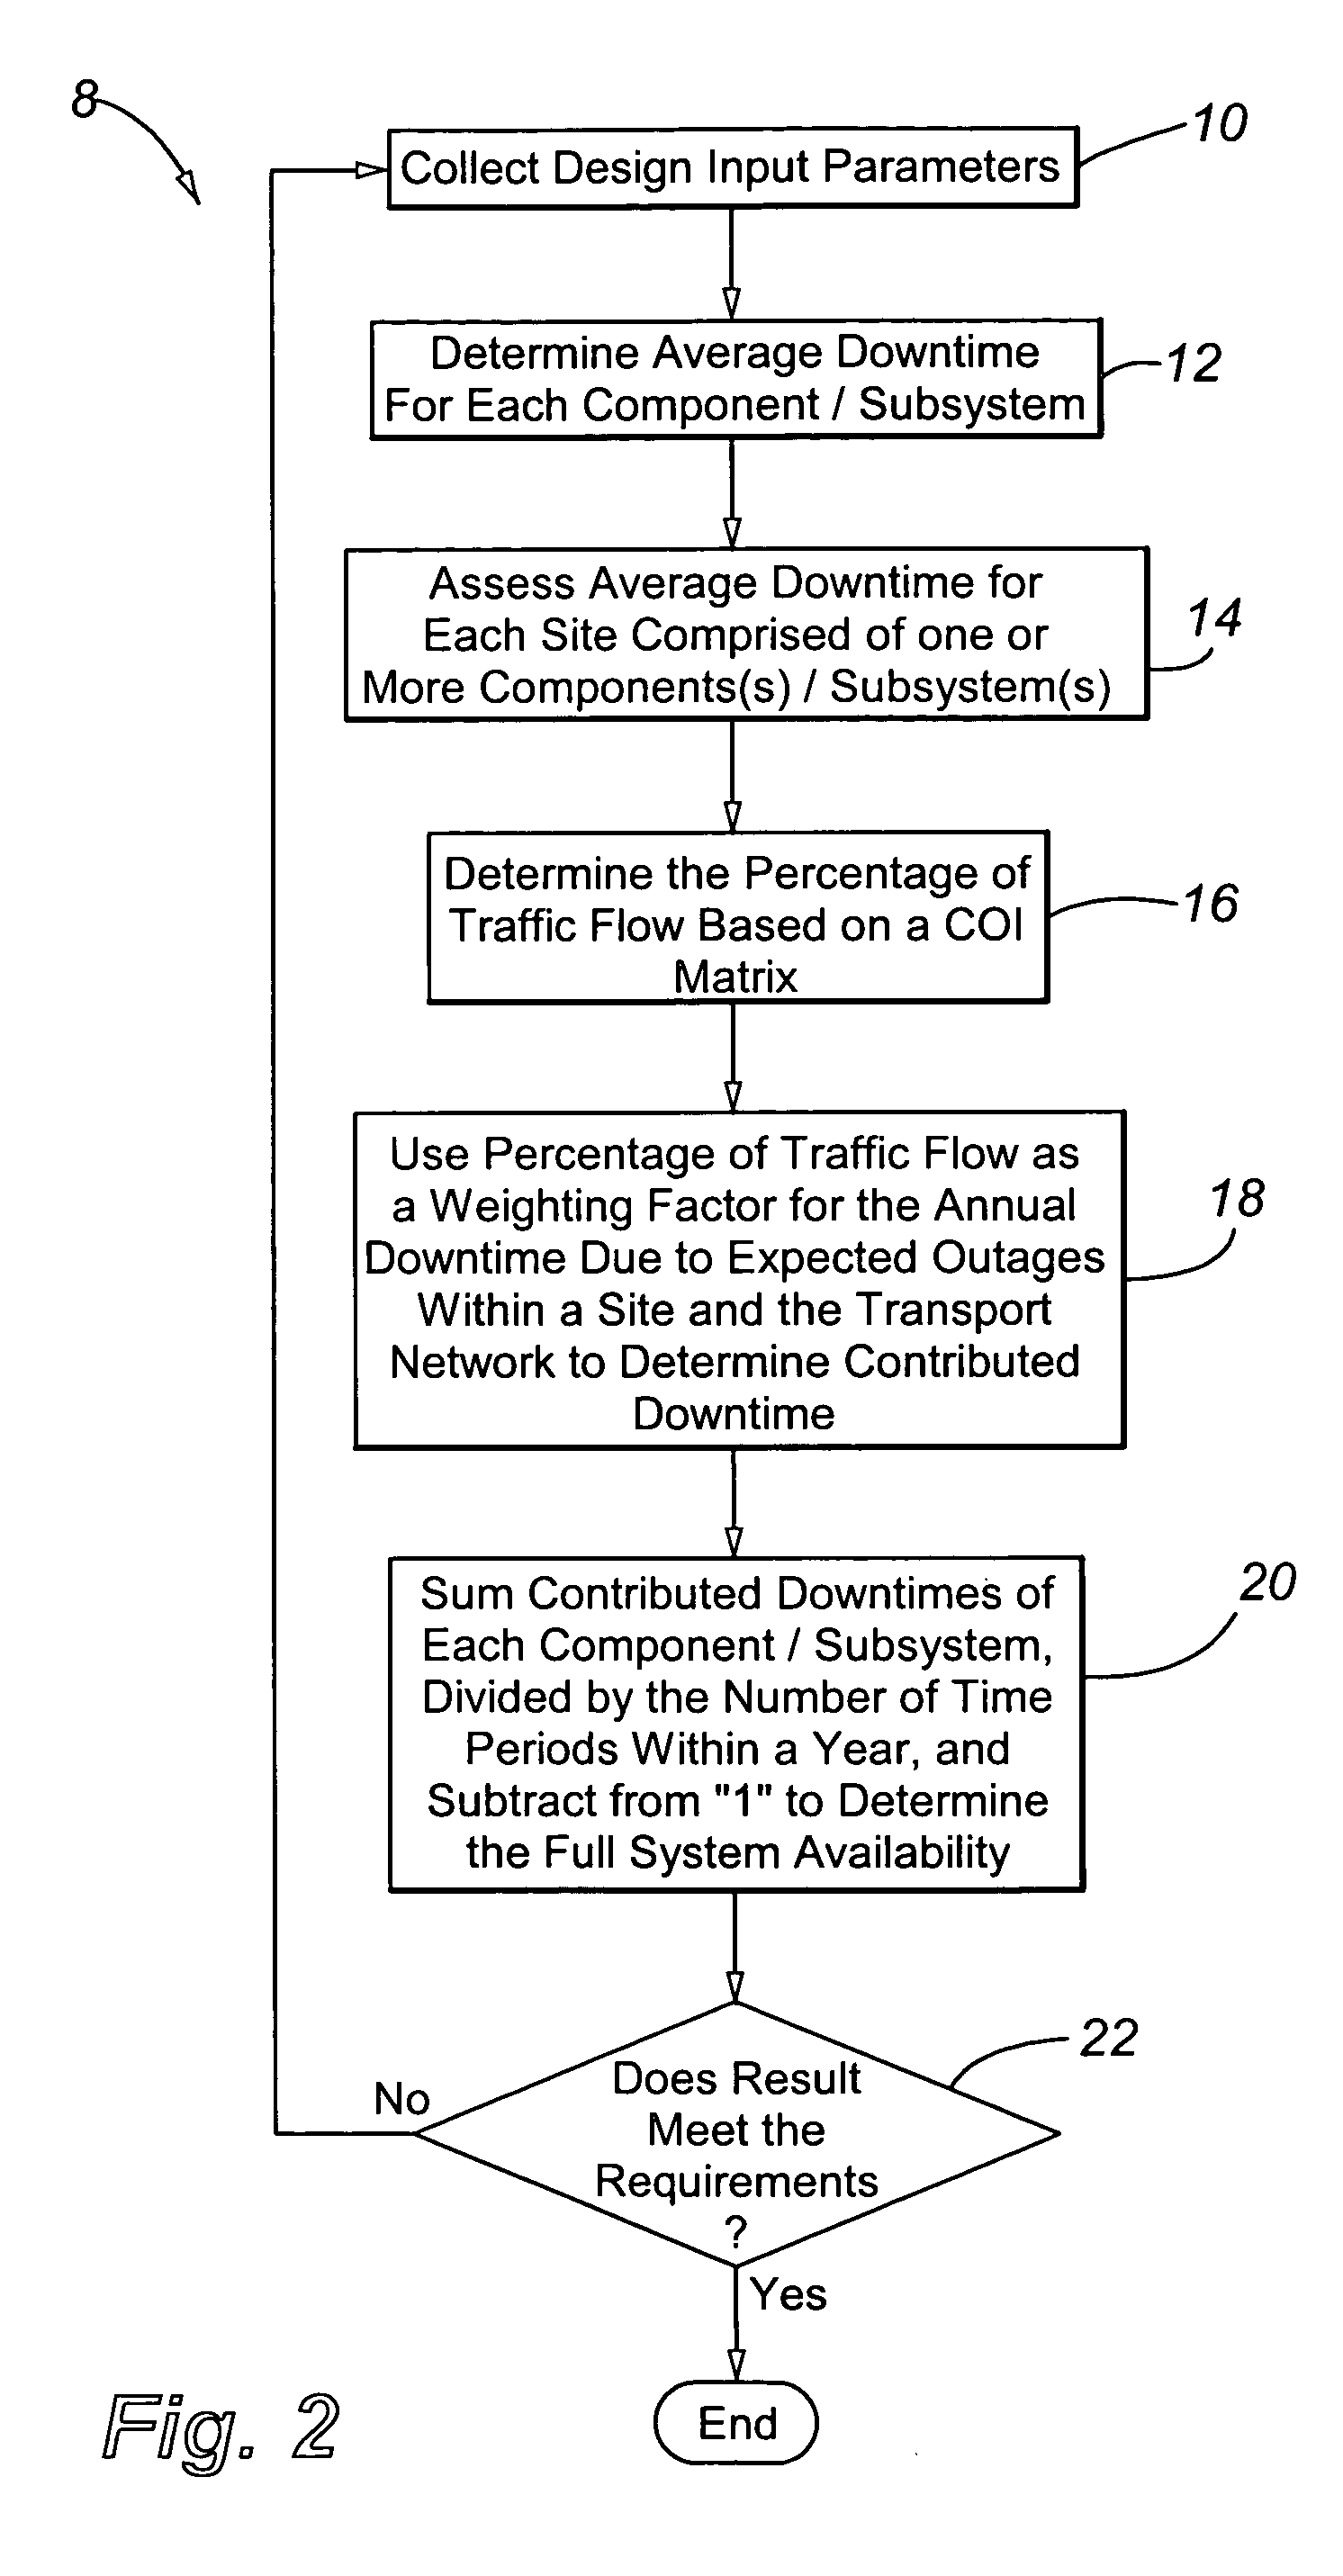
The present invention is a system and method for predicting downtime and availability of a communications network, particularly a telecommunications system. The invention takes into account traffic flow or volume in analyzing the availability of the network. By using a set of network components and their associated traffic flows, the invention can predict the impact of failures or other events on service interruption and help design a redundant configuration to minimize downtime. The invention can also consider the impact of traffic volume and other factors such as Mean Time Between Outages / Failure and Mean Time to Recover / Restore to optimize system redundancy. The invention can be used in simple and complex geographically distributed networks and can help design a customized, minimum-required redundancy configuration.

Problems solved by technology

Indeed, in many call center environments, the potential cost of downtime is often greater than the implied benefits of migrating to IP Telephony.
In this model, the data required for predicting system availability is limited to unplanned outage frequency and downtime experienced by service interruption.
A failure that causes service interruption contributes to the Outage Downtime of that service.
In such a network, the assumption of an equal distribution of traffic fails to accurately represent the actual distribution of traffic on the system and thus fails to accurately assess the system availability.

Method used


Image

  • Traffic based availability analysis
  • Traffic based availability analysis
  • Traffic based availability analysis

Examples


example 1

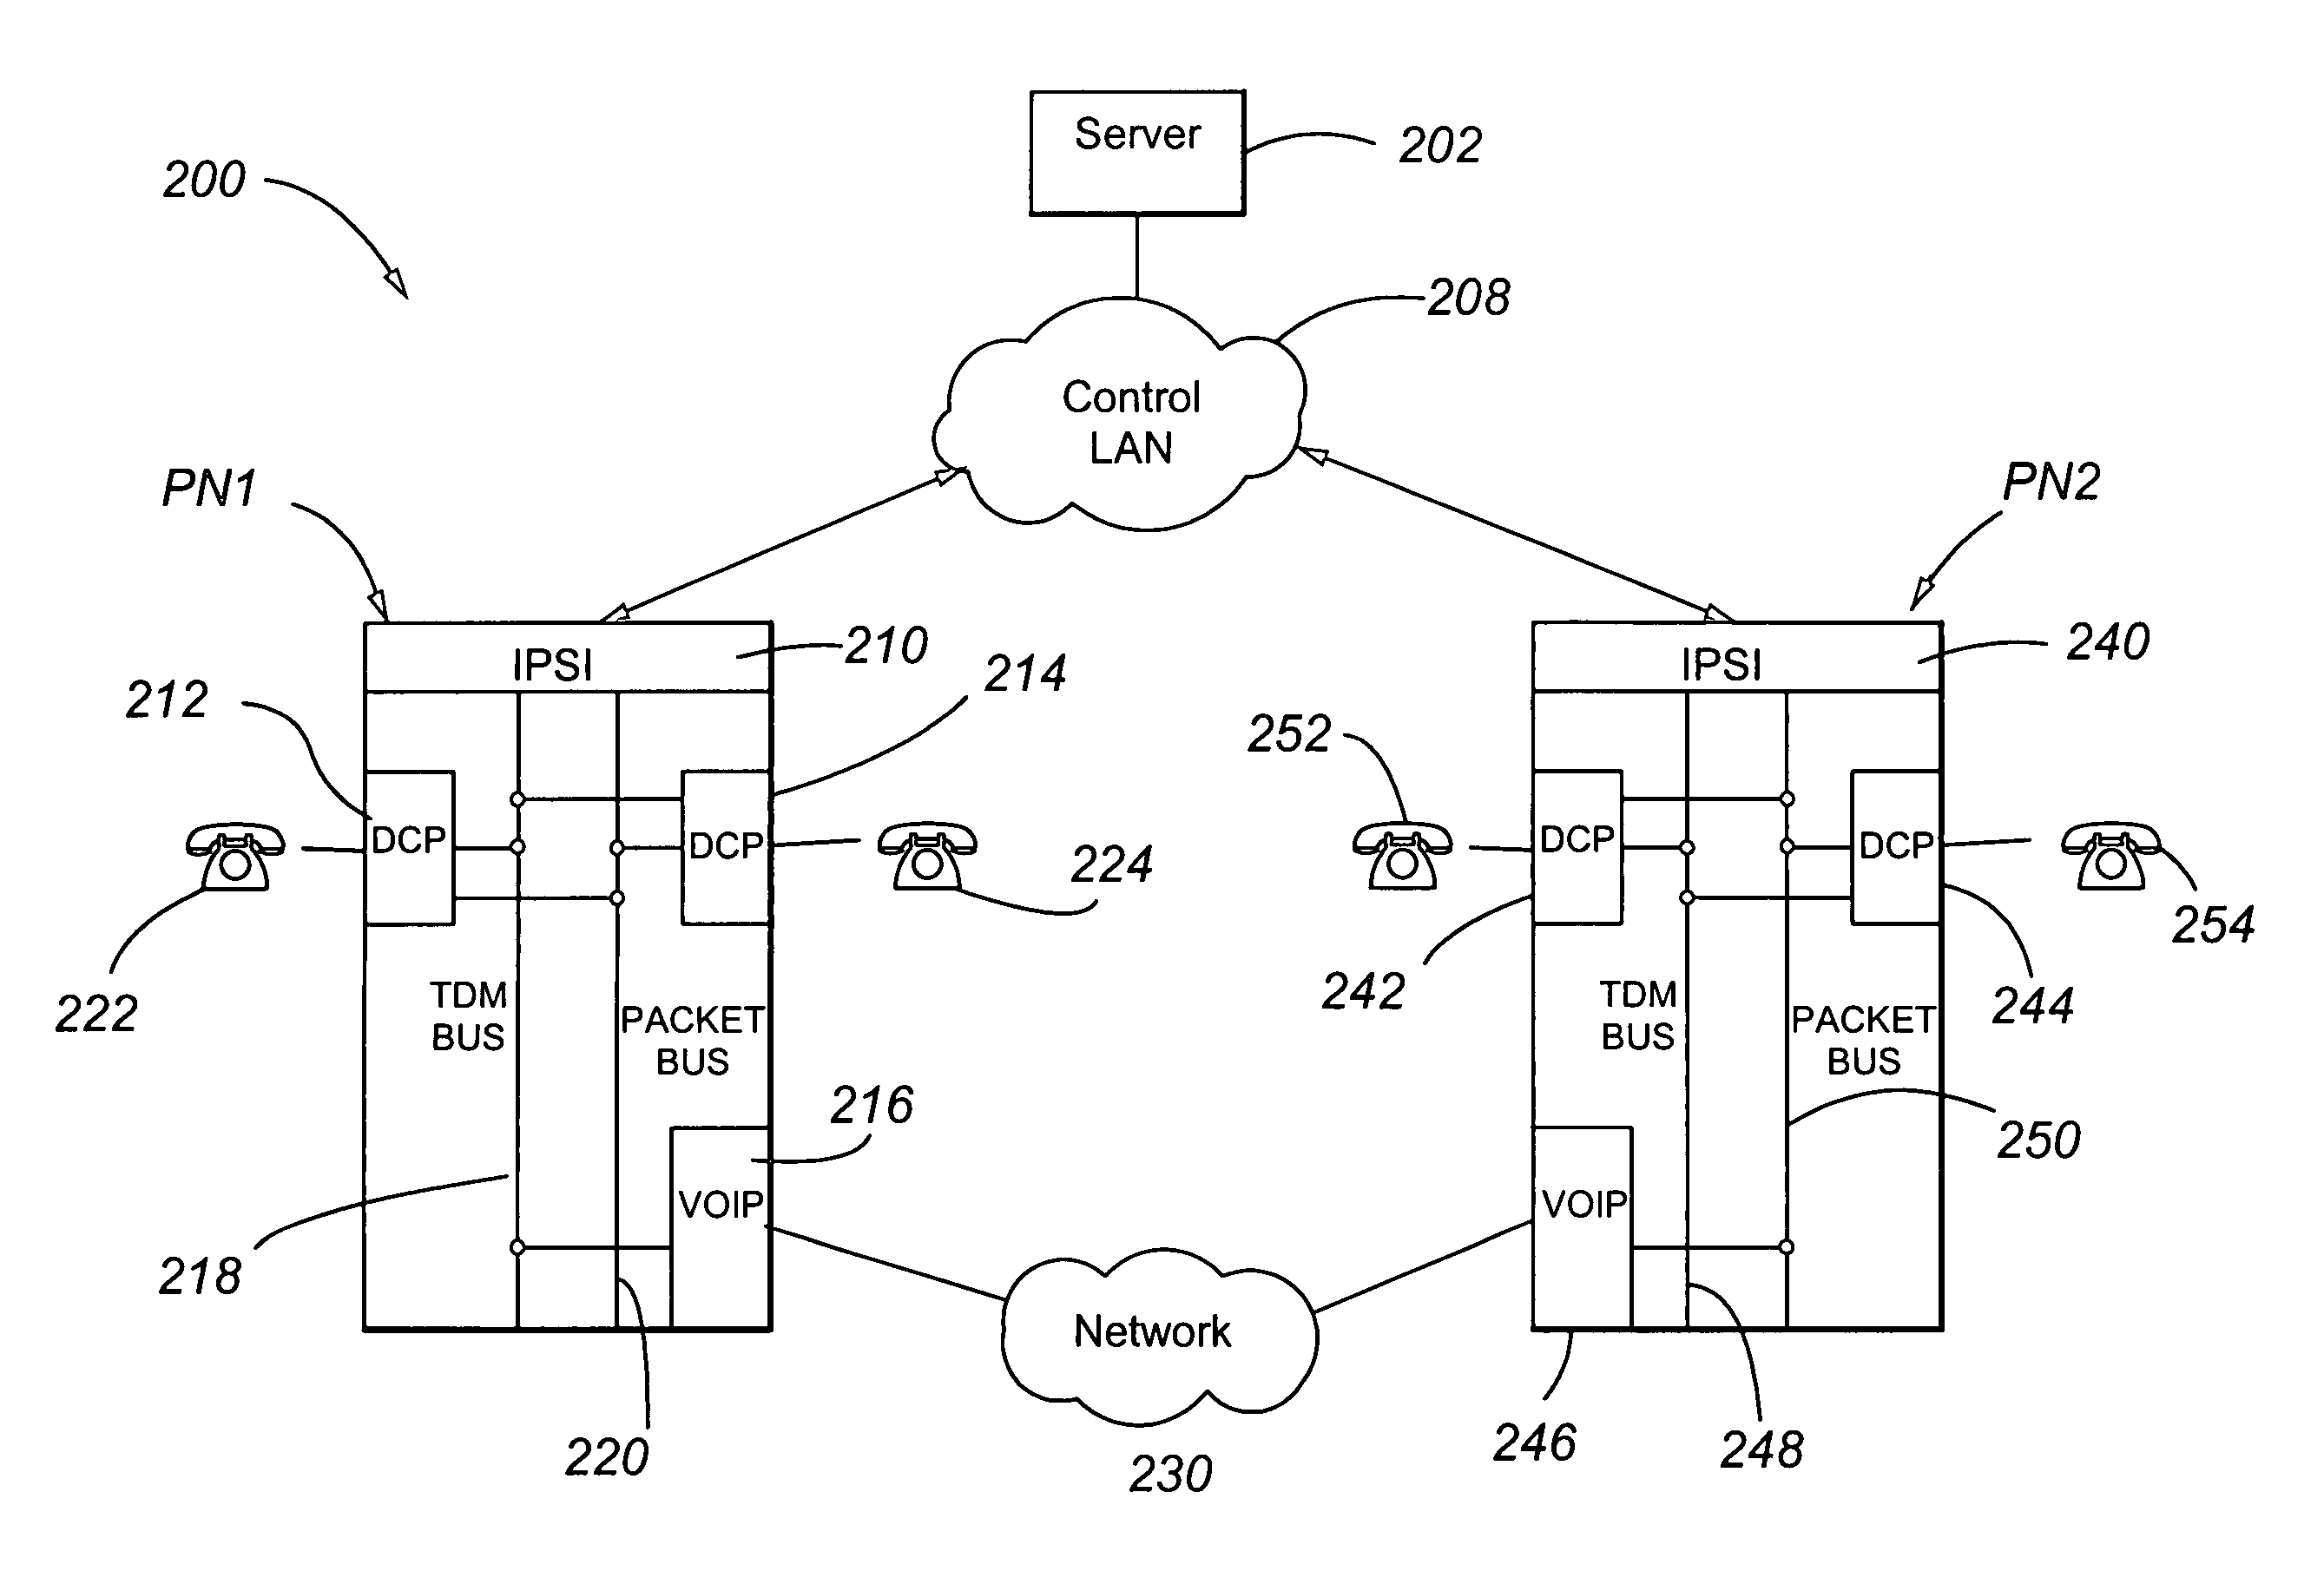
[0071]FIG. 5 shows a first example of a telecommunications system 200 for which the availability may be predicted according to the present invention. In this example, the telecommunications system 200 comprises a server 202. The server 202 controls two port networks PN1 and PN2 through a Control Local Area Network (Control LAN) 208 and, in the example shown, includes an Avaya S8500_ Media Server, although other telecommunications servers may be used. The Control LAN 208 is connected to a first port network PN1 and a second port network PN2. In this example, the first and second port networks PN1 and PN2 each comprise an Avaya G650_ Port Network, and the traffic flow comprises (Digital Control Processor) DCP-DCP station-to-station traffic only. The first port network PN1 includes 240 DCP stations, and the second port network PN2 includes 480 DCP stations.

[0072]At the first site, a first port network PN1 includes an IP Server Interface (IPSI) card 210, a first DCP card 212, a second D...

example 2

[0093]FIG. 6 shows a first example of a geographically distributed network 300. As shown in FIG. 6, an Avaya S8700_ IP-Connect System has a pair of S8700 media servers 302 and 304, and a pair of port networks 306 and 308 (e.g., two Avaya G650 media gateways) connected by a LAN 310 located in a headquarters site 320 in Atlanta. The LAN 310 is further connected to a WAN router 312 connected to a WAN 314. The port networks 306 and 308 are connected to a public switching telephone network (PSTN) 316 and are further connected to one or more communities of local telephone(s) 318 located within the Atlanta headquarters site 320. In addition, one or more communities of local telephone(s) 322 are connected to the LAN 310. A branch office site 330 in Boston also includes a LAN 332 that is connected to the WAN 314 via a WAN router 334. The Boston site 330 further includes a port network 336 (e.g., an Avaya G650 media gateway) connected to the LAN 332 and one or more communities of local teleph...

case study i

[0096]In a first case study for the network 300 shown in FIG. 6, the call processing link from the S8700™ media servers 302 and 304 to the G650™ media gateways 306 and 308 in the Atlanta headquarters site 320 is supported by a single LAN connection 310. In addition, the call processing link from the servers to each of the branch offices is over a single WAN link 314. The quality of the Control LAN and media processor circuit packs or media modules are designed to support the calculated traffic load and have not been engineered with N+1 reliability.

[0097]The single WAN link is the weakest link in this configuration. Because WAN facilities are usually leased, and because of the cost-prohibitive nature of procuring WAN circuits, WAN availability has historically been in the range from 99% to 99.5%, although some service providers currently guarantee 99.9% availability per WAN circuit. The call control signaling traffic traverses the WAN link to give service to the phones in Boston and ...


PUM


Abstract

A system for analyzing an availability of at least part of a communications network is provided. The network includes a set of network components, that are further divided into first and second subsets of network components. Each of the first and second subsets includes a plurality of different components in the network component set. The system includes an availability prediction assessment tool that is operable to (I) determine a first traffic flow exchanged between first and second endpoint groupings in the first subset, the first traffic flow being a first percentage of a total traffic flow in the communications network; (ii) for a plurality of first subset members involved in the first traffic flow, determine a corresponding downtime; (iii) determine a total of the downtimes corresponding to the plurality of first subset members; (iv) multiply the total of the downtimes by the first percentage to provide a first traffic weighted total downtime for the first subset; and (v) determine an availability of the first subset for the first traffic flow based on the first traffic weighted total downtime for the first subset.

Description

CROSS REFERENCE TO RELATED APPLICATION[0001]This application claims the benefits under 35 U.S.C. §119 of U.S. Provisional Patent Application Ser. No. 60 / 615,352, filed on Sep. 30, 2004 entitled “TRAFFIC-BASED AVAILABILITY ANALYSIS”, which is incorporated by reference in its entirety herein.[0002]Cross reference is made to U.S. patent application Ser. No. 10 / 944,069, filed on Sep. 16, 2004 entitled “PROCEDURAL XML-BASED TELEPHONY TRAFFIC FLOW ANALYSIS AND CONFIGURATION TOOL”, which is incorporated in its entirety herein by reference.FIELD OF THE INVENTION[0003]The invention relates generally to telecommunications systems and particularly to traffic-based availability analysis of telecommunications systems.BACKGROUND OF THE INVENTION[0004]As enterprises accelerate their migration from traditional circuit switched telephony services to Internet Protocol (IP) Telephony solutions, a major consideration is their ongoing concern as to the potential reliability of the proposed IP voice serv...

Claims


Application Information

Patent Timeline
Patent Type & Authority Patents(United States)
IPC IPC(8): H04L12/26H04J1/16G06F11/00G01R31/08G08C15/00
CPCG01R31/08G06F11/00G08C15/00H04J1/16H04L12/26H04L41/5012H04L41/147G06F11/3447
Inventor LO, WING FAIMOMKEN, BAHAREH
Owner AVAYA INC
Learn More