Petroleum exploration and prediction apparatus and method

a technology of prediction apparatus and mineral deposits, applied in the field of signal processing, can solve the problems of difficult to generate accurate models of resource deposits, inconvenient use, and inability to accurately predict the location of mineral deposits, and achieve the effect of high classification accuracy

Inactive Publication Date: 2005-10-04
COOK DANIEL R +1
View PDF42 Cites 19 Cited by
  • Summary
  • Abstract
  • Description
  • Claims
  • Application Information

AI Technical Summary

Benefits of technology

[0015]A collection of data from epochs, where the physical system represented thereby is of a known state may be passed to a learning system. The learning system may use several waveform analysis techniques including, by way of example and not limitation, time-frequency expansion, feature coherence analysis, principal component analysis, and separation analysis. For convenience we may refer to any set of data recorded over an epoch of time and relating to the same sensed system as an “epoch,” even though an epoch is literally just the application time segment. Each epoch may be expanded by feature operators (mathematical manipulations applying waveform analysis techniques) to generate feature segments in an extended phase space representing spatial, time, frequency, phase, and interchannel relationships. The various feature segments corresponding to an epoch may be weighted in an effort to locate the feature segments containing information corresponding exclusively to the state of the epoch. Weightings or weights may be though of as respective coefficients for each mathematical function contributing to composite or sum of contributing functions. Thus a weight is a proportion of contribution of a function or value.
[0016]Once weighted, the feature segments corresponding to an epoch may be summed or superimposed. If successful, the superposition provides a resulting waveform containing a non-random feature or pattern uniquely corresponding to the state of the epoch. If unsuccessful, the operation provides no distinction and the learning system may begin another iteration and apply a different combination of feature operators, feature weights, or both feature operators and feature weights. The learning system may continue processing until the superimposed feature segments of an epoch result in a characteristic feature corresponding exclusively to the state of the epoch. Once the effective feature operators, feature weights, and the like have been determined, they may be incorporated into a separation key. A separation key provides feature operators and weights, along with a resulting waveshape or other characteristic that will reliably distinguish two opposing states.
[0017]In one embodiment of a system in accordance with the present invention, a classification system may use the separation key and apply the feature operators and weights (previously determined to be optimal) to a selected group of epochs referred to as classification epochs. Classification epochs may have known states or unknown states. True epoch state labels may be bound to analyzed epochs to enable a comparison with epoch classifications generated by the classification system. That is, the actual or true state associated with a particular epoch may provide a key to determine if that epoch has been correctly classified. Accordingly, this may provide a method of testing or validating the accuracy of an event contrast stacker. High classification accuracy of non-training epochs (separate and distinct from the learning epochs used in the creation of the separation key), indicates a valid, derived, separation key capable of repeatedly separating signals according to the state of the geological formation from which the signals were collected.
[0018]The classification system may forward certain data to an output generator to compile a statistical summary of the results. Additional outputs may include calculations of sensitivity, specificity and overall accuracy.

Problems solved by technology

However, because of the low signal-to-noise ration (SNR) or high noise-to-signal ratio and complexity of seismic waves and well log data, generating accurate models of resource deposits has been difficult.
Visual inspection may miss vital content that is implicit or hidden (e.g. time domain information).
However, it further obscures other data.
While useful for certain applications, averaging and stacking techniques have several significant drawbacks.
Large quantities of information, just as valuable but less understood, are lost in the averaging or stacking.
Moreover, the averaging process only provides a comparison between groups of offsets or groups of angles rather than between the individual offsets or angles.
Moreover, these approaches have not been fully integrated with computerized condition discrimination.
Like spectral analysis techniques, these approaches rely on visual inspection of the generated waveforms, greatly increasing the possibility of error.
Such filtering methods tend to ignore frequency and temporal information.
Additionally, these filtering techniques are usually applied only to seismic traces that have been averaged (post-stack seismic traces), otherwise the noise level is prohibitive.
The traditional neural network approaches, however, generally take a long time to program and learn, are difficult to train, and tend to focus on local minima to the detriment of other more global and important areas.
Moreover, most of these analysis techniques are limited by a lack of integration with time, frequency, and spatial analysis techniques.

Method used


Image

  • Petroleum exploration and prediction apparatus and method
  • Petroleum exploration and prediction apparatus and method
  • Petroleum exploration and prediction apparatus and method

Examples


example i

[0160]Referring to FIGS. 37-43, in the present example, signals 24 (post-stack gathers) were provided from a twenty square mile area of an operating oil field. The signals had previously been used to generate conventional seismic volumes illustrated in FIGS. 37 and 39. Twelve wells 30 were drilled based on the seismic volumes. As can be seen, all the wells 30 are positioned in areas 234 that the seismic volumes indicated are likely locations for oil.

[0161]Of the twelve bores 30 or wells 30, two resulted in oil wells 30a, 30b, two resulted in dry holes 30c, 30d, and two resulted in wet holes 30e, 30f (water filled). The states of the remaining six wells 30g, 30h, 30i, 30j, 30k, 30m were known to the owners of the oil field, but were withheld until processing in accordance with the present invention was completed.

[0162]As illustrated in FIG. 41, selected signals 24 corresponding to each of the wells 30 were provided for processing. The number 236 of signals 24 provided for each well 3...

example ii

[0169]Referring to FIGS. 44-49, in the present example, traces (post-stack gathers) were collected from an eight square mile area of an operating gas field. The data was used to form the conventional seismic volume illustrated in FIG. 47. Five wells 30 were drilled based on that seismic volume. As can be seen, all the wells 30 are positioned in areas 234 that the seismic volume indicated as likely locations for gas.

[0170]Of the five wells 30, well one 30a resulted in a gas well and well two 30b resulted in non-producing wet hole (producing water not gas). The states of the remaining three wells 30c, 39d, 30e were known to the owners of the gas field, but were withheld until completion of processing in accordance with the present invention.

[0171]As illustrated in FIG. 44, selected signals 24 corresponding to each of the wells 30 were provided for processing. The number 236 of signals 24 provided for each well 30 ranged from 431 to 606. The signals 24 were processed by an event contra...

example iii

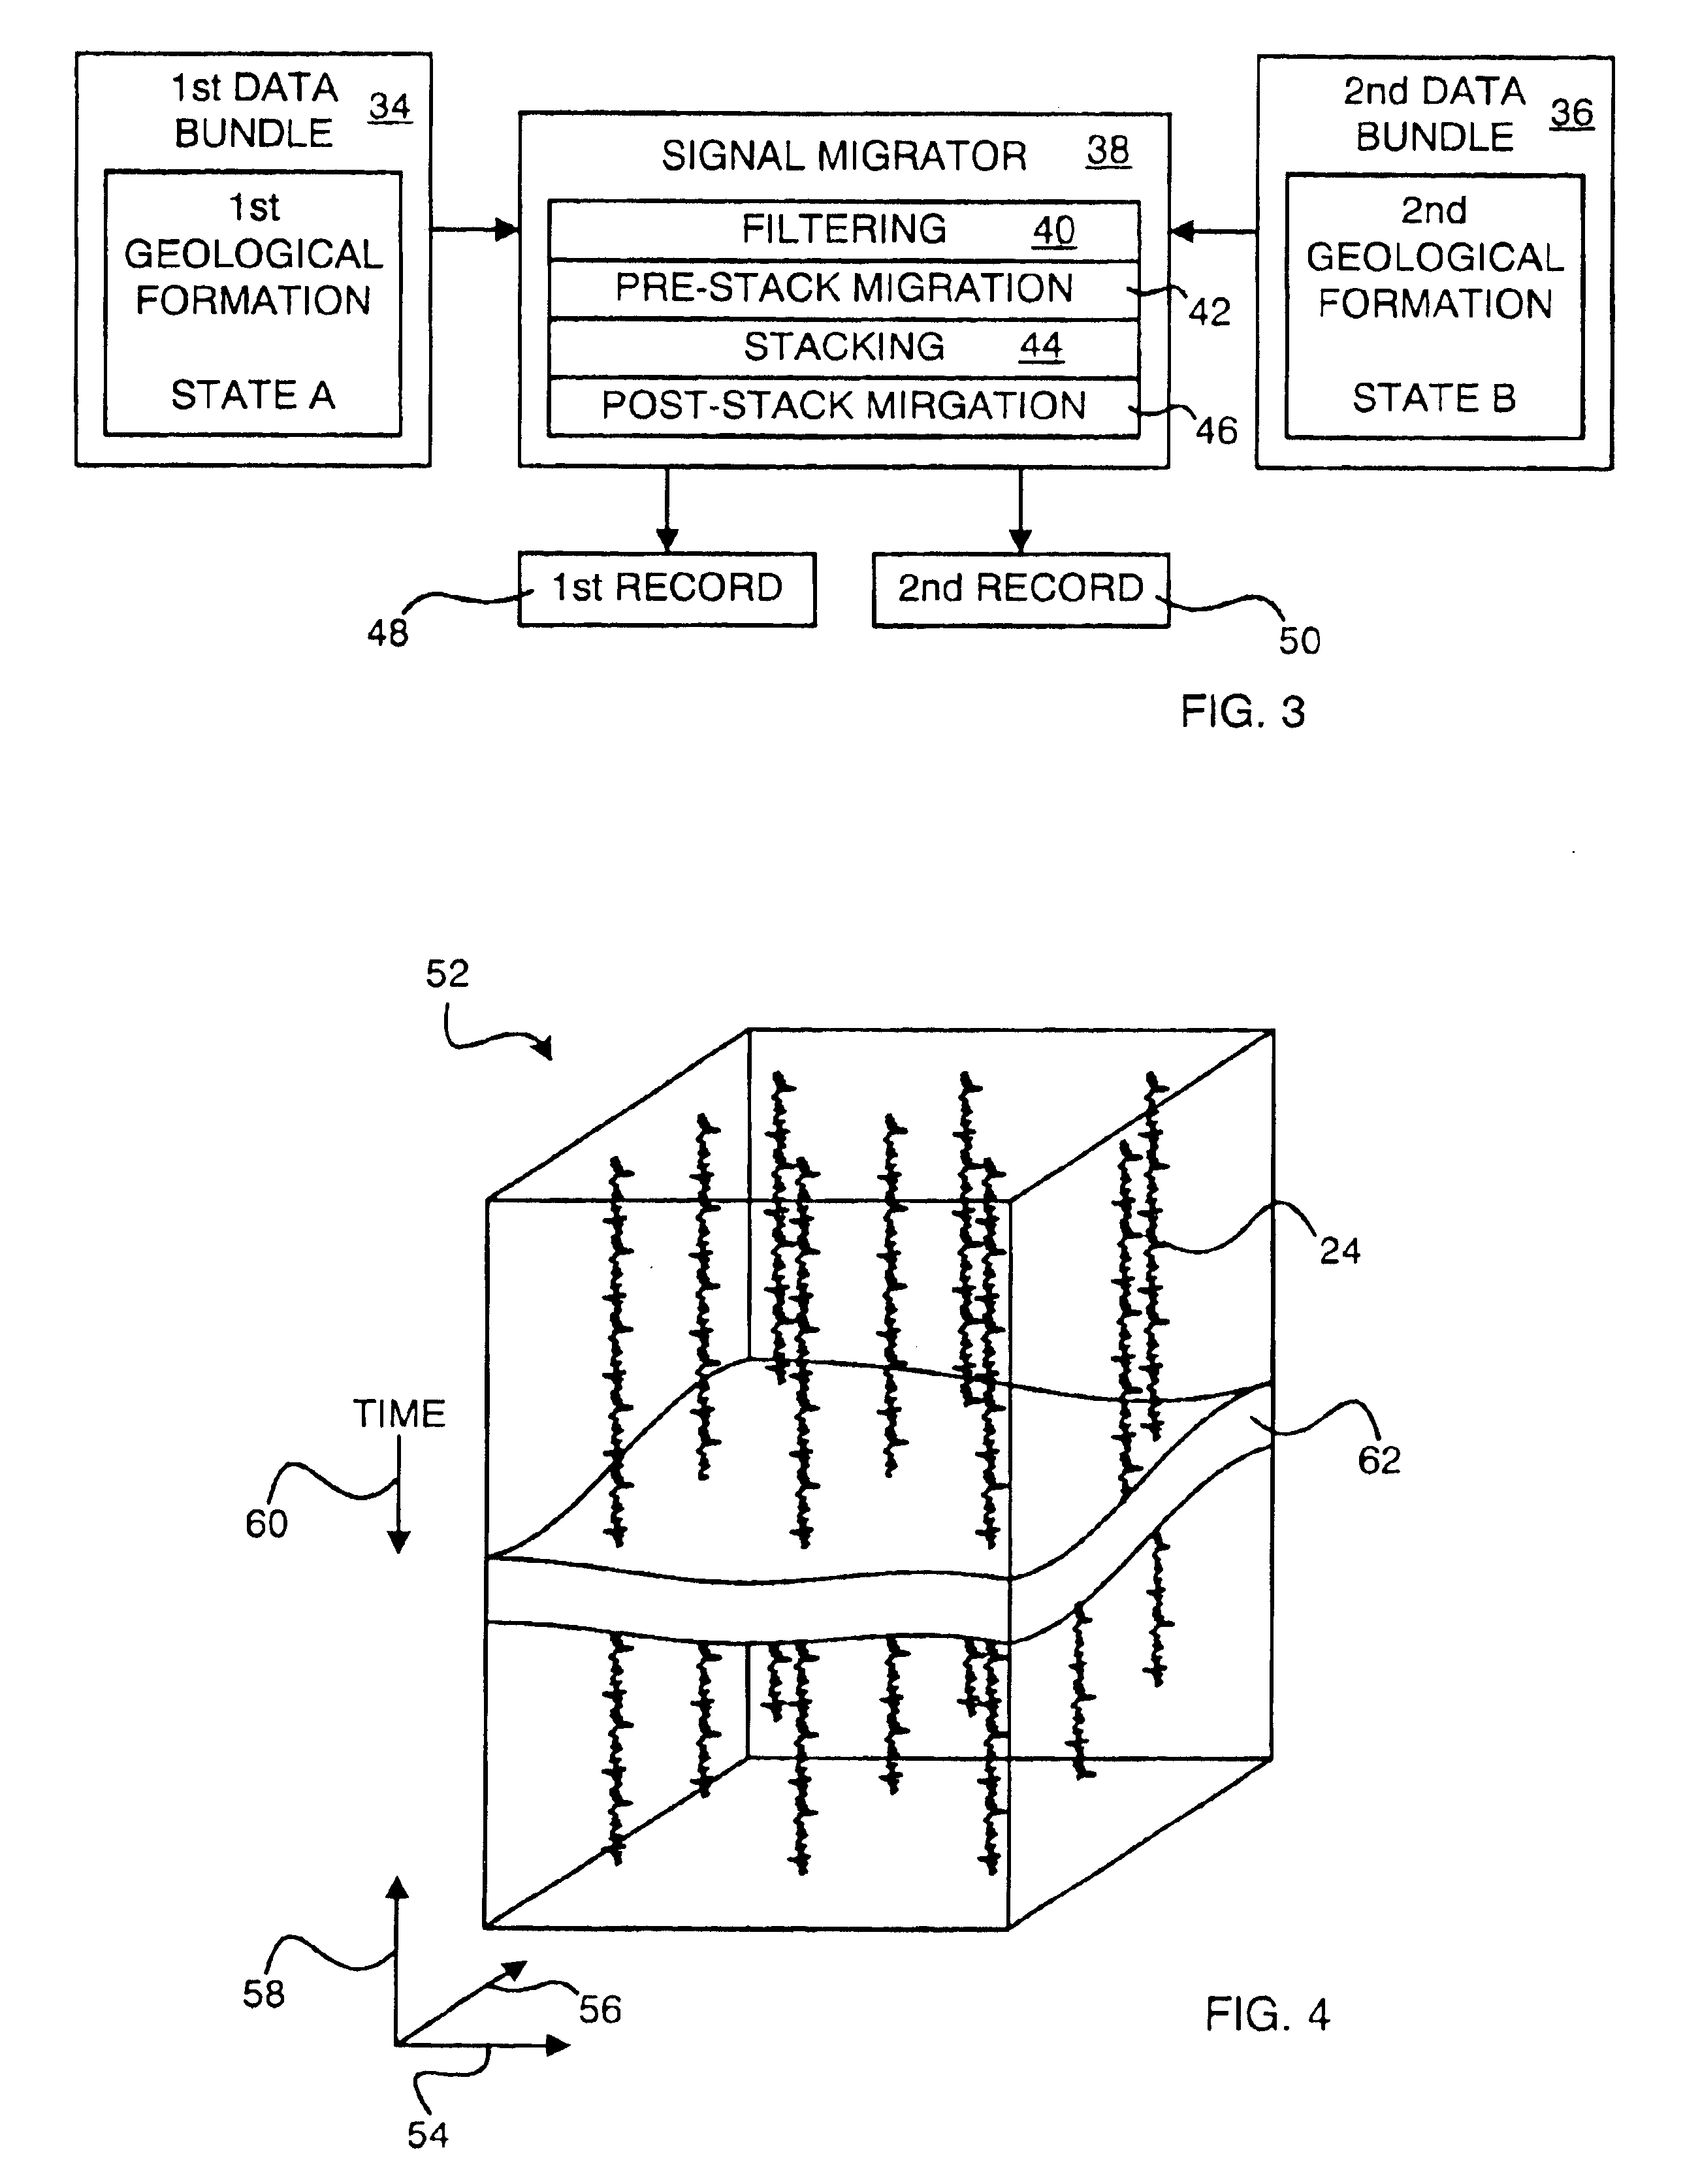
[0179]Referring to FIG. 50, in the present example, signal 24 was provided from a first geological formation 19 having gas production rates above a selected economic value and a geological formation 19 having gas production rates below a selected economic value. Epochs 68 corresponding to the first and second geological formations 19 were used as learning epochs 72 and processed by a learning system 76 in accordance with the present invention.

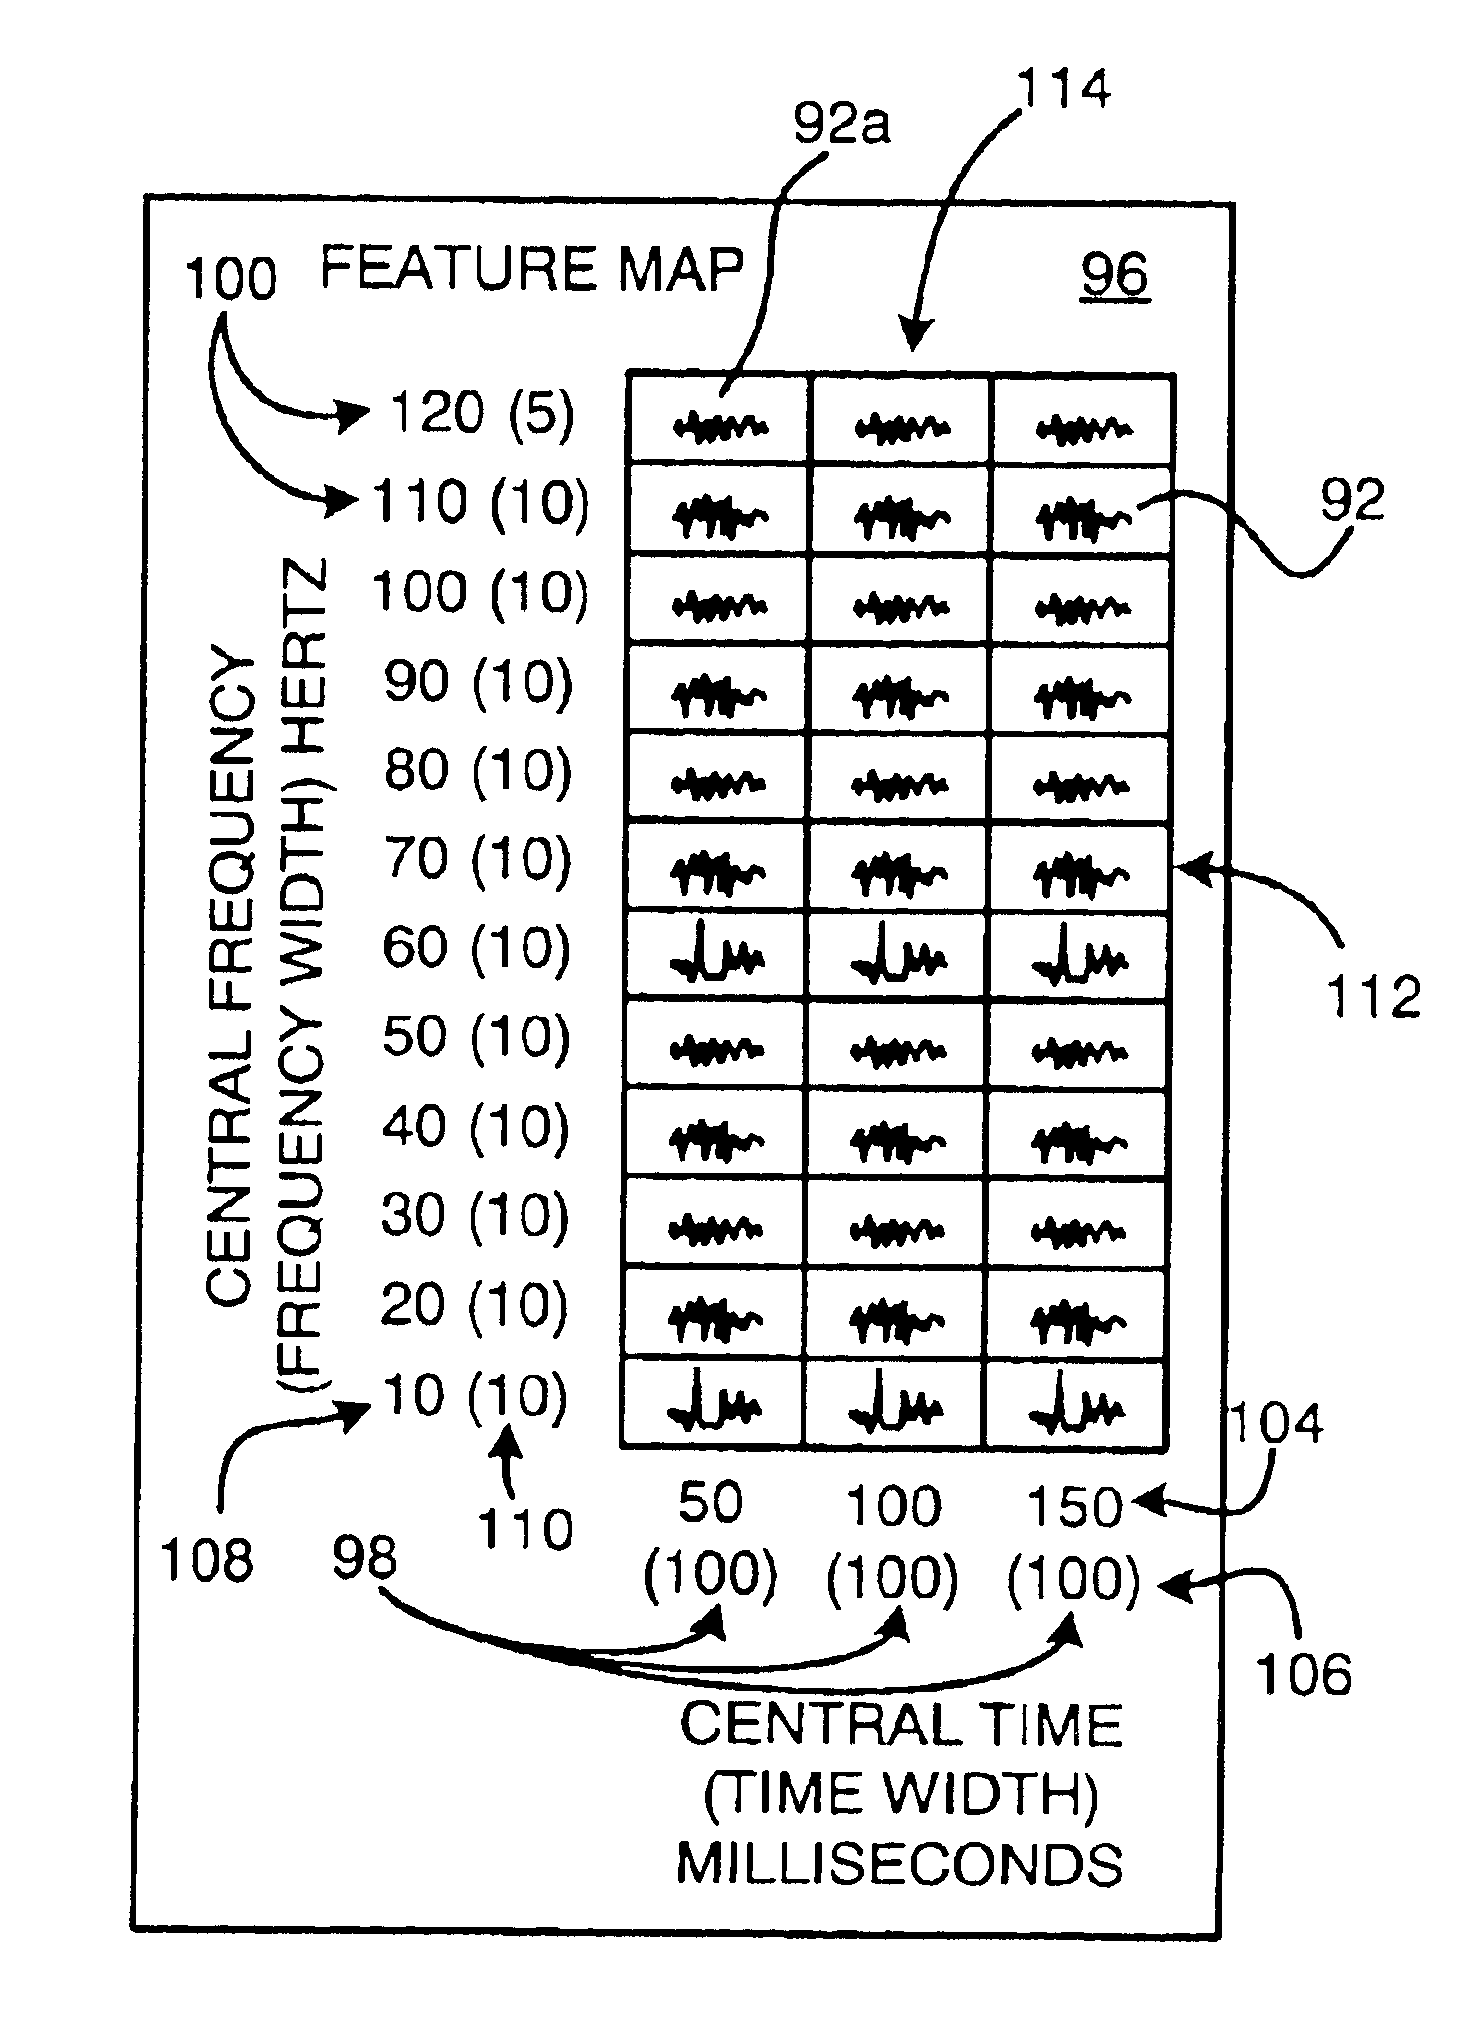
[0180]After processing, the learning system 76 produced a separation key 80 effective to separate geological formations 19 having gas production above a selected value from geological formations 19 having gas production below a selected value. The separation key 80, illustrated in part in FIG. 50, instructs that each epoch 72 be divided in both time and frequency space. In time space, each epoch 72 may be divided into four time segments 98. The time segments 98 may be weighted with Gaussian distributions 102 centered at 25 ms, 50 ms, 75 ms, and...


PUM


Abstract

A method for predicting the state of a geological formation. The method may include generating a separation key effective to extract a first feature from a signal or signals corresponding to a first state and a second feature, distinct from the first feature, from a signal or signals corresponding to a second state. The separation key may list at least one feature operator and a weighting table. The at least one feature operator may expand a test signal collected from a geological formation of unknown state in at least one of frequency space and time space to generate a plurality of feature segments. A weighting table may weight the plurality of feature segments. The weighted plurality of feature segments may be superimposed to form a third feature. The geological formation may be classified as having one of the first state and second state based on the correspondence of the third feature to one of the first feature and second feature.

Description

RELATED APPLICATIONS[0001]This application claims the benefit of U.S. Provisional Application Ser. No. 60 / 416,342, filed Oct. 4, 2002, and entitled SEISMIC EVENT CONTRAST STACKING AND OTHER USES OF EVENT RESOLUTION IMAGING WITHIN THE OIL AND GAS INDUSTRY. Moreover, this application is a continuation-in-part of U.S. patent application Ser. No. 10 / 364,785, filed Feb. 11, 2003, now U.S. Pat. No. 6,745,156 and entitled SIGNAL INTERPRETATION ENGINE.BACKGROUND[0002]1. The Field of the Invention[0003]This invention relates to signal processing and, more particularly, to novel systems and methods for pattern recognition and data interpretation relative to monitoring and categorizing patterns for predictably detecting and quantifying hydrocarbon deposits.[0004]2. The Background Art[0005]Seismic waves have been used to generate models of the earth's composition. In more recent times, seismic waves have been employed in an effort to located resources such as oil and gas deposits within the ear...

Claims


Application Information

Patent Timeline
Patent Type & Authority Patents(United States)
IPC IPC(8): G01V1/28G01V1/30
CPCA61B5/04012A61B5/0476G01V1/28G01V1/282G01V1/30G06K9/00536G06K9/6253A61B5/04008G01V2210/51G01V2210/512A61B5/245A61B5/316A61B5/369G06F2218/12G06F18/40
Inventor COOK, DANIEL R.WALTHER, JOHN D.
Owner COOK DANIEL R
Why Eureka
Try Eureka