
Dynamic deviation

Inactive Publication Date: 2003-07-29
CEREBRUS SOLUTIONS LTD
View PDF15 Cites 28 Cited by
  • Summary
  • Abstract
  • Description
  • Claims
  • Application Information

AI Technical Summary

Benefits of technology

Advantageously, the method gives better tracking of slow changes in behaviour over time than does the standard measures of mean and standard deviation.
Advantageously, the method minimises calculation steps involved at each stage and obviates storing all past values for calculating the profile value.

Problems solved by technology

Associated with this proliferation of networks is a rise in fraudulent use of such networks the fraud typically taking the form of gaining illicit access to the network, and then using the network in such a way that the fraudulent user hopes subsequently to avoid paying for the resources used.
This may for example involve misuse of a third party's account on the network so that the perpetrated fraud becomes apparent only when the third party is charged for resources which he did not use.
In practice it is impractical to retain all historic values of events.
This is because all previous deviations from the mean must be recalculated when the mean changes and this cannot be done if previous values have not been retained.
A disadvantage of using the conventional statistical averages and measures of variance such as mean and standard deviation is that all input data values have equal influence on the resulting measures.
In situations where the event data may be locally stable but vary significantly over longer time scales (e.g. telephone account usage patterns), it is undesirable that older data values relating to prior (pseudo-)stable states should retain equal influence in measures to be applied to the current (pseudo-)stable state.

Method used


Image

  • Dynamic deviation
  • Dynamic deviation
  • Dynamic deviation

Examples


Embodiment Construction

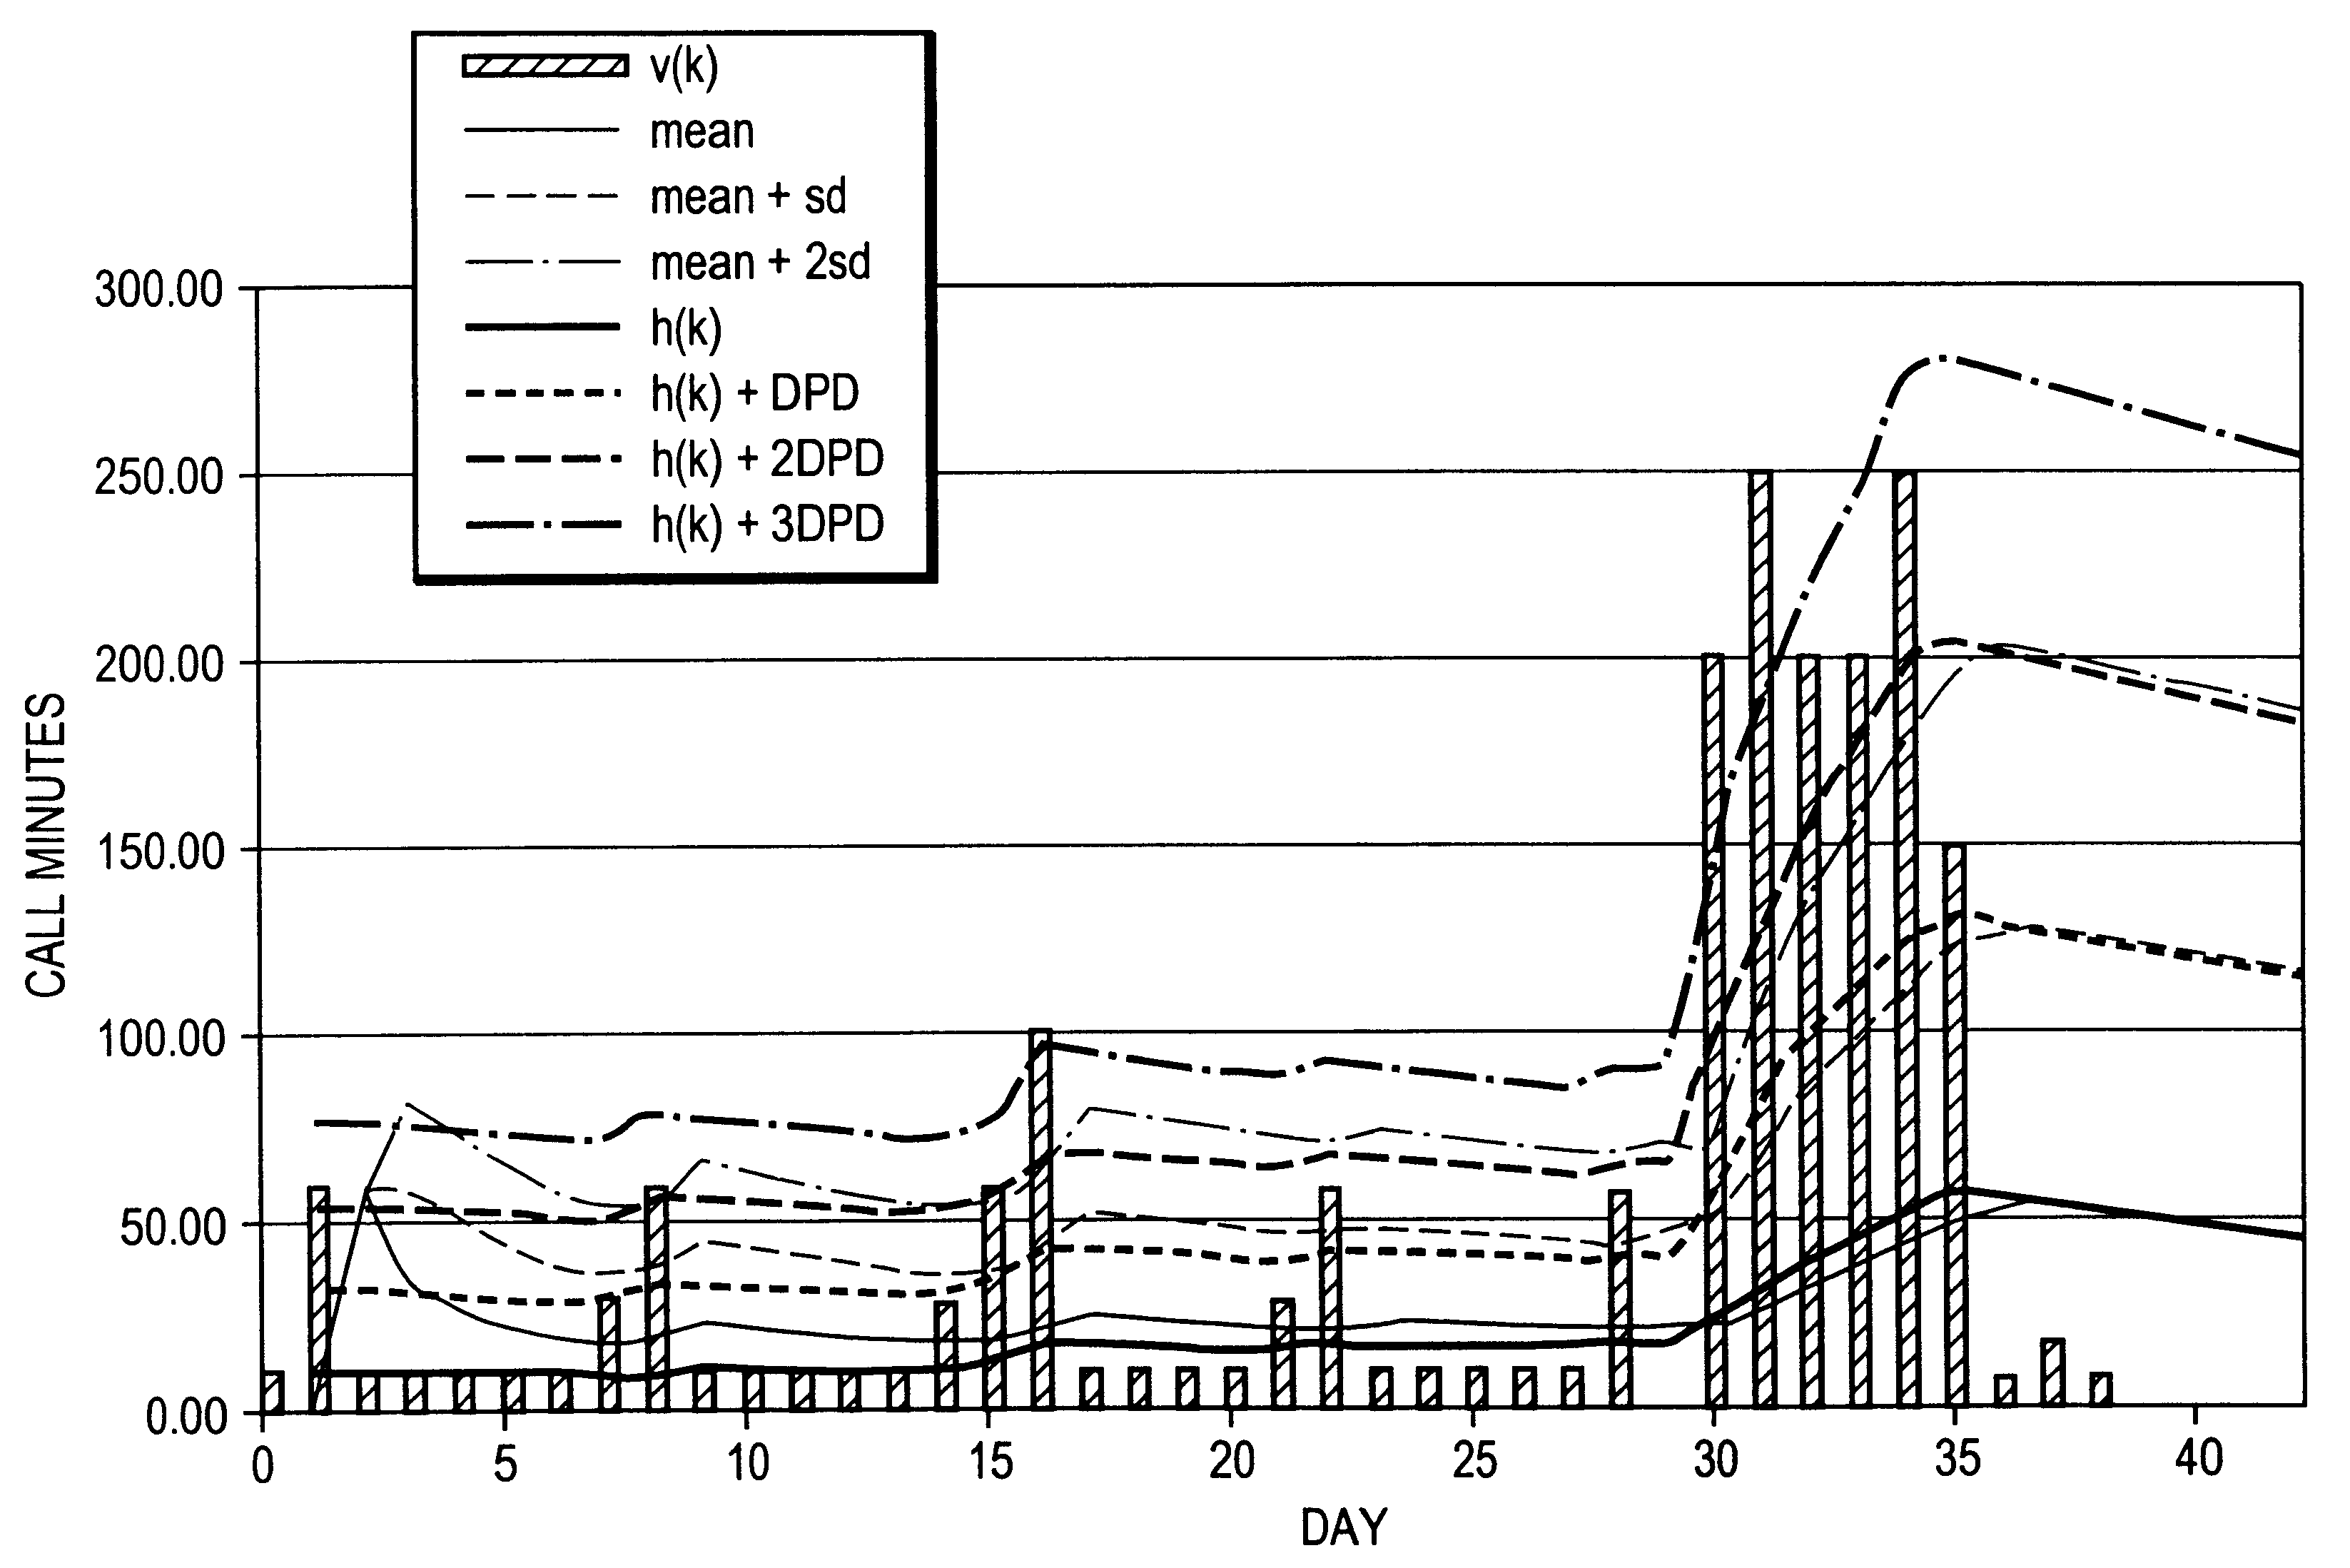
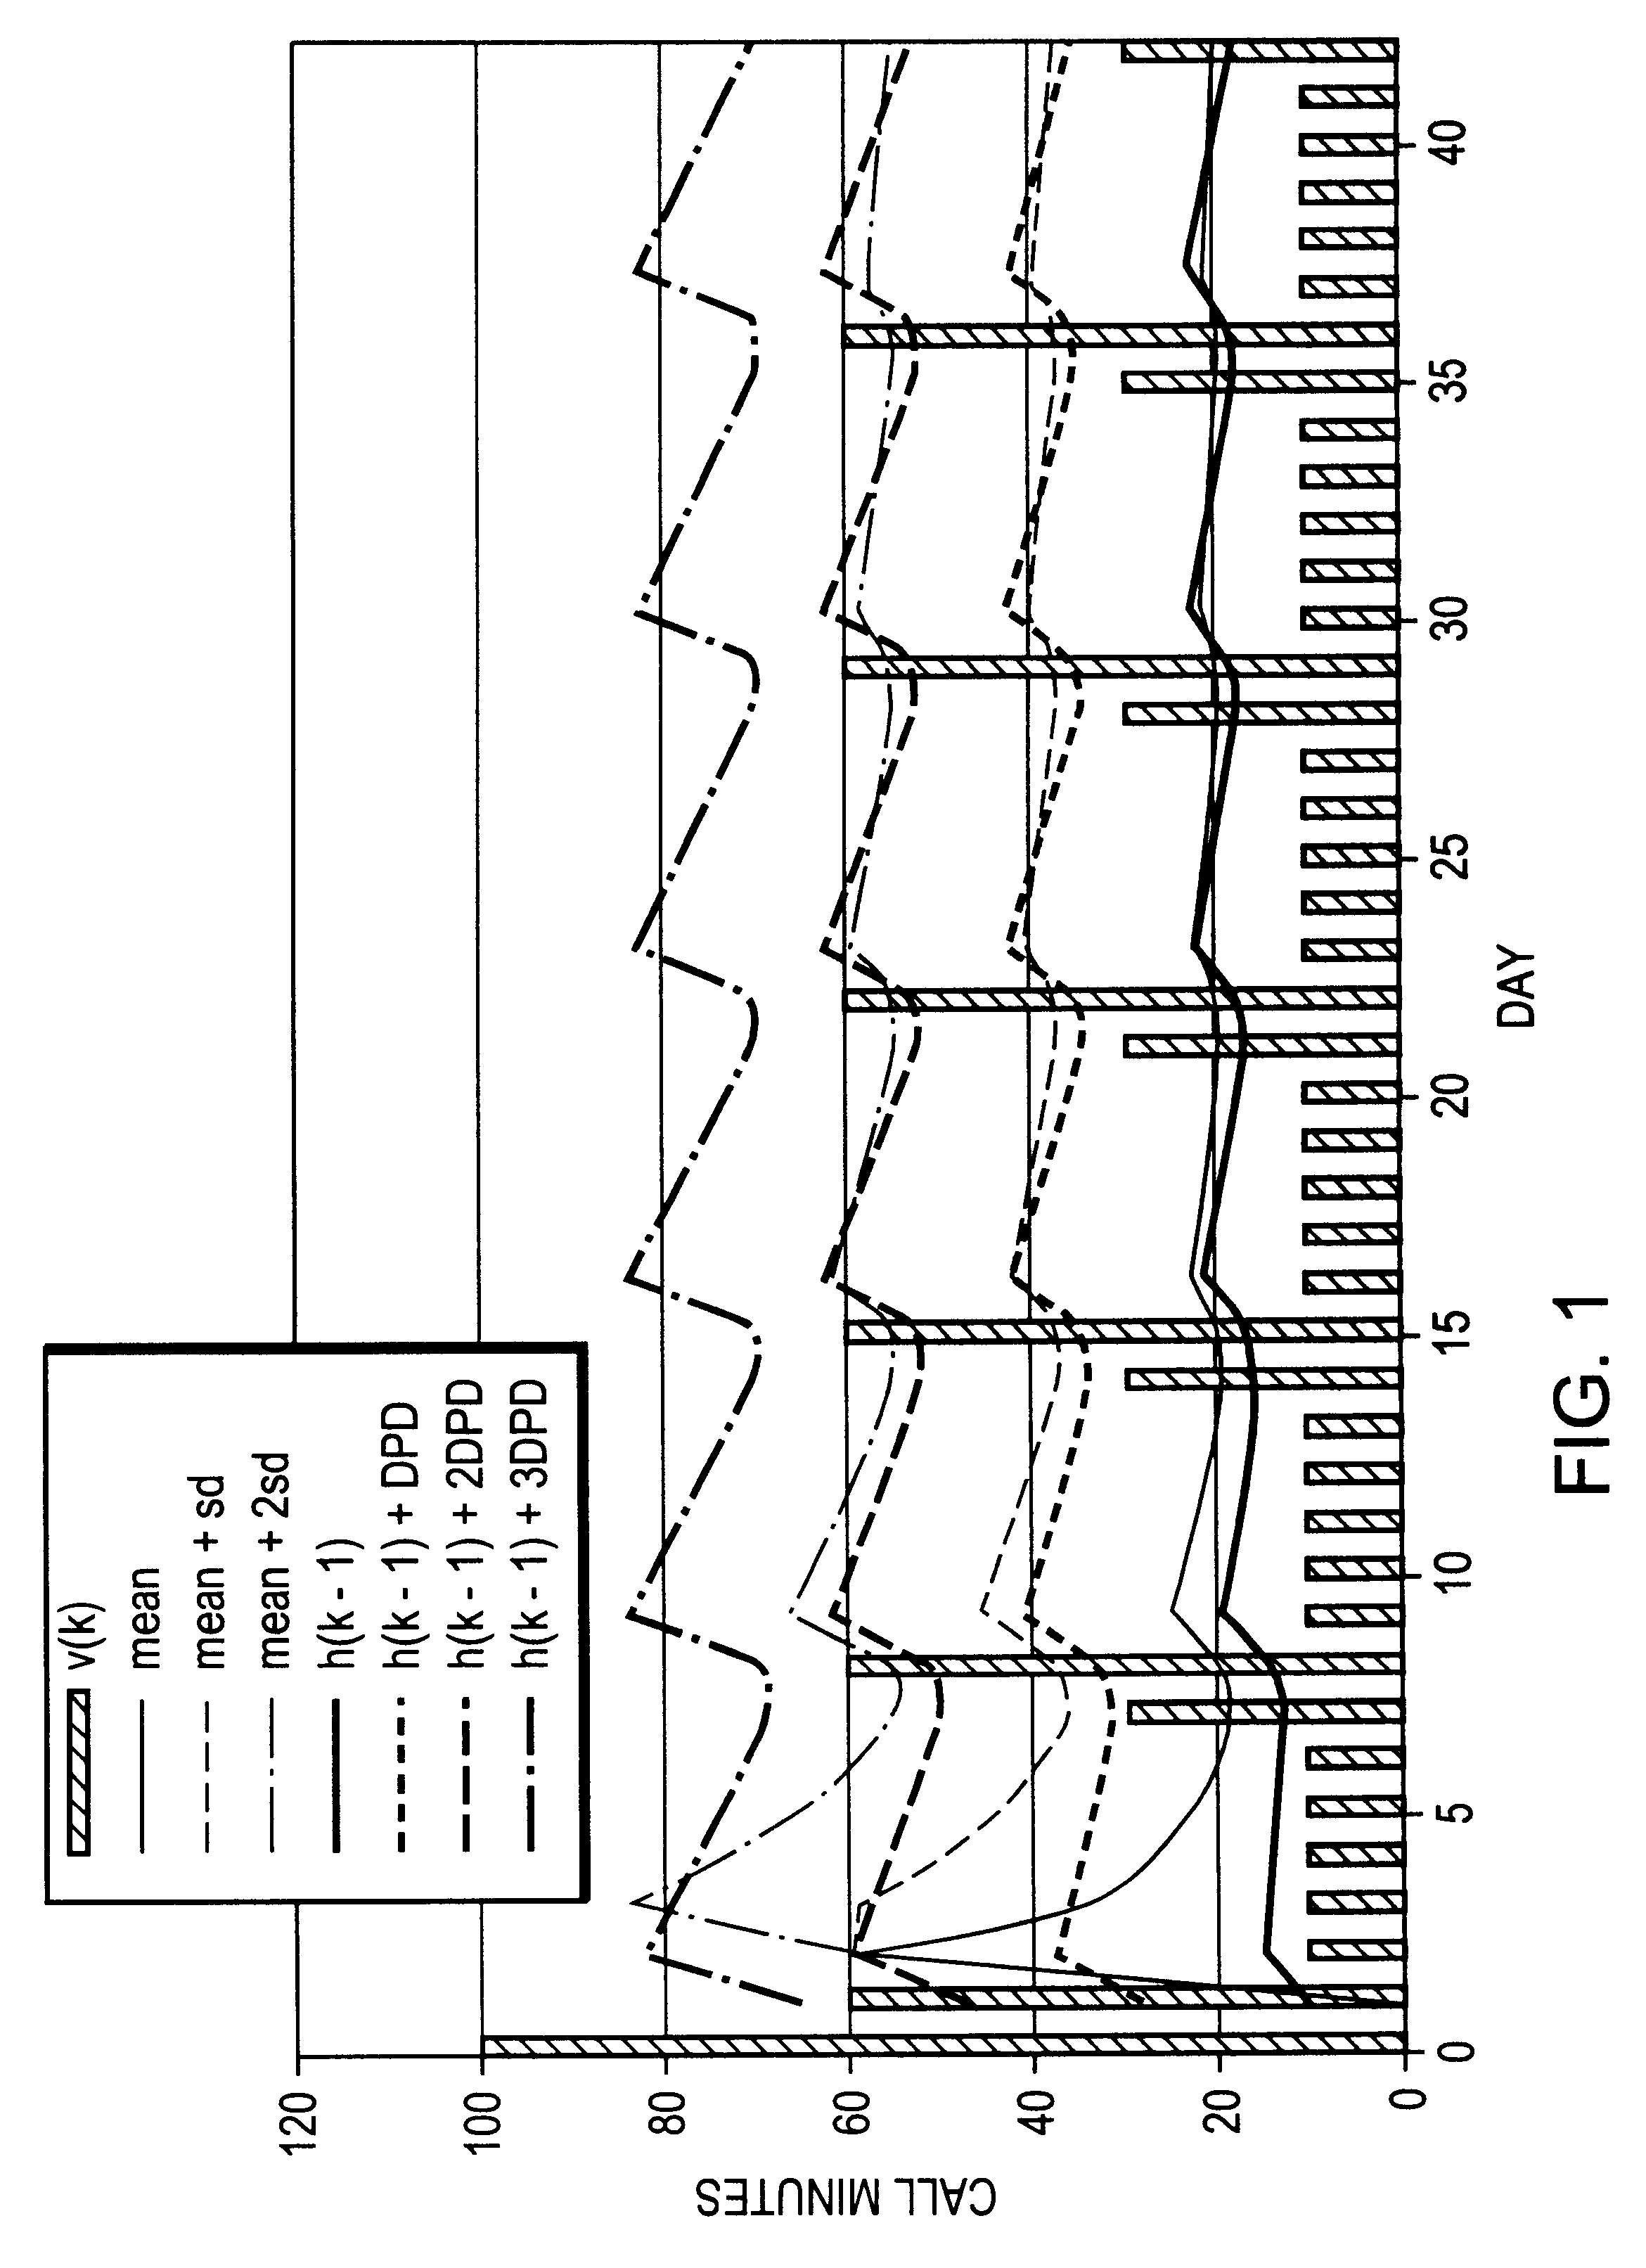
The invention is now described by way of example in the context of anomaly (fraud) detection in telecommunications account data. However, as will be apparent to the skilled reader, the scope of application of the method described extends to many more application areas. Referring now to FIG. 1, there is shown a series of data values, v(k), representative of the number of minutes of call time used by a mobile telephone subscriber over successive days. For simplicity in this example a simple recurring call pattern is shown with 10 minutes call time on week days, 30 minutes on Saturdays, and 60 minutes on Sundays. The graph is overlaid with an indication of the values associated with the mean, mean plus one standard deviation, and mean plus two standard deviations. The graphs for these statistical measures has been offset one period to the right so as more clearly to indicate the actual statistical values associated with past data with which each successive new item of data, v(k), would...


PUM


Abstract

A method and related apparatus and software of detecting anomalies in a stream of data values. The method comprises the steps of: receiving a data value on the stream of data; calculating a new weighted average responsive to the received data value, a previously stored weighted average associated with the stream of data, and a decay rate in the range of 0 to 1; and calculating a new measure of deviation from the new weighted average responsive to the new weighted average, the data value, a previously stored measure of deviation associated with the stream of data, and the decay rate.

Description

The present invention relates to a method and apparatus for deriving a statistical measure of variation from a decaying mean, and in particular to their use in telecommunications and anomaly detection applications and a system incorporating the same.BACKGROUND TO THE INVENTIONIn recent years there has been a rapid increase in the number of commercially operated telecommunications networks in general and in particular wireless telecommunication networks. Associated with this proliferation of networks is a rise in fraudulent use of such networks the fraud typically taking the form of gaining illicit access to the network, and then using the network in such a way that the fraudulent user hopes subsequently to avoid paying for the resources used. This may for example involve misuse of a third party's account on the network so that the perpetrated fraud becomes apparent only when the third party is charged for resources which he did not use.Since fraudulent use of single account can cost...

Claims


Application Information

Patent Timeline
IPC IPC(8): H04M15/00
CPCH04M15/47H04M15/00H04M2215/0148
Inventor DEMPSEY, DEREK M.
Owner CEREBRUS SOLUTIONS LTD
Learn More