Diagnostic Tools and Treatments for Clear Cell Renal Cell Carcinoma
a renal cell carcinoma and diagnostic tool technology, applied in the field of cancer treatment methods, can solve the problems of rcc (mrcc), tyrosine kinase inhibitors, and patients with localized r
- Summary
- Abstract
- Description
- Claims
- Application Information
AI Technical Summary
Benefits of technology
Problems solved by technology
Method used
Image
Examples
example 1
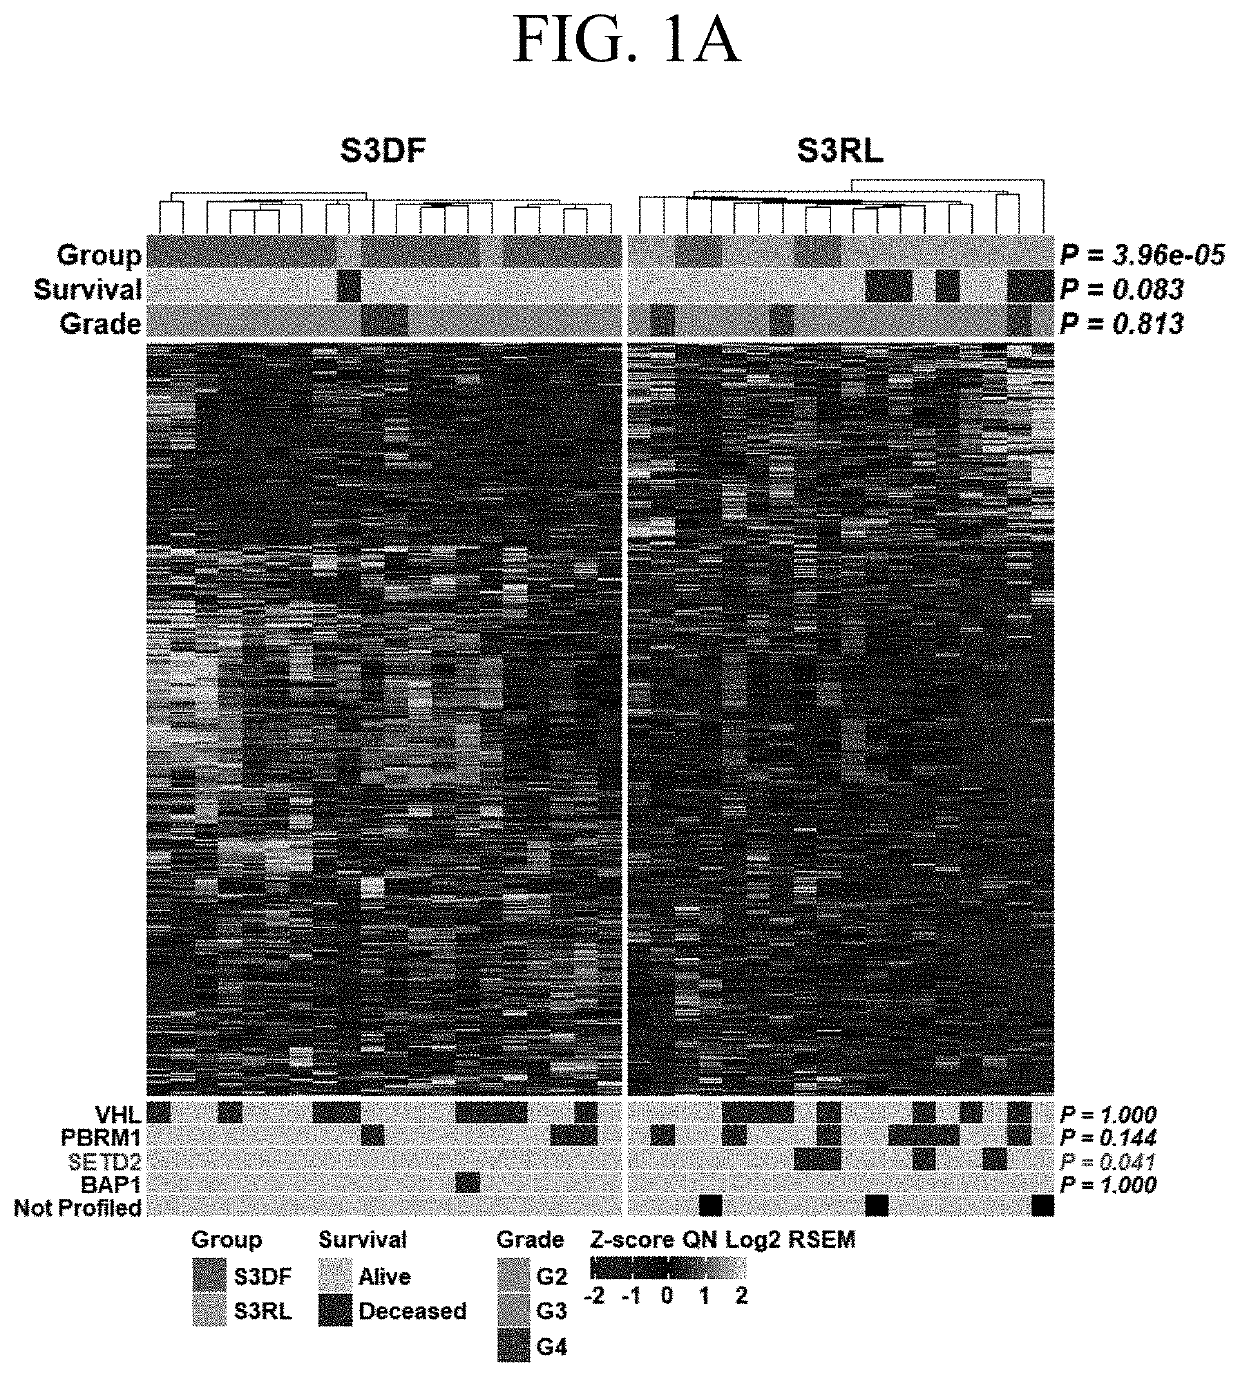
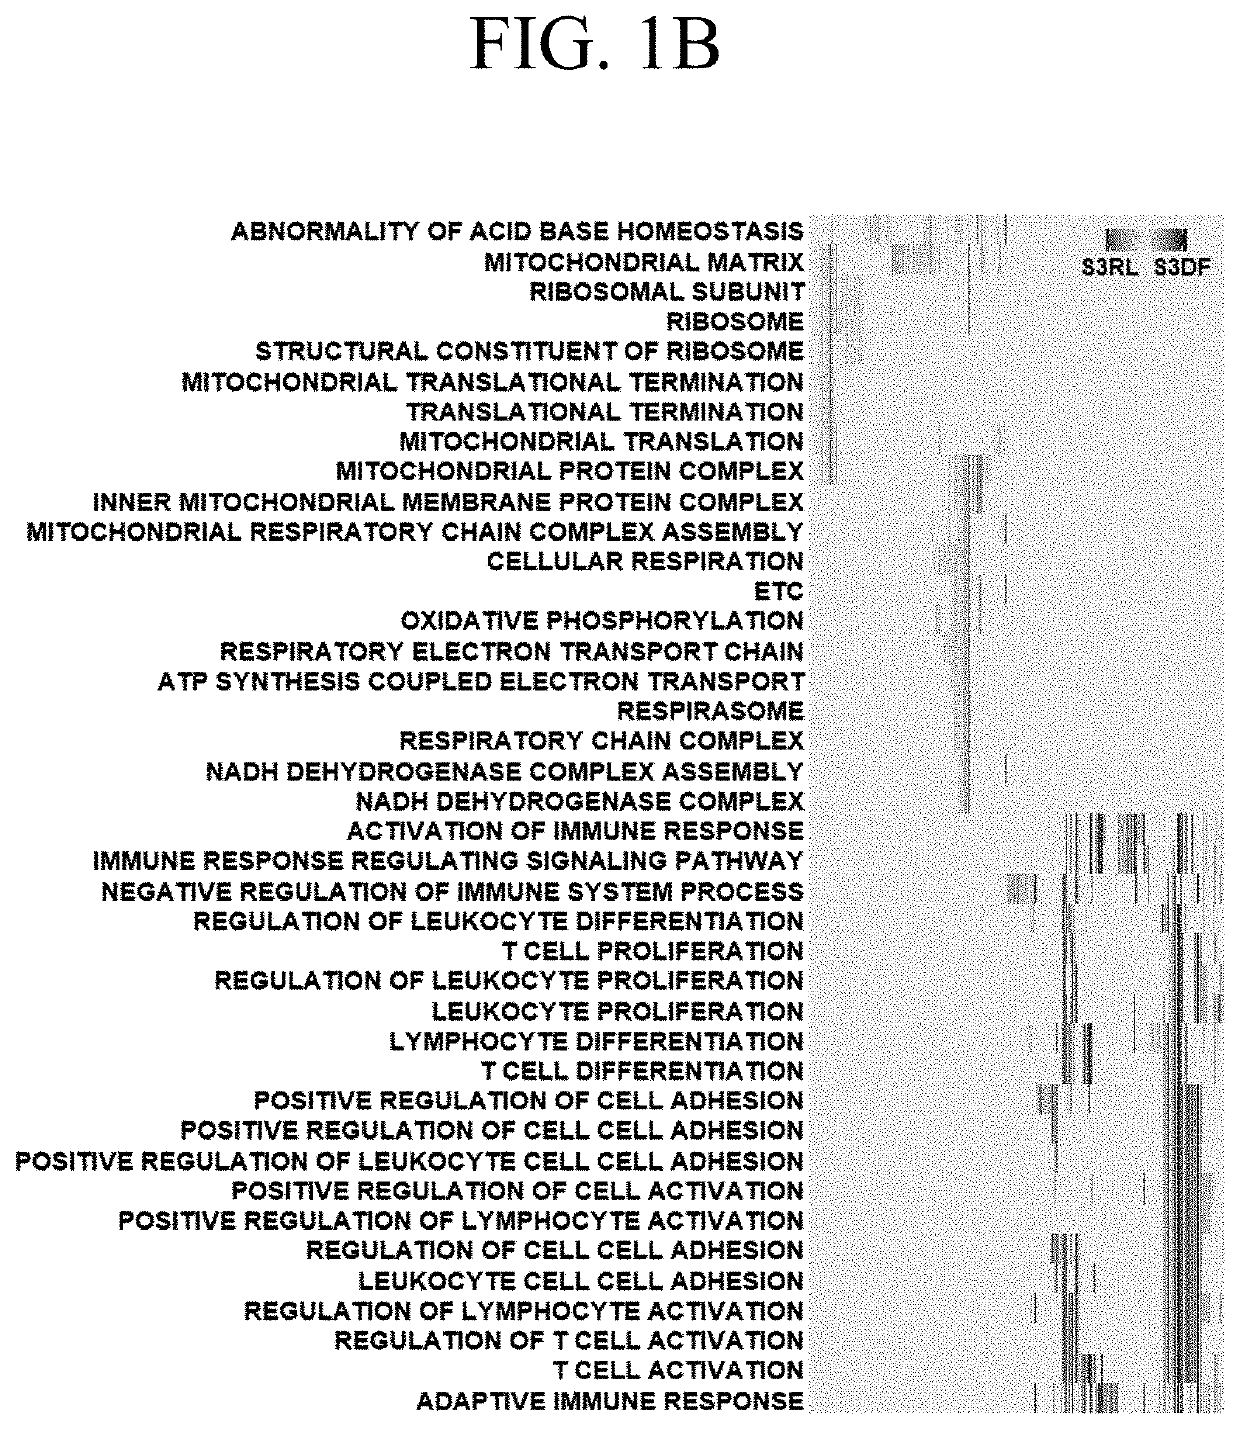
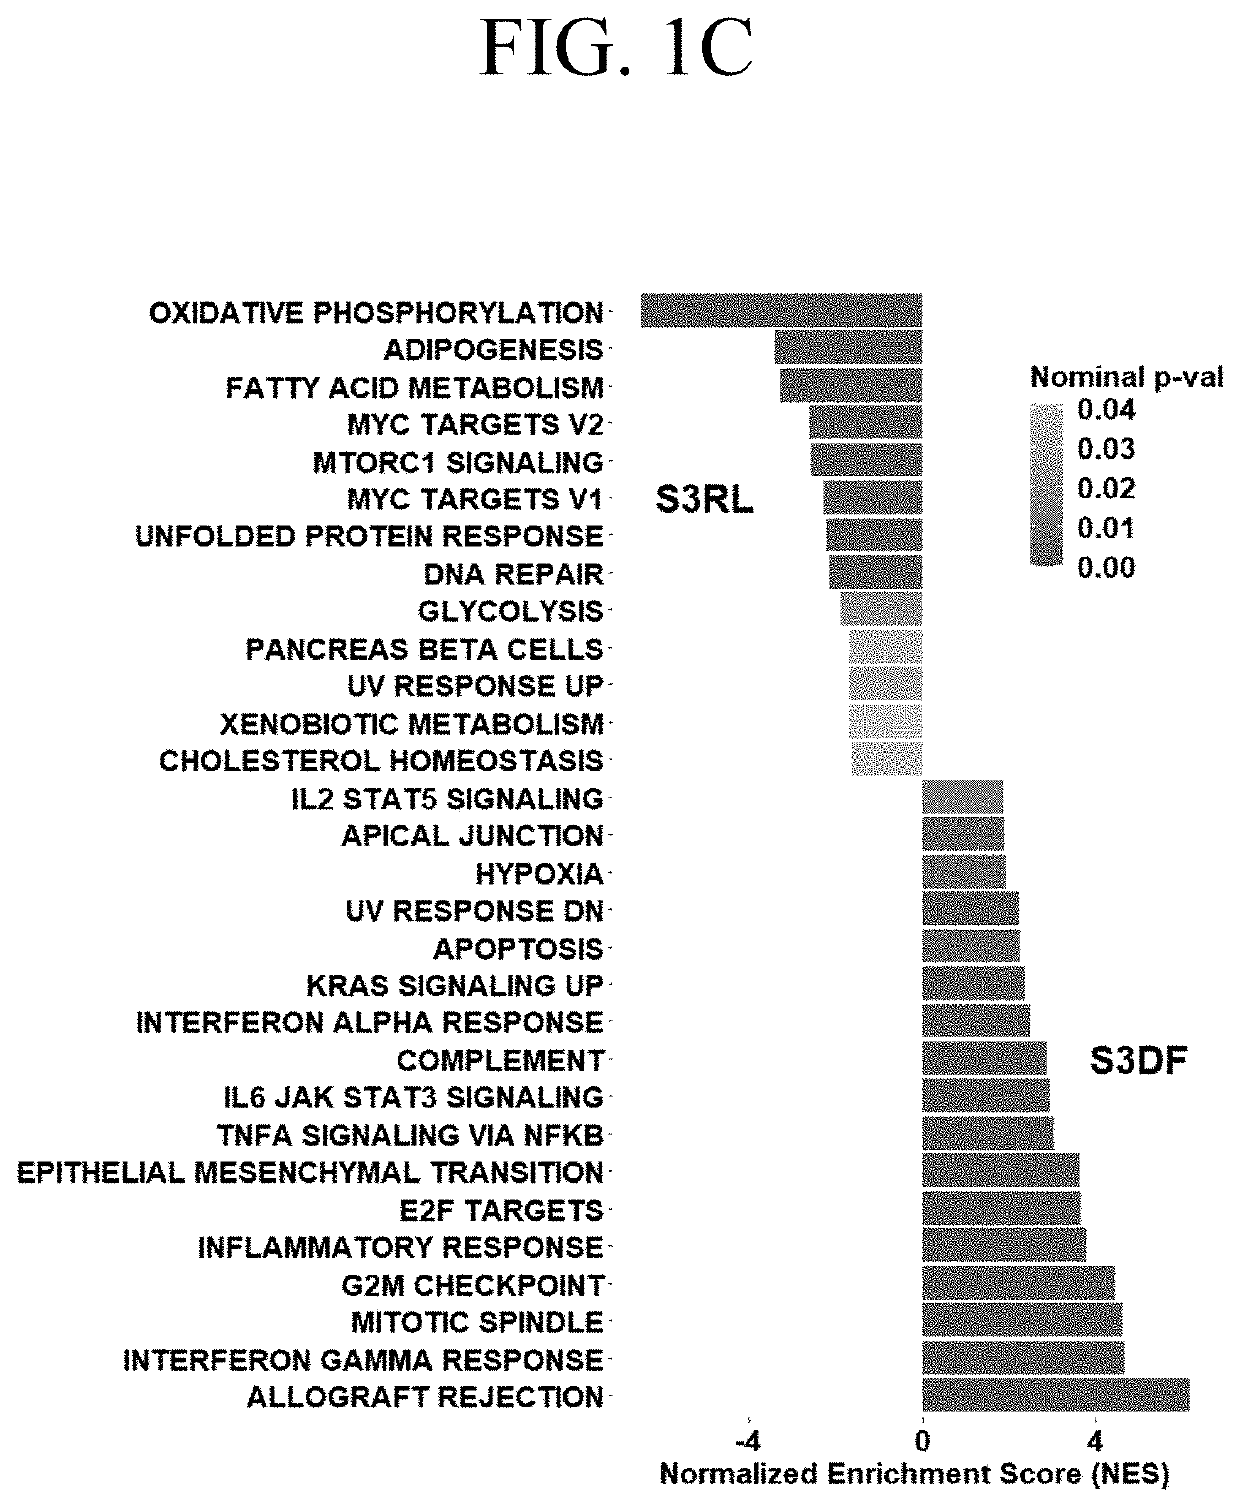
[0069]Differential gene expression was analyzed between a set of stage III tumors from patients who remained disease free (DF) versus matched tumors from patients who relapsed (RL) within 24 months after nephrectomy. The data were obtained from the TCGA Firehose Legacy cohort and were focused on males, as the predominant population suffering from ccRCC and belonging to the Caucasian race as continuum of our previous work. The 24 months cut off was chosen based on lack of reliable survival data for later time points in the TCGA database. Moreover, focus on early recurrence allows to identify pathways specific for patients with aggressive disease. Data were accessed through C-Bioportal.
[0070]FIG. 1A is a heatmap of 1267 genes stratified by patients with stage 3 ccRCCs into those who within 24 months after initial nephrectomy remained disease free (S3DF, green) and those who relapsed (S3RL, orange). The heatmap of all differentially expressed genes shows significant stratification with...
example 2
[0072]FIG. 2 is a 23-gene signature of genes that are useful for diagnosing the likelihood of recurrence of clear cell renal cell carcinoma in a subject. The 23-gene signature of genes encoding subunits of electron transport chain (ETC), mitochondrial ribosomal proteins (MRP) and class II major histocompatibility complex (MHC-II) stratify stage 3 ccRCC into low- (L), high- (H) or intermediate (I) risk of relapse. Deceased patients are significantly overrepresented in the high-risk group and absent in the low risk group. Grade does not associate with risk group.
example 3
[0073]Five tumor cuts of 5 μm thickness per sample were homogenized and lysed in a protein extraction buffer in the presence of an EDTA-free protease inhibitor with assistance of an ultra-sonication micro-probe in an ice bath. The extracted solution was filtered against a 0.45 μm membrane and 100 μl injected to a high-performance liquid chromatograph instrument with 50 mM ammonium acetate pH 7.4 as mobile phase with a size exclusion column with a 700-2 kDa exclusion range. The HPLC system was connected to an inductively coupled plasma mass spectrometer tuned for copper analysis in time resolved mode. FIG. 3A is a graph showing the signal copper peak corresponding to 500-400 kDa for S3RL tumors. The peak was characterized as Cu-COX complex by using a set of MT-CO2 and COX4 antibodies against subunits of the complex IV. The copper concentration in this peak was calculated against copper standards and normalized to the total phosphorous content in each sample extract. FIG. 3B is a grap...
PUM
| Property | Measurement | Unit |
|---|---|---|
| molecular mass fraction | aaaaa | aaaaa |
| molecular mass fraction | aaaaa | aaaaa |
| time | aaaaa | aaaaa |
Abstract
Description
Claims
Application Information
 - R&D
- Intellectual Property
- Life Sciences
- Materials
- Tech Scout
- Unparalleled Data Quality
- Higher Quality Content
- 60% Fewer Hallucinations
Browse by: Latest US Patents, China's latest patents, Technical Efficacy Thesaurus, Application Domain, Technology Topic, Popular Technical Reports.
© 2025 PatSnap. All rights reserved.Legal|Privacy policy|Modern Slavery Act Transparency Statement|Sitemap|About US| Contact US: help@patsnap.com


