Method

a biomarker and cardiovascular disease technology, applied in the field of new cardiovascular risk biomarkers, can solve the problems of insufficient blood supply to downstream tissue, weak extracellular matrix separating the lesion from the arterial lumen, and often asymptomatic plaques, so as to increase the risk of death, increase the risk of cardiac mortality, and increase the risk of mortality.

Active Publication Date: 2019-09-19
OXFORD UNIV INNOVATION LTD
View PDF0 Cites 5 Cited by
  • Summary
  • Abstract
  • Description
  • Claims
  • Application Information

AI Technical Summary

Benefits of technology

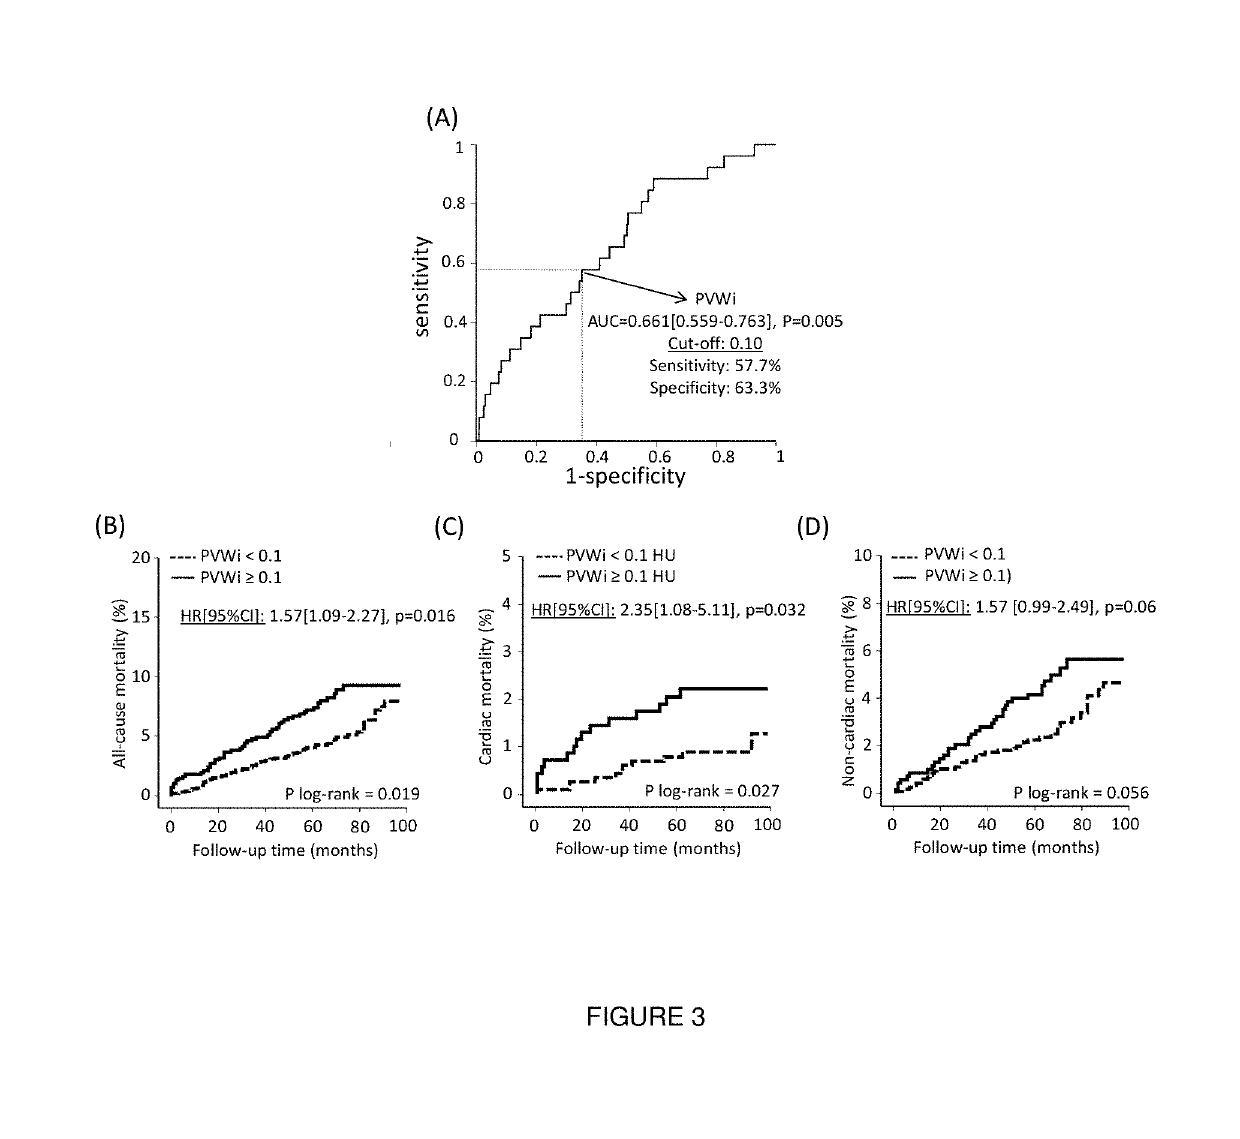
[0033]FIG. 3 shows PVWi as a predictor of all-cause, cardiac and non-cardiac mortality. Receiver operating characteristic curve analysis identified a cut-off of 0.10 with 57.7% sensitivity and 63.3% specificity for prediction of cardiac mortality (A). Comparison of KM curves by the log-rank test as well as univariate Cox regression analysis showed that high PVWi values (≥0.10) are associated with a significantly higher risk of all-cause (B) and cardiac mortality (C) but not non-cardiac mortality (p=NS). AUC: area under the curve; CI: confidence intervals; HR: hazard ratio PVWi: Perivascular Water index; ROC: receiver operating characteristic curve.
[0034]FIG. 4 shows the predictive value of FAIPVAT and VPCI for all-cause and cardiac mortality. We first explored the predictive value of our novel imaging indices by splitting the study population in tertiles according to their respective FAIPVAT and VPCI values. Individuals in the high FAIPVAT group had an almost two-fold increase in their risk of death (A) and almost four times higher risk of cardiac mortality compared to those in the lowest tertile (B). Notably, visual assessment of the Kaplan-Meier curves revealed a similar trend for the mid- and low-tertile groups, suggesting the presence of a certain cut-off, above which the risk of mortality significantly increases. In fact, ROC curve analysis revealed an optimal cut-off of −70.1 HU that was able to predict cardiac death with 65.4% sensitivity and 71.9% specificity (C). By following a similar approach, an optimal cut-off of 14.5% was identified for VPCI as a predictor of cardiac mortality (D). Interestingly, high VPCI values (≥14.5%) were associated with a higher risk of cardiac-related (F) but not all-cause mortality (E). AUC: area under the curve; CI: confidence intervals; FAIPVAT: fat attenuation index of perivascular adipose tissue; HR: hazard ratio; ROC: receiver operating characteristic curve, VPCI: volumetric perivascular characterisation index.
[0035]FIG. 5 shows the predictive value of high FAIPVAT (≥−70.1 HU) for all-cause, cardiac and non-cardiac mortality. In univariate Cox regression analysis, high FAIPVAT was linked to a two-fold increase in the risk of all-cause mortality (A) and a more than five-fold increase in the risk of cardiac death (B) compared to the low FAIPVAT group. More importantly, FAIPVAT remained predictive of both all-cause and cardiac mortality in multivariable cox-regression (Panel C, where HR: hazard ratio from cox regression (for FAIPVAT<−70.1 HU vs≥−70 HU)). *adjusted for age, gender, hypertension, hypercholesterolemia, diabetes mellitus, active smoker status, medications (antiplatelets and statins), presence of coronary artery disease, calcium index, Agatston score (≥400 vs<400) and type of CT scanner). Interestingly, the predictive value of FAIPVAT appears to be specific for cardiac rather than non-cardiac mortality, suggesting that the new biomarker describes a cardiac-specific biology and that it provides additional information, beyond that of traditional risk factors and biomarkers used in cardiac risk stratification. CAD: Coronary Artery Disease; FAIPVAT: Fat Attenuation Index of Perivascular Adipose Tissue; HU: Hounsfield units.
[0036]FIG. 6 shows mortality and cardiac risk-stratification based on the OxScore. A novel predictive model was constructed based on four imaging indices that were shown to be strong and independent predictors of all-cause and cardiac mortality in multivariable Cox regression analysis (A). These were FAIPVAT, a novel marker of coronary inflammation, fibrous plaque index, a biomarker of soft plaques, calcium index, an imaging index of local calcium deposition in the proximal right coronary artery and finally epicardial adipose tissue (EpAT) volume, an established index of epicardial / visceral adiposity. Based on a logistic regression model, the individual probabilities of all-cause / cardiac mortality were calculated and the study population was subsequently reclassified into risk groups as follows: for all-cause mortality: OxScorehigh: OxScoremid: 5-10%, OxScorelow: <5% (B) and for cardiac mortality: OxScorehigh: 3% versus OxScorelow: <3% (D). Patients in the OxScorehigh group for all-cause mortality had an almost eight times higher risk of death during follow-up compared to the OxScorelow group (C), whereas those in the high-risk group for cardiac-specific mortality, were more than 22 times more likely to die of cardiac causes compared to the low risk group (E). FAIPVAT: Fat Attenuation Index of Perivascular Adipose Tissue; FPi: Fibrous Plaque index; HR: Hazard Ratio; HU: Hounsfield units.
[0037]FIG. 7 compares OxScore against traditional risk factors and cardiac CT measurements. In order to examine the predictive value of OxScore beyond age, gender, traditional cardiovascular risk factors and standard interpretation of a cardiac CT scan (presence of new or previously known coronary artery disease or high Agatston score ≥400), two different models were constructed as follows. Model 1 included age, gender, hypertension (HTN), hypercholesterolemia, diabetes mellitus, active smoker status, presence of coronary artery disease (CAD), Agatston coronary calcium score (CCS), while Model 2 was created by adding the OxScore variables into Model 1. Interestingly, addition of the OxScore variables into the model significantly improved the predictive value for both all-cause and cardiac specific mortality (Δ[AUC]=0.031, P<0.05 for all-cause and Δ[AUC]=0.10, P<0.01 for cardiac mortality) (A, C). Furthermore, addition of the OxScore improved risk classification compared to the standard model, as shown by an NRI index of 7.6% and 11.3% for all-cause and cardiac mortality respectively (B, D). Notably, OxScore appears to predominantly improve reclassification of non-events, suggesting a potential value for this novel risk scoring system in identifying high-risk individuals among those with already present traditional cardiovascular risk factors. AUC: area under the curve; CAD: coronary artery disease; CT: computed tomography; FPi: Fibrous Plaque index; NRI: net reclassification improvement. NS: non significant.

Problems solved by technology

Stable atherosclerotic plaques, which tend to be asymptomatic, are typically rich in extracellular matrix and smooth muscle cells, while unstable plaques are rich in macrophages and foam cells and the extracellular matrix separating the lesion from the arterial lumen (also known as the fibrous cap) is usually weak and prone to rupture.
Ruptures of the fibrous cap eventually induce clot formation in the lumen, and such clots can block arteries or detach, move into the circulation and eventually block smaller downstream vessels causing thromboembolism.
Chronically expanding plaques are frequently asymptomatic until vessel occlusion (stenosis) is severe enough that blood supply to downstream tissue is insufficient.
Indeed, plaque ruptures are also asymptomatic unless they result in sufficient narrowing or closure of an artery that impedes blood flow to different organs so as to induce symptoms.
Atherosclerosis may cause narrowing in the coronary arteries, which are responsible for bringing oxygenated blood to the heart, and this can produce symptoms such as the chest pain of angina, shortness of breath, sweating, nausea, dizziness or light-headedness, breathlessness or palpitations.
Atherosclerosis that causes narrowing in the carotid arteries, which supply blood to the brain and neck, can produce symptoms such as a feeling of weakness, not being able to think straight, difficulty speaking, becoming dizzy and difficulty in walking or standing up straight, blurred vision, numbness of the face, arms, and legs, severe headache and losing consciousness.
However, the current state-of-the-art methods for the diagnosis of vascular inflammation and cardiovascular risk prediction are suboptimal and have several limitations.
Circulating inflammatory biomarkers (e.g. CRP, TNF-α) have a limited value in cardiovascular risk prediction since they are not specific to the cardiovascular system and have poor correlation with local vascular inflammation (see Weintraub et al.
However, coronary calcification represents a non-reversible process that does not change in response to appropriate medical therapy (e.g. statins) (Alexopoulos N et al.
Newer invasive methods such as optical coherence tomography (OCT) and intravascular ultrasound (IVUS) have been more successful in detecting high-risk plaques but are invasive, expensive, carry a small yet significant risk of in-procedure complications (Bezerra H G et al.
Positron emission tomography (PET) with 18F-FDG is expensive, associated with significantly higher levels of radiation exposure compared to CT alone, not readily available and limited by myocardial uptake of the radiotracer that results in significant background noise (Joshi N V et al.
Even the introduction of newer radiotracers (such as 18F-NaF), although promising, carries many of the limitations of traditional PET imaging, including but not limited to significant radiation exposure, limited availability and no demonstrated value in primary or even secondary prevention (Joshi N V et al.

Method used


Image

  • Method
  • Method
  • Method

Examples


example

Methods

Patients

[0111]In this prospective study, a cohort of 1993 subjects was recruited prospectively between 2005 and 2009, following a clinically indicated CTA performed at the Erlangen University Hospital (Erlangen, Germany). A total of 1872 subjects had analysable CTA scans and were included in the study. The vast majority of the scans were performed for exclusion of coronary artery disease (CAD) (91.7%). Most of the patients had presented with atypical symptoms (85.3%) and less than half had a history of chest pain (43.4%). A minority of the scans (3.8%) was performed in patients with previously known CAD to evaluate possible disease progression (3.7%) or the patency status of a vascular graft (0.1%). Following the baseline CT scan, only a small proportion of the cohort was diagnosed with obstructive CAD (21.6%). The patient demographics and clinical characteristics of the studied population are summarized in Table 1.

TABLE 1Cohort demographics and clinical characteristicsof the...


PUM


Abstract

The present invention describes a new functional biomarker of vascular inflammation and its use in predicting all-cause or cardiac mortality. The invention also provides a method for stratifying patients according to their risk of all-cause or cardiac mortality using data gathered from a computer tomography scans of a blood vessel to determine a specific combination of structural and functional biomarkers of vascular inflammation and disease.

Description

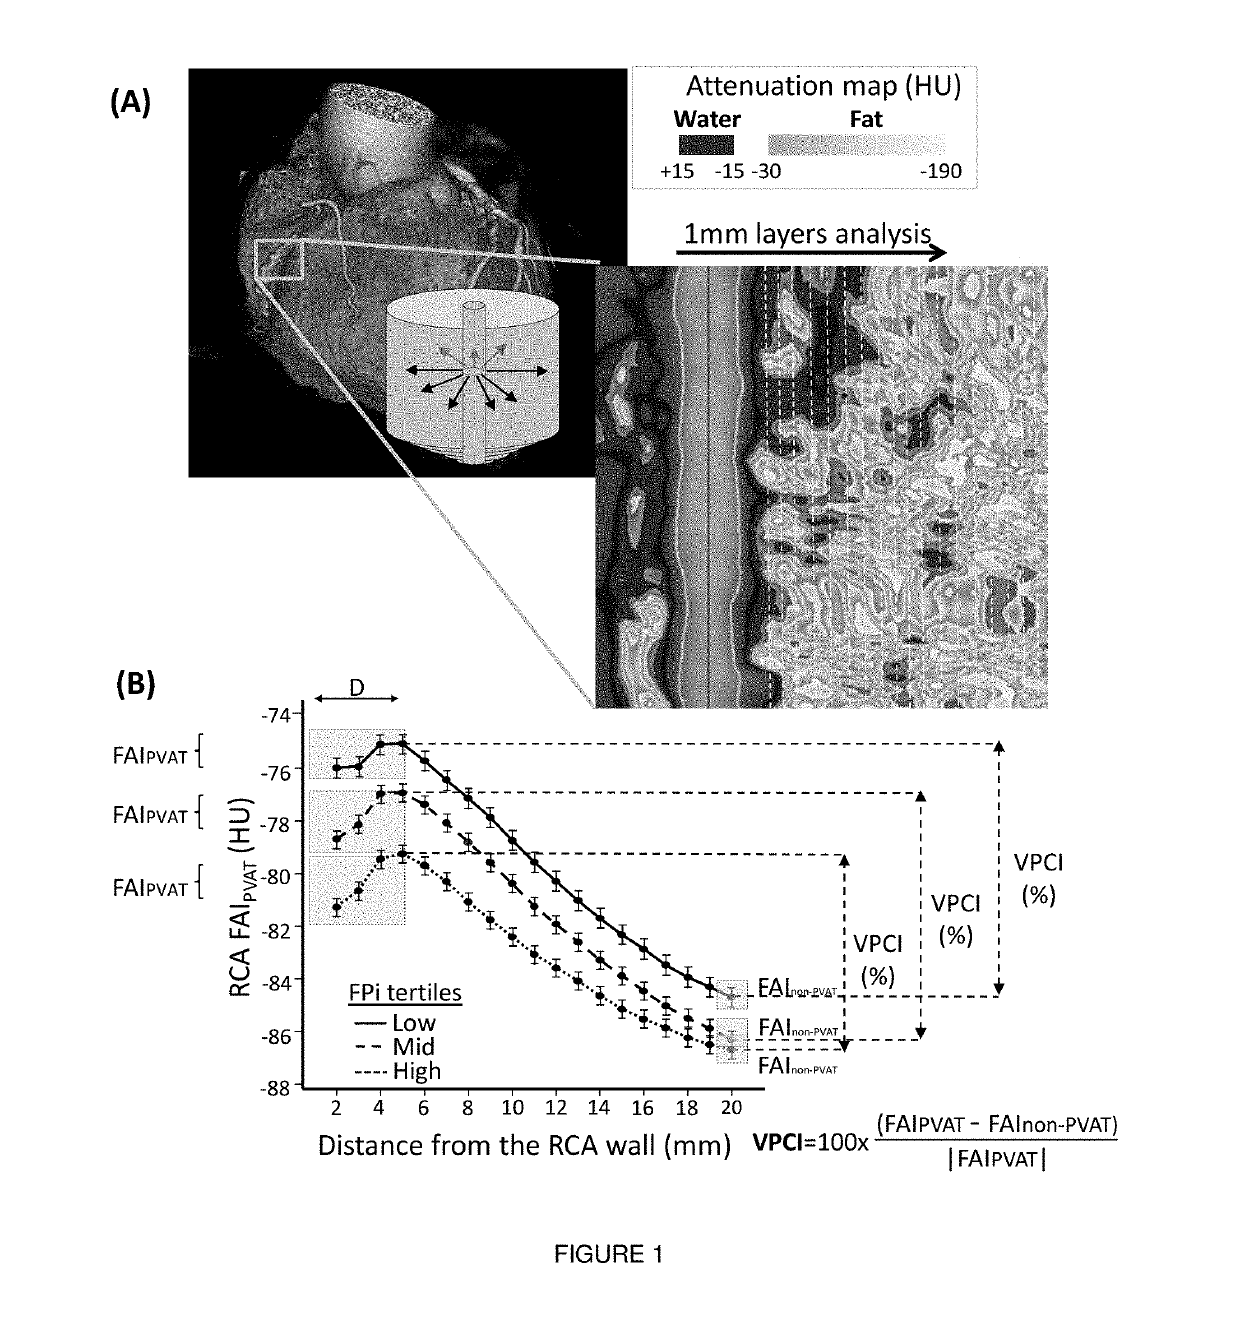
FIELD OF THE INVENTION[0001]The present invention relates to novel biomarkers of cardiovascular risk and methods for predicting all-cause mortality and cardiac events, including cardiac mortality.BACKGROUND OF THE INVENTION[0002]Atherosclerosis is a progressive process in which an artery wall thickens as a result of invasion and accumulation of white blood cells. This inflammatory process results in plaques within the vessel wall containing living white blood cells, dead cell debris and fatty deposits including cholesterol and triglycerides.[0003]Stable atherosclerotic plaques, which tend to be asymptomatic, are typically rich in extracellular matrix and smooth muscle cells, while unstable plaques are rich in macrophages and foam cells and the extracellular matrix separating the lesion from the arterial lumen (also known as the fibrous cap) is usually weak and prone to rupture. Ruptures of the fibrous cap eventually induce clot formation in the lumen, and such clots can block arteri...

Claims


Application Information

Patent Timeline
Patent Type & Authority Applications(United States)
IPC IPC(8): G06T11/00G06T7/00G16H30/40G16H50/30G06T7/62A61B6/03A61B6/00
CPCG06T2207/30101G16H30/40G16H50/30G06T2207/10081G06T7/62G06T11/008G06T7/0012A61B6/032A61B6/5217A61B6/504G06T2207/30048Y02A90/10
Inventor ANTONIADES, CHARALAMBOSCHANNON, KEITHOIKONOMOU, EVANGELOSNEUBAUER, STEFAN
Owner OXFORD UNIV INNOVATION LTD
Why Eureka
Try Eureka