
Data Transformation System, Graphical Mapping Tool And Method For Creating A Schema Map

a schema map and data transformation technology, applied in the field of data transformation, can solve the problems of not being portable, difficult to adapt to new or changing circumstances, and high implementation costs of custom-coded solutions and customized tools,

Inactive Publication Date: 2016-11-03
ACTIAN CORP
View PDF5 Cites 37 Cited by
  • Summary
  • Abstract
  • Description
  • Claims
  • Application Information

AI Technical Summary

Benefits of technology

[0024]In some embodiments, mini-maps may be created to perform lookup operations or to temporarily store sets of records from the previously added primary or secondary sources. In addition, mini-maps may be created to facilitate other types of intermediate targets and advanced mapping features, such as aggregation, pivot / unpivot operations, and synthetic key generation. The use of mini-maps provides a mechanism to make complex schema maps modular, thus, simplifying the process of building complex schema maps. In some embodiments, mini-maps may be defined independently of a schema map, so that a mini-map can be reused in the same schema map or included within a library of mini-maps for use within other schema maps.
[0038]In some embodiments, the graphical mapping interface may be configured for creating a schema map, which supports mappings between a plurality of source schemas and a plurality of target schemas. In some embodiments, the plurality of source schemas and the plurality of target schemas may comprise one or more different types of schemas. Examples of the different types of schemas that may be included within the source and / or target schema regions include single mode, multi-mode, multi-record, flat and hierarchical schema types. The ability to support all schema types within a single graphical mapping interface provides a significant advantage over conventional mapping tools.
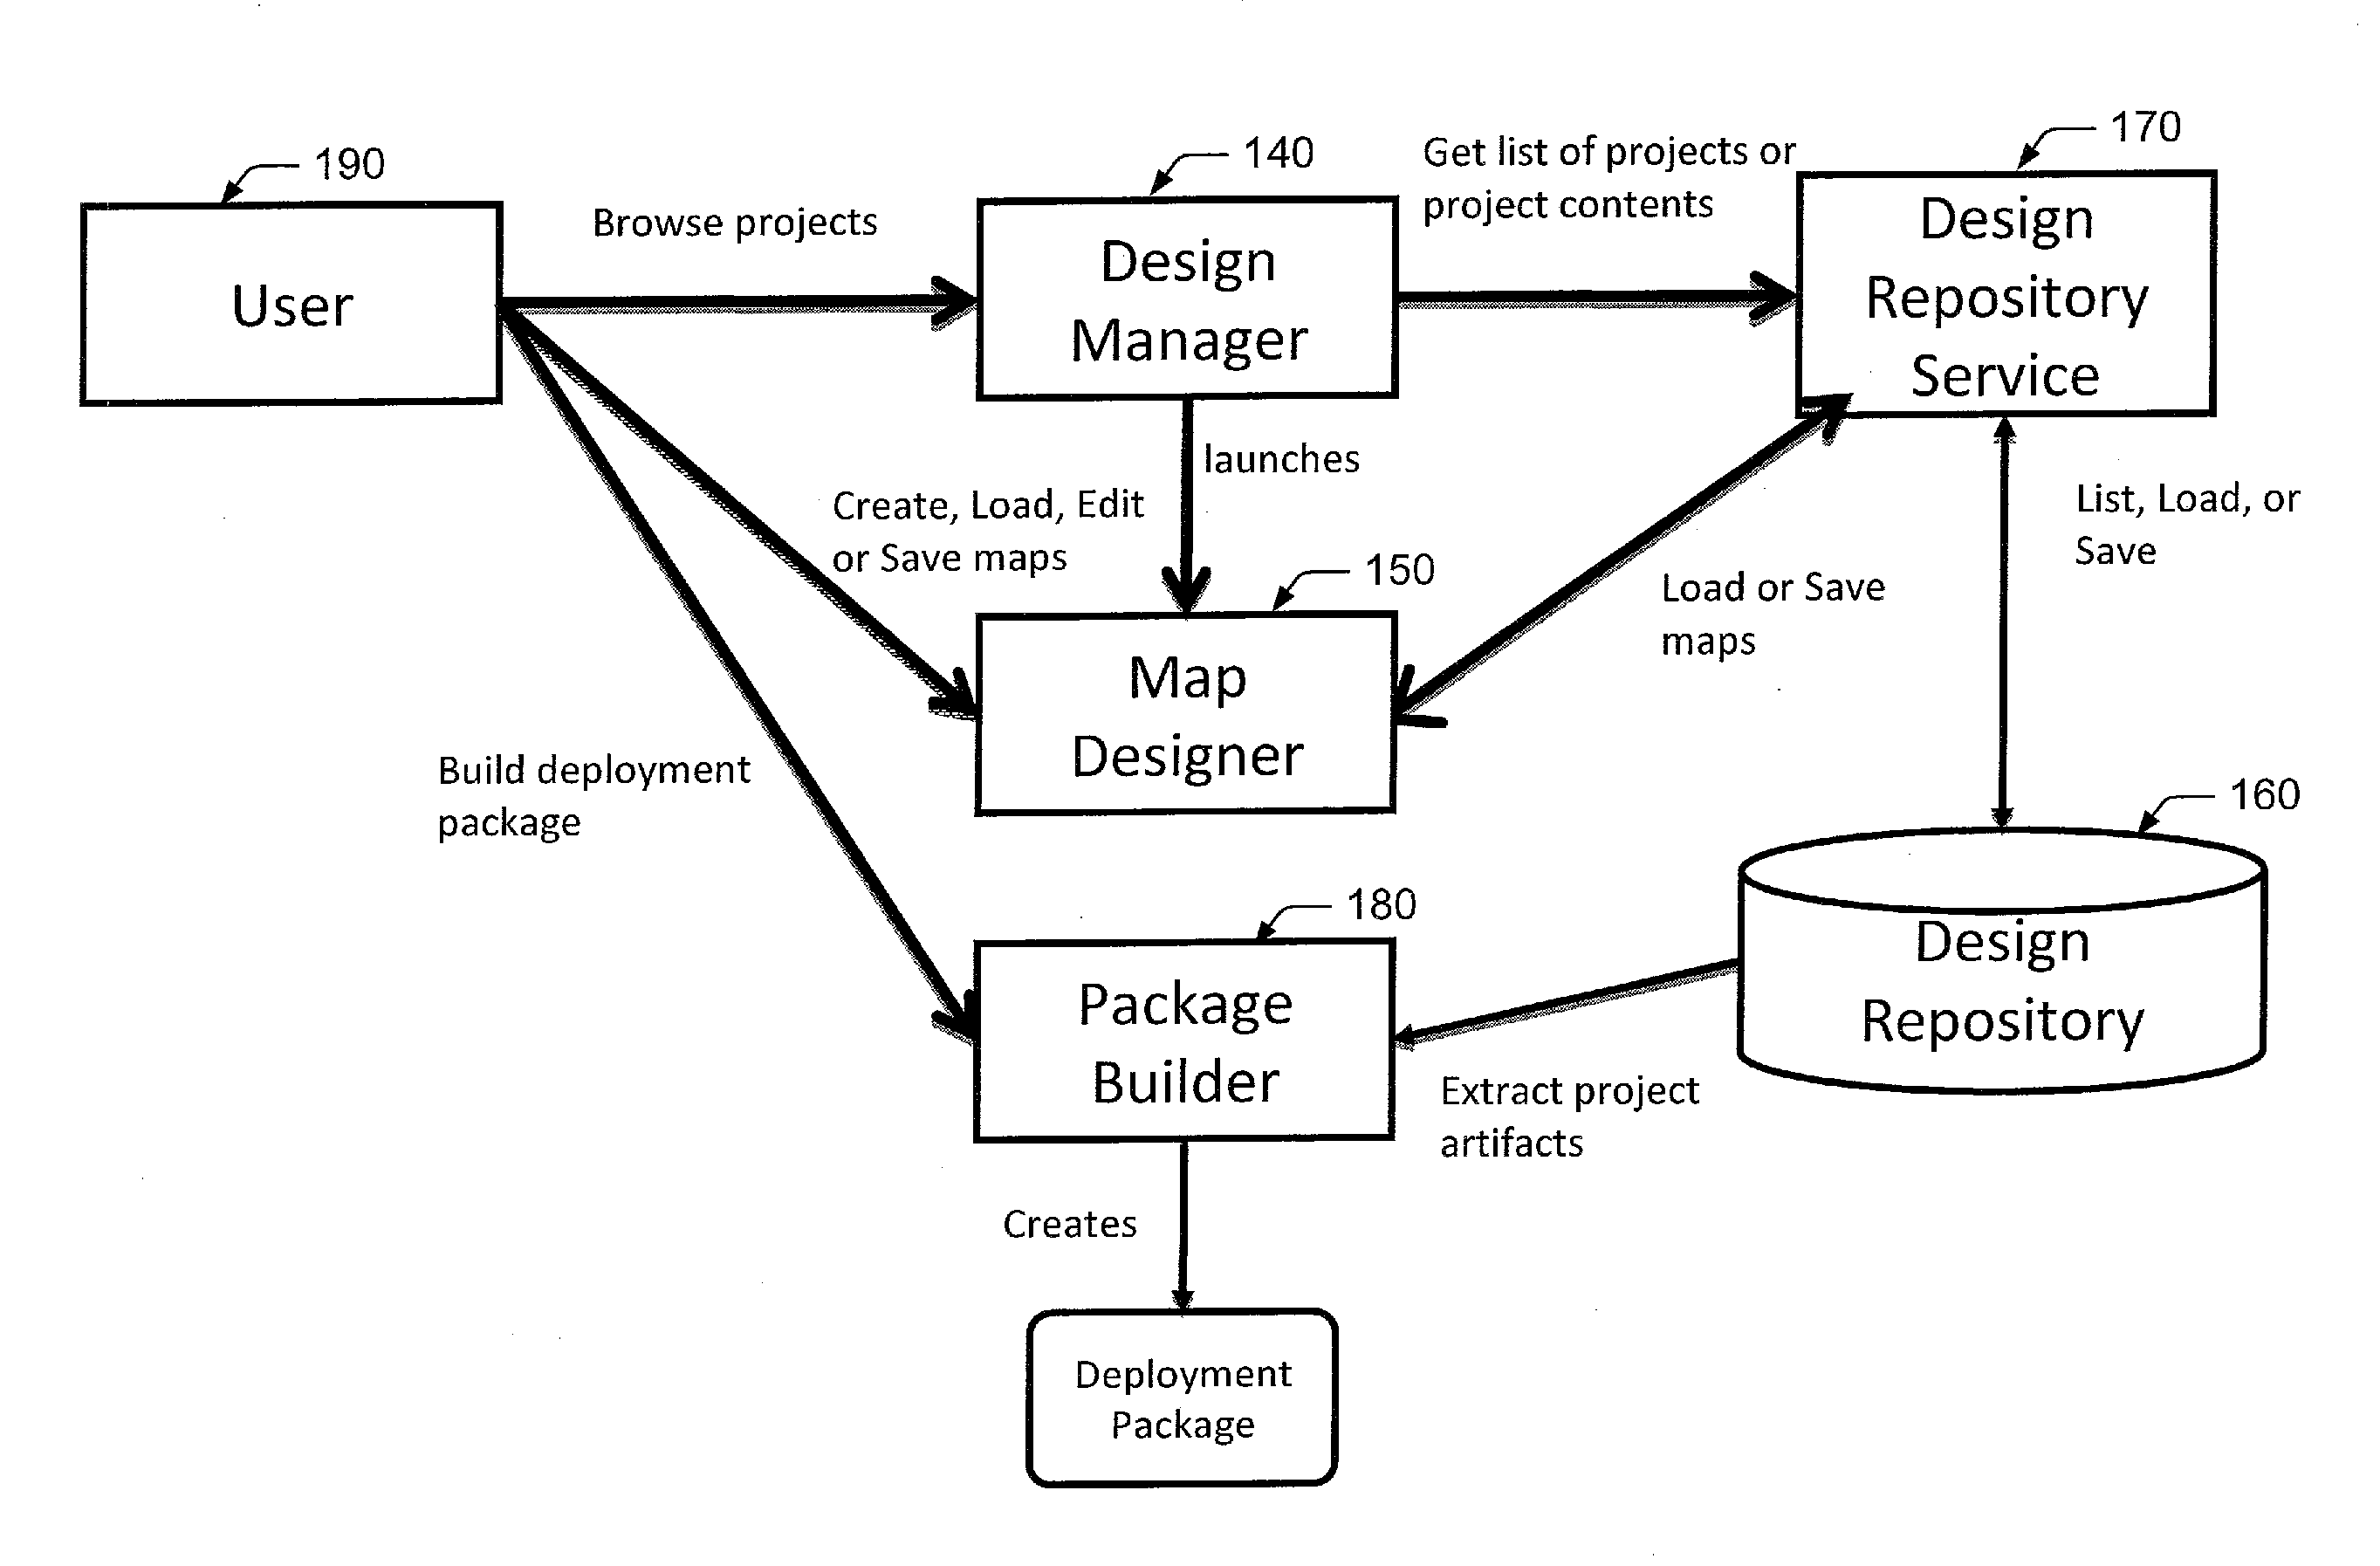
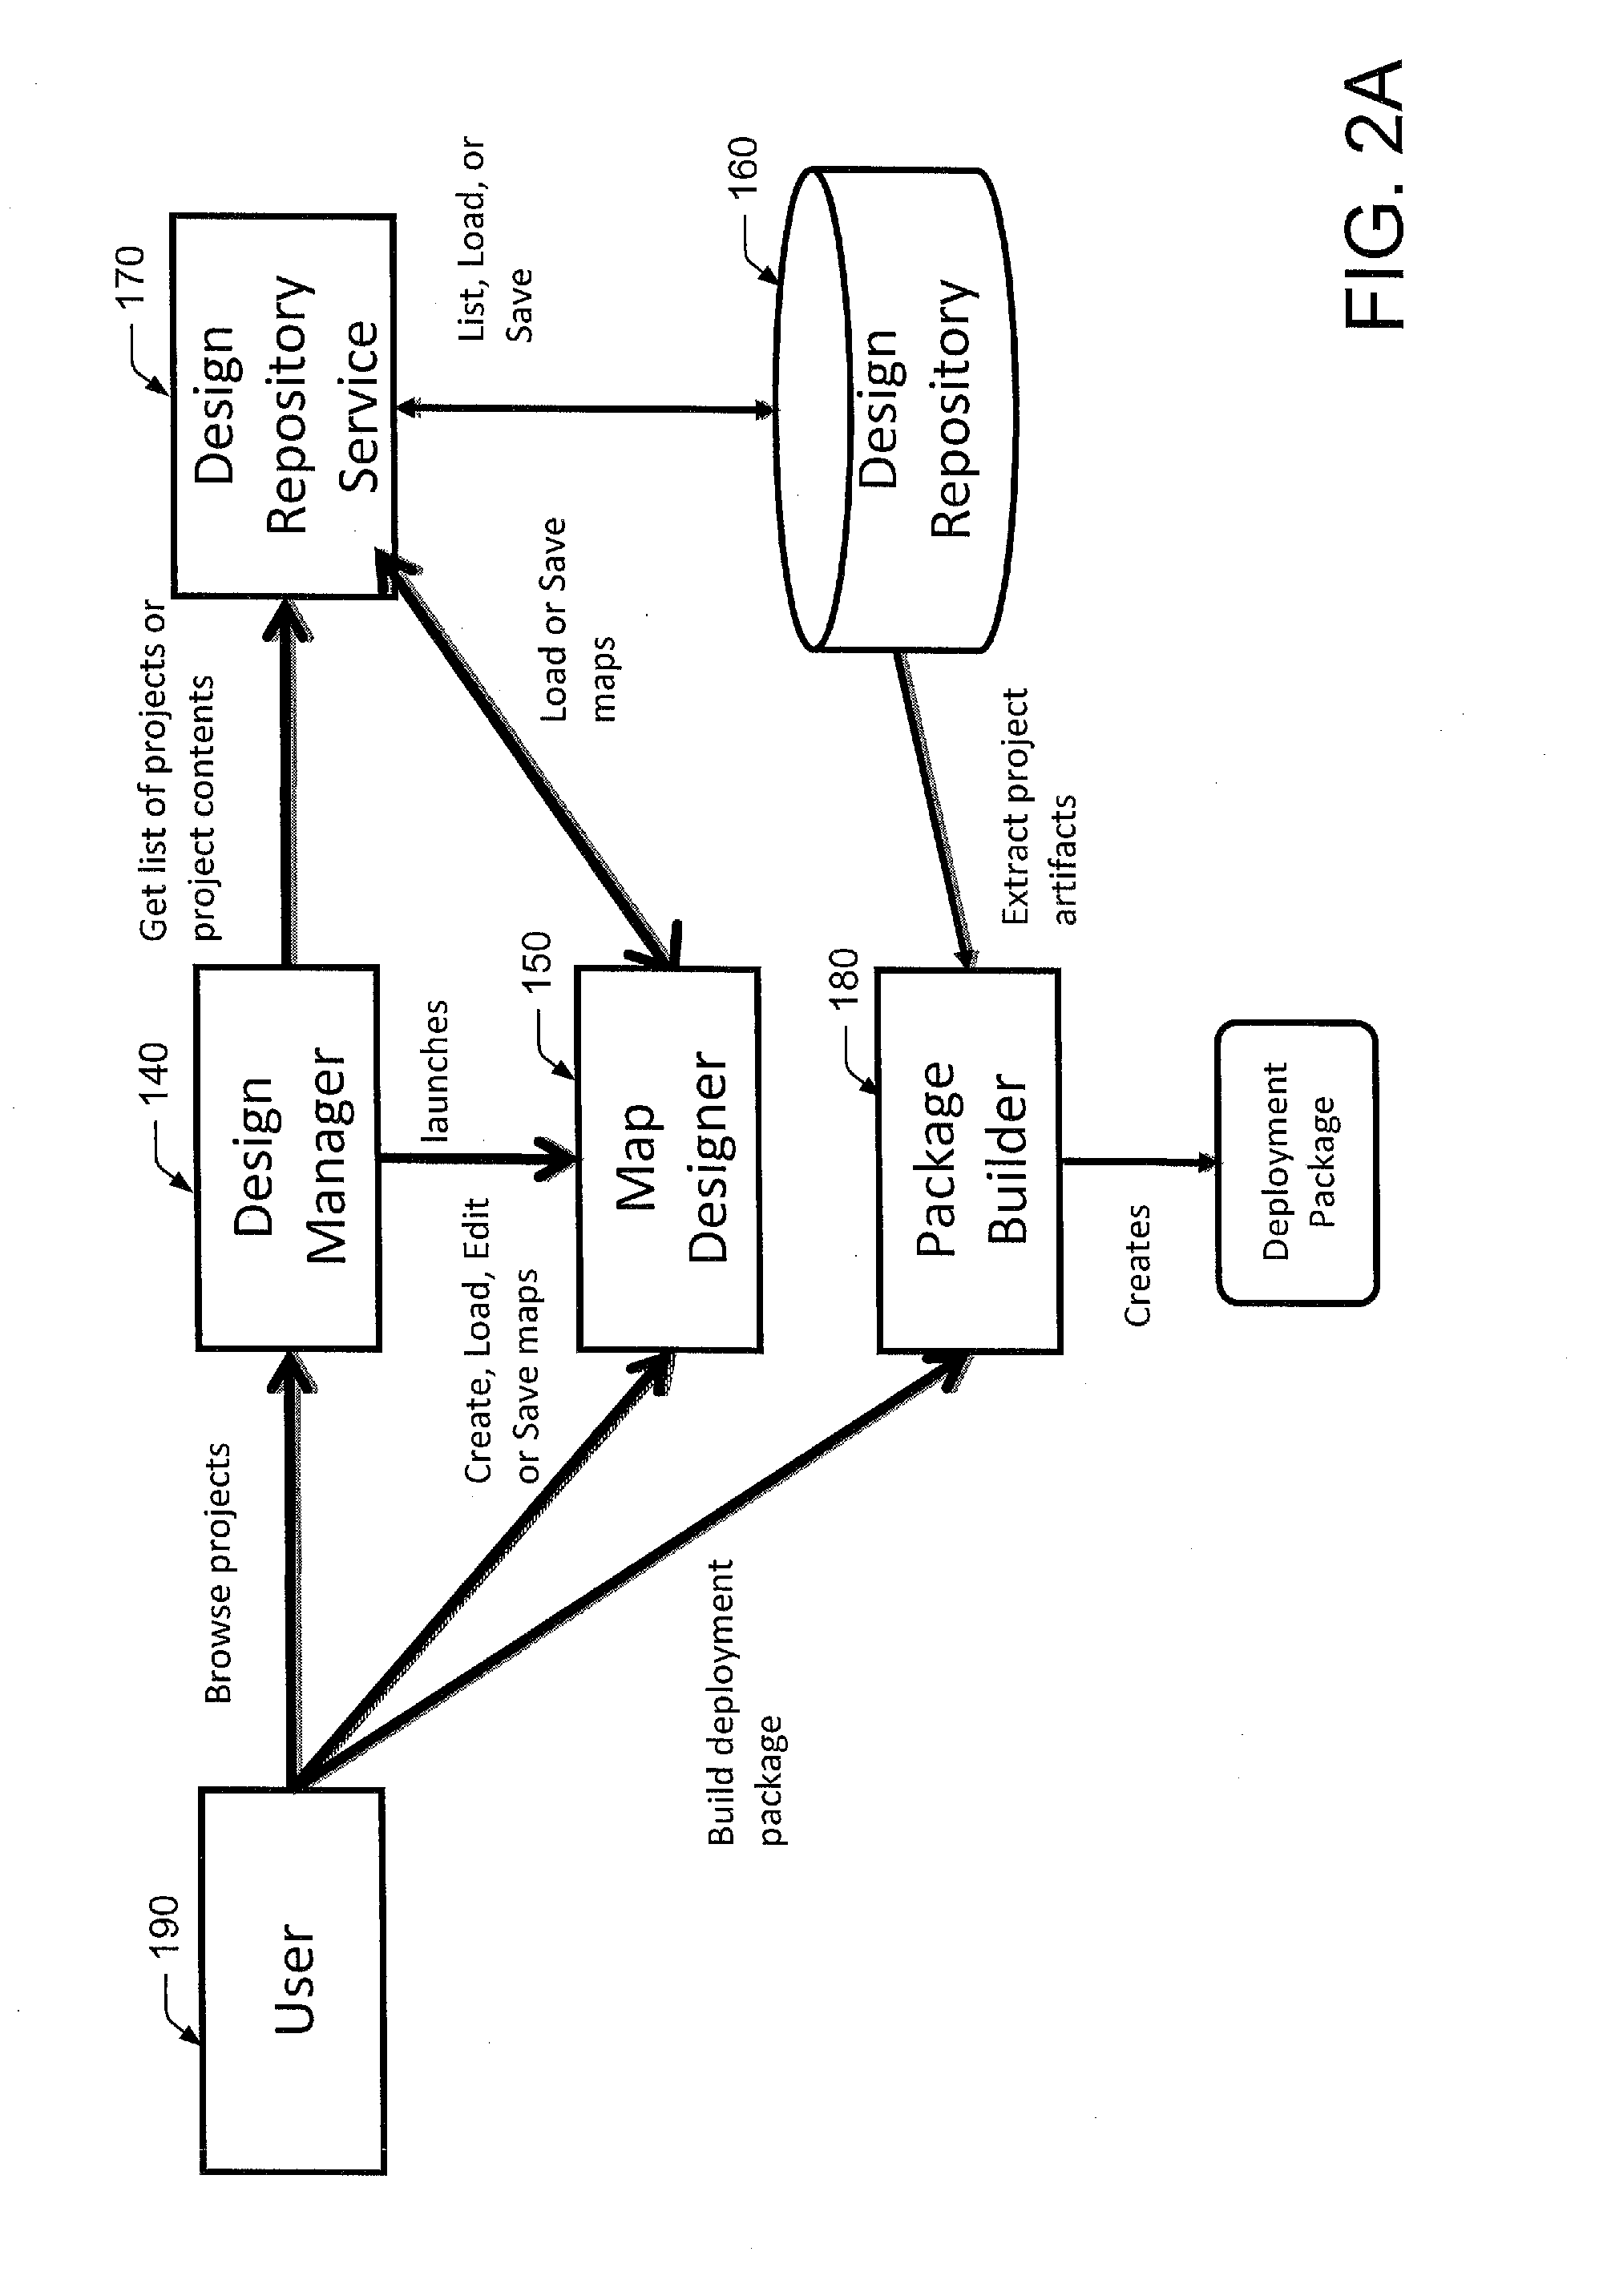
[0042]The design repository may be configured for storing a schema map and other artifacts associated with a project. The design repository service may be configured for accessing the schema map and artifacts stored within the design repository. In one embodiment, the design repository service may be implemented as web-service, such as a RESTful Web service. Implementing the design repository service as a web service allows multiple users to access the design repository from various locations via any internet browser using HTTP or HTTPS protocols. The design repository service thereby provides an easy method for accessing and sharing designs, such as schema maps. The package builder may be coupled for extracting the schema map from the design repository and configured for packaging the schema map, along with other project artifacts, into a deployment package. In addition to providing a single container for all project artifacts, the package builder described herein allows moving / sharing of entire projects via a file system, and in some embodiments, enables deployment packages to be distributed to remote processing nodes.

Problems solved by technology

However, building successful e-commerce systems presents many challenges to the system architect, as each company may store data and documents in different formats.
Custom-coded solutions and customized tools are generally expensive to implement, are not portable, and are difficult to adapt to new or changing circumstances.
Off-the-shelf products also tend to be costly, have steep learning curves and usually require system developers to create code for mapping input data to output data.
Regardless of the particular solution chosen, the process of transforming data becomes increasingly complicated with each increase in the number of data sources, the number of data targets, the content of the data sources / targets, the format of the data sources / targets, and the complexity of the corresponding data structures.
However, defining an XSL style sheet can be difficult, especially for complex schemas and mappings.
Whether the mapping code is written in XSL or another transformation language, writing this code is difficult, time consuming and typically beyond the capabilities of ordinary business personnel.
However, graphical mapping tools of this sort have many limitations.
First of all, large schema mappings are difficult to represent graphically in functoid-based graphical mapping tools, as the use of functoids creates congestion in the mapping area.
This may further increase congestion by requiring various links and functoids to be replicated if a source element is to be mapped to multiple target elements, as is often the case when mapping hierarchical data structures.
Moreover, the mapping region in functoid-based mapping tools does not specify relationships between source and target elements, making it difficult to relate any given target with its corresponding source.
Finally, while functoids graphically represent the rules used to transform a source schema into a target schema, they cannot be used to initiate or control transformations, which are dependent on the occurrence of a particular event (i.e., event-driven transformations).

Method used


Image

  • Data Transformation System, Graphical Mapping Tool And Method For Creating A Schema Map
  • Data Transformation System, Graphical Mapping Tool And Method For Creating A Schema Map
  • Data Transformation System, Graphical Mapping Tool And Method For Creating A Schema Map

Examples


example 1

A Simple Copy Operation

[0222]A common case with data integration is where data is copied between similar types of systems. For example, product information may be periodically copied from an accounting system to a CRM system. In these cases, the objects in the source and target schemas will often have similar structures and the mappings between the objects will be fairly simple.

[0223]In the example map shown in FIG. 18, we use sample company databases from two products. The first is the Northwind Traders database shipped with the Microsoft SQL Server and Microsoft Access products. The second is the Classic Model Corporation database, which is used as a sample database for the Eclipse Business Intelligence and Reporting Tool (BIRT).

[0224]The map is very simple. There is one control link (Link 1), which is used to control the iteration over the records in the source data set and to control the generation of output records to the target data set. All other links (Links 2-11) are used f...

example 2

A Simple Aggregate Operation

[0236]A common operation in data warehousing projects is the aggregation of source data. The scenario shown in FIG. 19 looks at a simple aggregation use case. In this case, Order Detail information from a source database is used to compute records wherein the total order amount is calculated for each order. The assumption is that the source data is sorted by order number.

[0237]This map is also very simple and includes only one control link (Link 1) to control the iteration over the records in the source data set and to control the generation of output records to the target data set. All other links (Links 2, 3a and 3b) are for mapping the source fields to the target fields. There is one target field (orderTotal) where the value is derived from values in two source fields (quantityOrder and priceEach).

[0238]Link 1 is the only control link in the map. To perform the aggregation, two EA (unconditional ECA) rules are used, one EA rule for aggregating values a...

example 3

A Multi-Mode Operation

[0241]Multi-mode targets support multiple types of output operations on one or more target objects. These operations include insert (default), delete, update and upsert. In multi-mode, each output record is assigned an output operation and a target name. This is achieved, in one embodiment, by binding each record type in the target schema to a specific output operation and target object. To select an operation other than the default insert, keys must be defined for matching the records to be deleted, updated or upserted.

[0242]The schema map of FIG. 20 demonstrates an exemplary multi-mode output operation for a source schema representing the structure of the Invoice Data query. We assume that the input data is sorted by Order ID. For any given Order ID, the source dataset includes one or more records determined by the number of order details. The schema map of FIG. 20 generates output for two different tables in the target data set: one Order record for each uni...


PUM


Abstract

Embodiments of a graphical mapping interface and method are provided herein for creating and displaying a schema map, which may be used by a data transformation system to perform a data transformation between at least one source schema and at least one target schema. According to one embodiment, the graphical mapping interface may generally comprise a main map window and a mini-map window. The main map window comprises a source schema region, which is adapted for displaying a graphical representation of a primary source schema defining a structure of a primary data source. The mini-map window is adapted for creating a mapping between one or more nodes of the primary source schema and one or more nodes of an intermediate target schema, and displaying a graphical representation of the mapping within the mini-map window. Upon closing the mini-map window, a graphical representation of the intermediate target schema is displayed in the source schema region of the main map window and accessible for mapping within the main map window.

Description

PRIORITY CLAIM[0001]This application is a continuation of U.S. patent application Ser. No. 13 / 288,435, filed on Nov. 3, 2011 and entitled “Data Transformation System, Graphical Mapping Tool and Method for Creating a Schema Map”.BACKGROUND OF THE INVENTION[0002]1. Field of the Invention[0003]This invention relates to data transformation and, more particularly, to an improved schema mapping language and graphical mapping tool, which is suitable for use within an event-driven data transformation system.[0004]2. Description of the Related Art[0005]The following descriptions and examples are given as background only.[0006]Databases play an integral role in the information systems of most major organizations, and may take many forms, such as mailing lists, accounting spreadsheets, and statistical sales projections. After using several generations of technology, an organization having data stored in many different systems and formats may wish to combine or integrate their disparate data in...

Claims


Application Information

Patent Timeline
Patent Type & Authority Applications(United States)
IPC IPC(8): G06F17/30
CPCG06F17/30557G06F17/30292G06F2203/04803G06F16/25G06F3/048G06F15/16G06F16/211
Inventor DINGMAN, PAUL C.BUNTON, WILLIAM G.VAN DYKEN, KATHRYN E.YOGMAN, LAURENCE T.ZHANG, YIMIN
Owner ACTIAN CORP
Learn More