Evaluation of spectra
a spectra and spectrometer technology, applied in the field of spectra evaluation, can solve the problems of limited structural determination by nuclear magnetic resonance (nmr) spectroscopy, dramatic affect on protein solubility,
- Summary
- Abstract
- Description
- Claims
- Application Information
AI Technical Summary
Benefits of technology
Problems solved by technology
Method used
Image
Examples
example 1
Protein Purification of 15N Labeled Polypeptides
[0124] The cells, harboring a plasmid each with a nucleic acid encoding a polypeptide of the invention, are inoculated into 2 L of M9 minimal media (containing 15N isotope, 0.48 g / L 15NH4Cl) in a 6 L Erlenmeyer flask. The minimal media is supplemented with 0.01 mM ZnSO4, 0.1 mM CaCl2, 1 mM MgSO4, 5 mg / L Thiamine.HCl, and 0.4% glucose. The 2 L culture is grown at 37° C. and 200 rpm to an OD600 of between 0.7-0.8. The cultures are then induced with 0.5 mM IPTG in each culture and allowed to shake at 15° C. for 14 hours. The cells are harvested by centrifugation and the cell pellets are resuspended in 15 mL cold binding buffer each and 100 μl of protease inhibitor and flash frozen. The protein is then purified as described below from each of resuspended pellets.
[0125] Alternatively, the freshly transformed cells, harboring a plasmid each with the gene of interest, is inoculated into 10 mL of M9 media (with 15N isotope) and supplemented ...
example 2
Acquisition of HSQC NMR Spectra on Multiple Proteins
[0130] NMR experiments were performed on a Bruker Avance 600-MHz spectrometer equipped with a 5-mm triple-resonance cryo-probe head at 298 K. NMR samples were typically prepared in 500 μl of 90% H2O-10% D2O buffer containing 500 mM NaCl, 10 mM HEPES buffer at pH 7.5 (pH reading is not corrected for isotopic effects). The two dimensional (1H, 15N)HSQC experiments were acquired using the pulse sequence described by Davis et al. (J. Magn. Reson. 98: 207-216 (1992)), Grzesiek and Bax (J. Am. Chem. Soc. 115: 12593-12594 (1993)) with water suppression by flip-back pulses. The sweep width was 14 ppm and 45 ppm in the 1H and 15N dimensions, respectively. The 1H carrier was set at 600.1324 MHz, while the 15N carrier at 60.1778 MHz. The size of the HSQC spectra gave a 1024×128 real data matrix. The spectra were processed on a Ultra 5 computer from SUN Microsystems using NMRPipe software (Delaglio et al., J. Biomol. NMR 6: 277-293 (1995)).
example 3
Manual Categorization of HSQC NMR Spectra of the Training Set
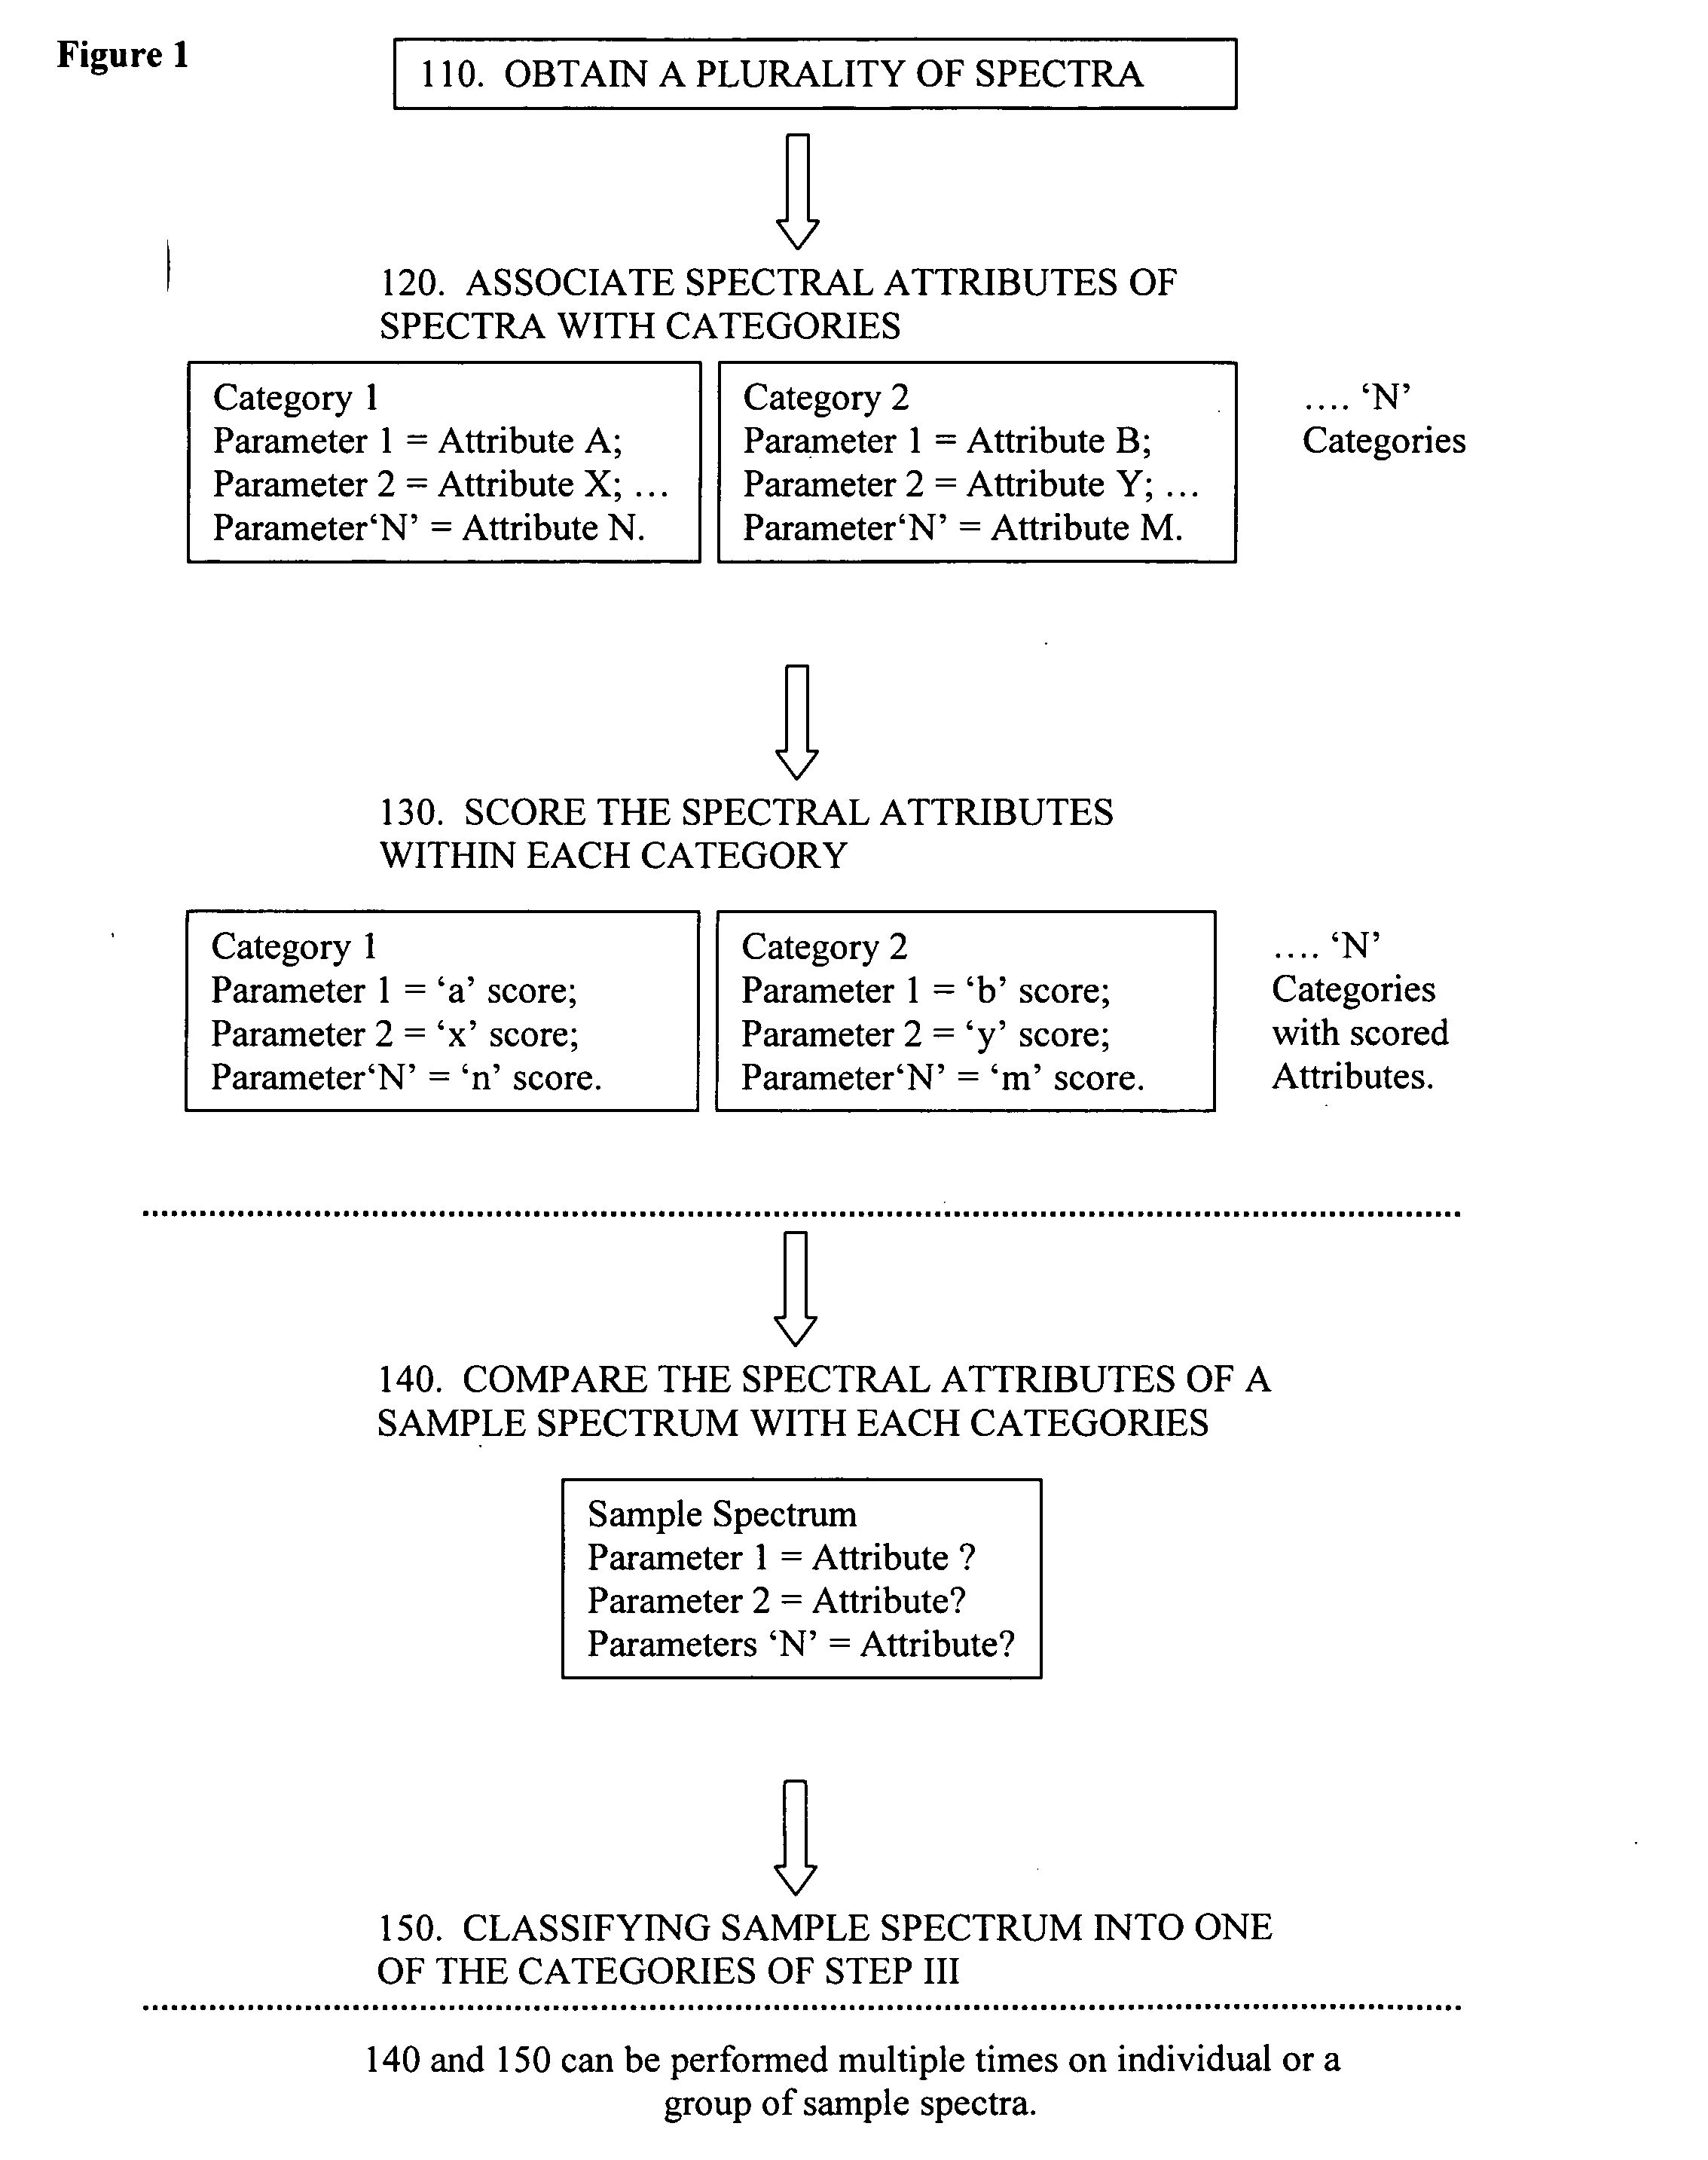
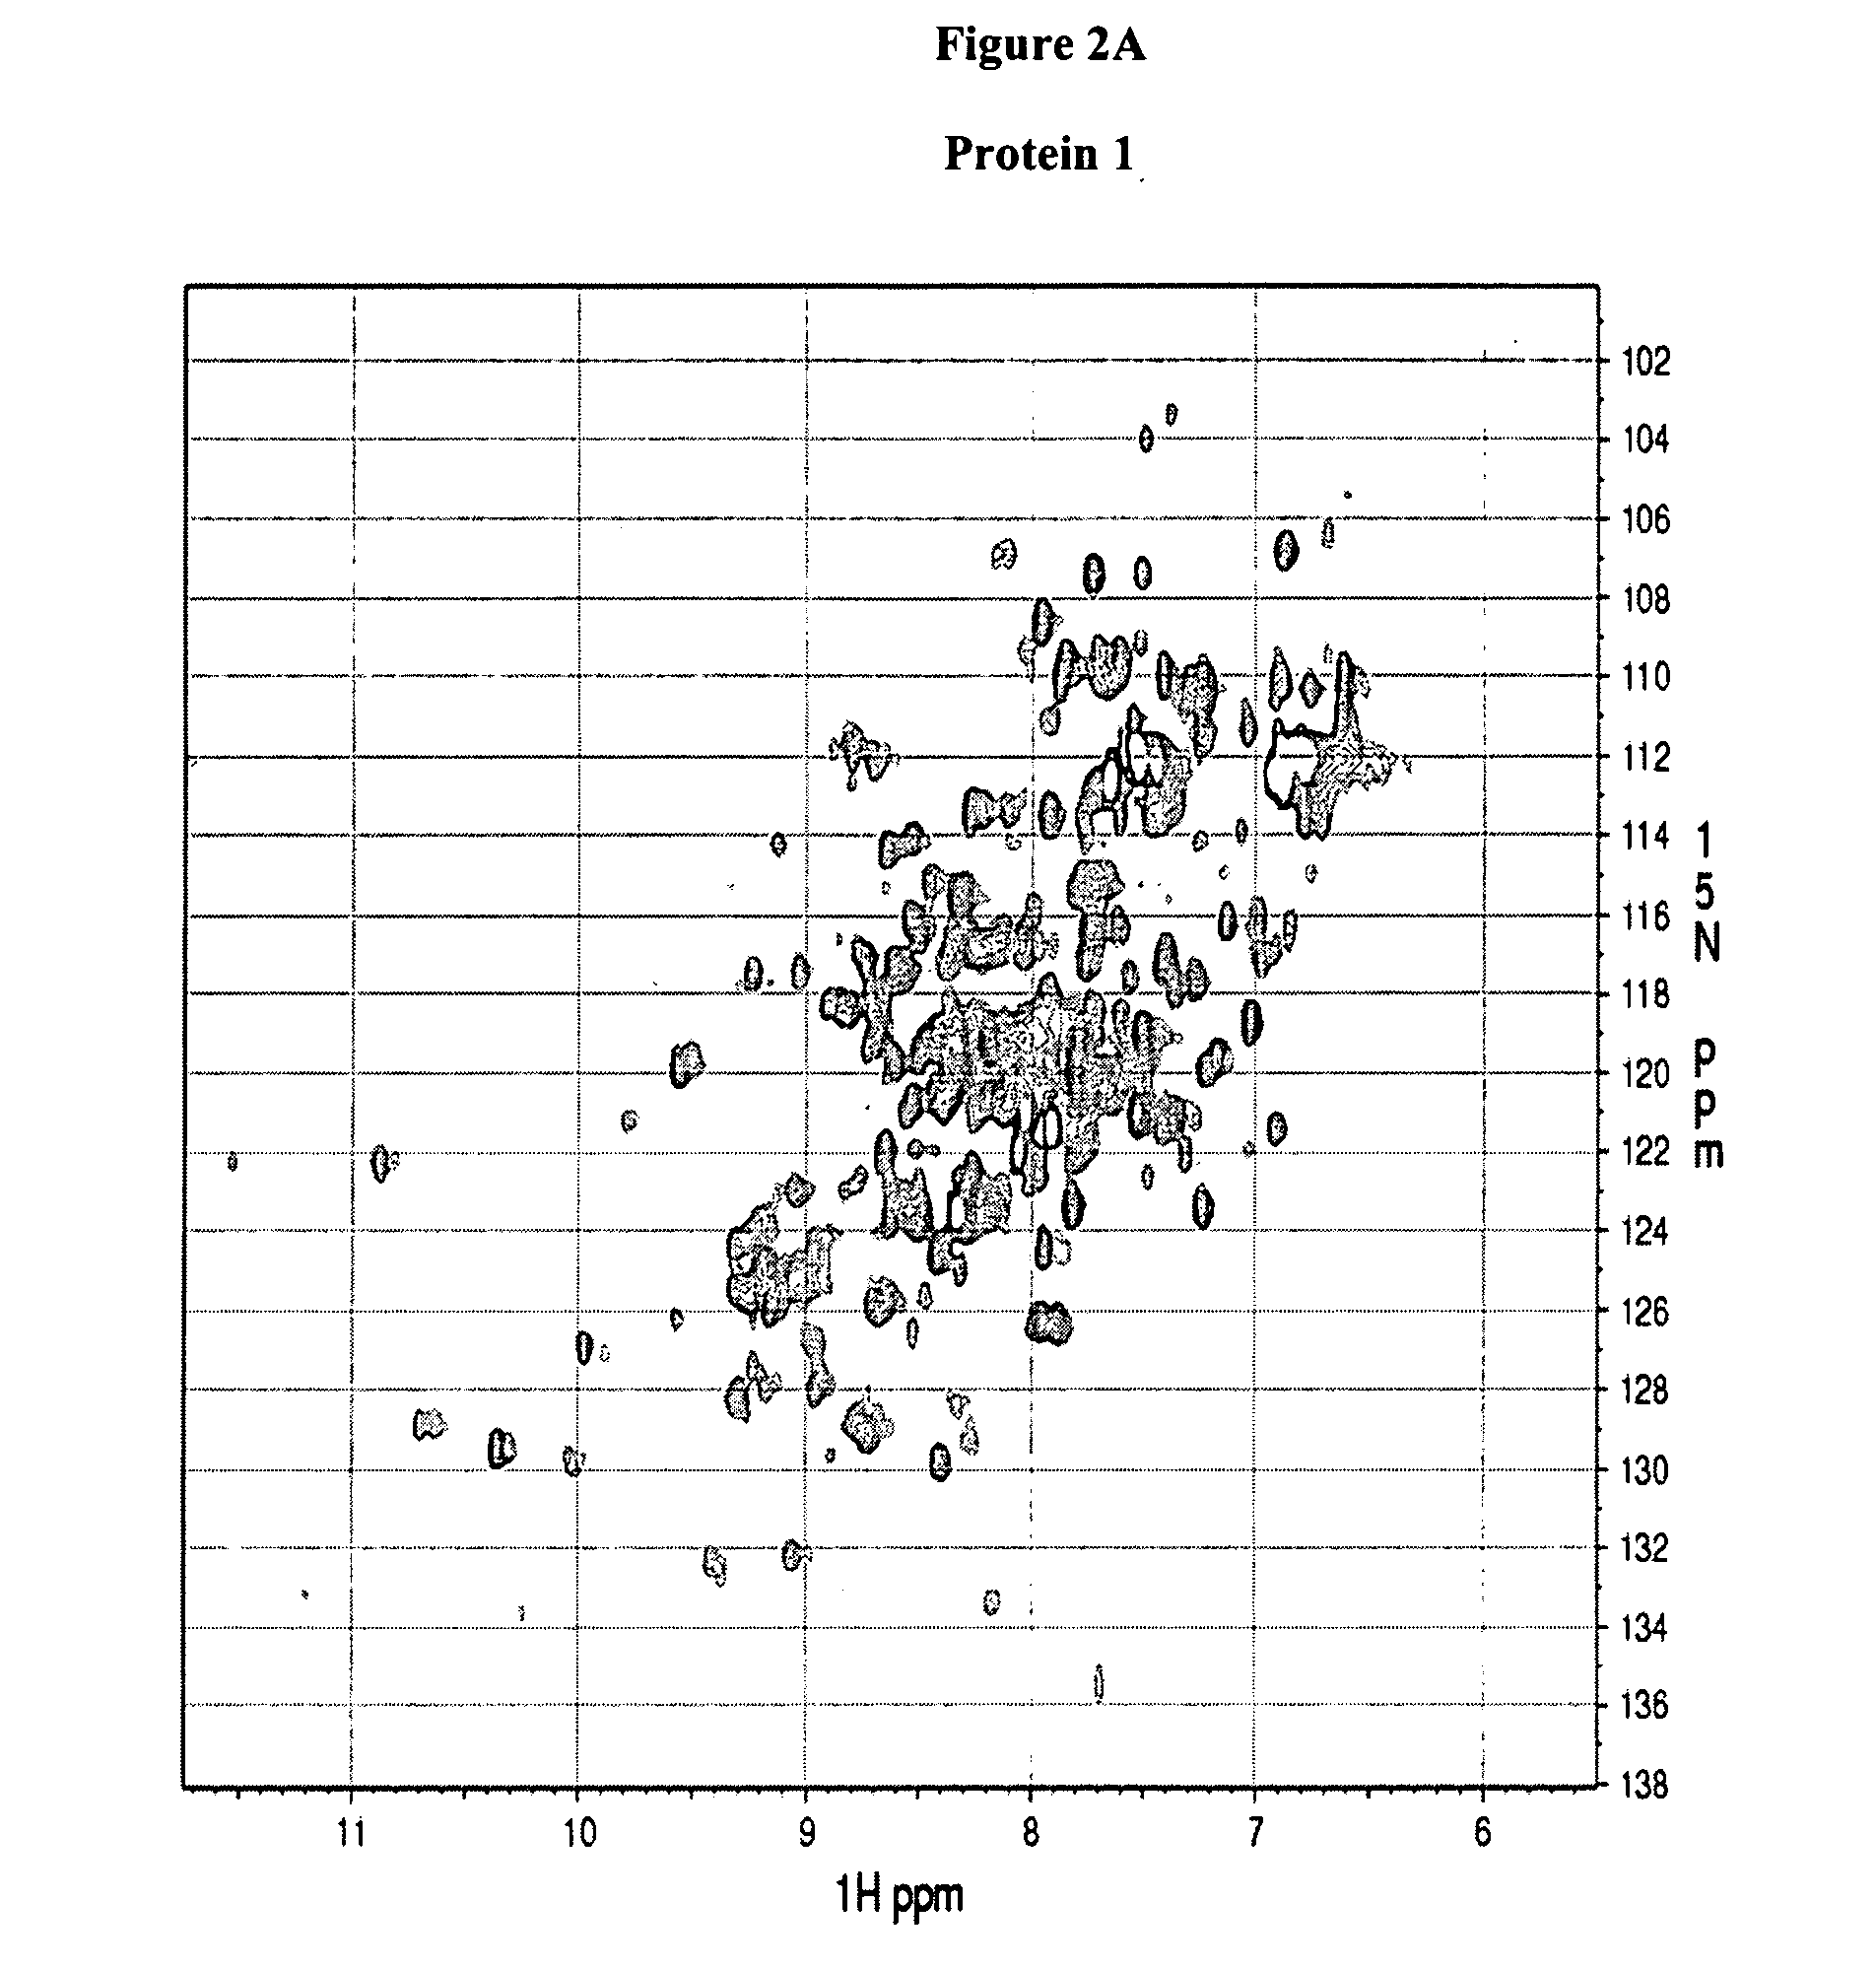
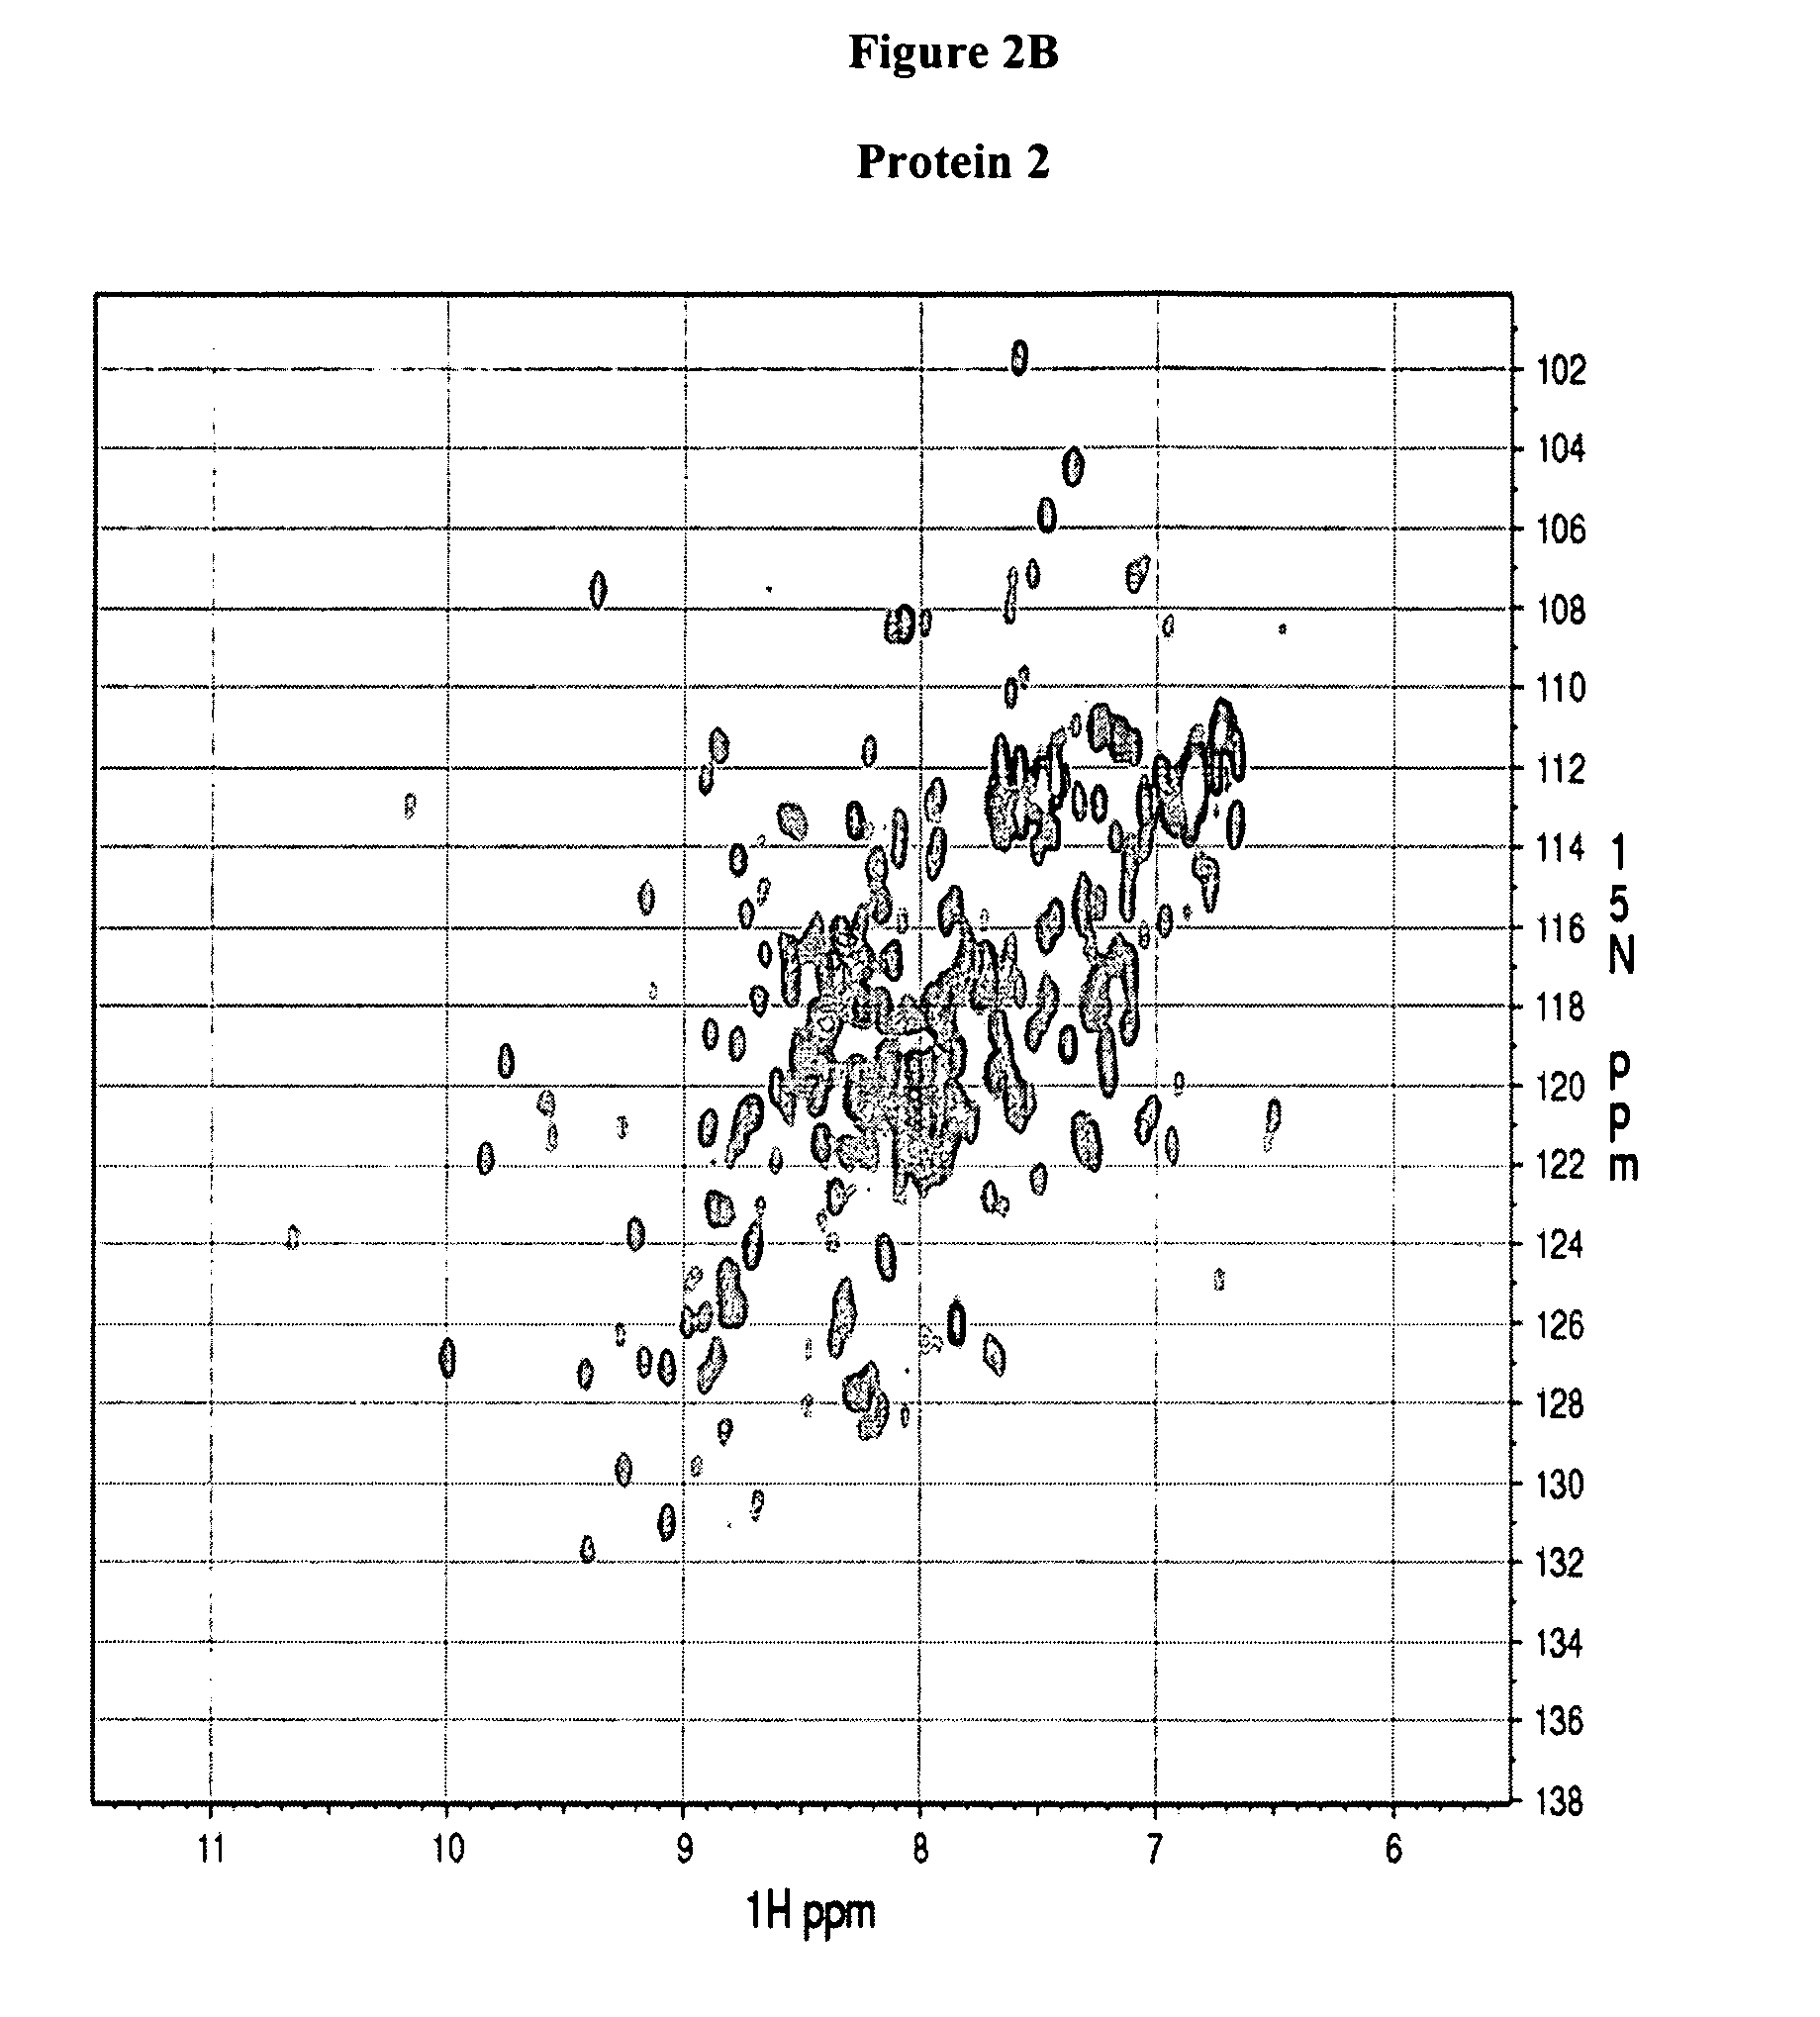
[0131] The protein spectra obtained in Example 2 (FIG. 2) are associated with one of the following four categories: (a) good, Protein 1 and 2, (b) promising, Protein 3 and 4, (c) unfolded, protein 5 and 6, and (d) poor, Protein 7 and 8. The association takes into account the chemical shift dispersion in both proton and nitrogen dimension, intensity and line-width of the peaks and number of peaks observed versus the number of peaks expected which equals the number of non-proline residues in the protein (excluding side chain NH2 groups). Typically, a 1H chemical shift range from 5.5 to 12 ppm and a 15N chemical shift range from 98 to 140 ppm is considered.
TABLE 1HSQC spectra ofClassificationProtein 1GoodProtein 2GoodProtein 3PromisingProtein 4PromisingProtein 5UnfoldedProtein 6UnfoldedProtein 7PoorProtein 8Poor
PUM
| Property | Measurement | Unit |
|---|---|---|
| temperature | aaaaa | aaaaa |
| pH | aaaaa | aaaaa |
| pH | aaaaa | aaaaa |
Abstract
Description
Claims
Application Information
 - R&D
- Intellectual Property
- Life Sciences
- Materials
- Tech Scout
- Unparalleled Data Quality
- Higher Quality Content
- 60% Fewer Hallucinations
Browse by: Latest US Patents, China's latest patents, Technical Efficacy Thesaurus, Application Domain, Technology Topic, Popular Technical Reports.
© 2025 PatSnap. All rights reserved.Legal|Privacy policy|Modern Slavery Act Transparency Statement|Sitemap|About US| Contact US: help@patsnap.com


