
Method of hemoglobin correction due to temperature variation

a temperature variation and hemoglobin technology, applied in the field of hematology, can solve the problems of not being able to wait, not being able to produce chromogen, and not being able to avoid sensitivity to the environmen

Inactive Publication Date: 2007-03-08
BECKMAN COULTER INC
View PDF8 Cites 26 Cited by
  • Summary
  • Abstract
  • Description
  • Claims
  • Application Information

AI Technical Summary

Problems solved by technology

One important reason for this is that the chromogen produced by the reaction of the diluted sample with the hemolytic reagent is not sufficiently stable to avoid sensitivity to its environment.
Accordingly, when obtaining a hematology measurement such as hemoglobin concentration, it is generally not acceptable to wait for the lysed sample to reach a steady state temperature.
Unfortunately, it is not easy to produce chromogen from the hemolytic reaction at a single stable temperature immediately following the reaction.
However, these prior systems and methods have not produced satisfactory results, as significant temperature variations continue to produce different hemoglobin measurements when using these systems methods.
However both of these methods are unsatisfactory in their results as well as their additional costs.
This method acknowledges that the initial uncalibrated hemoglobin measurement taken by the automated hematology analyzer is not always accurate because of various factors such as engineering tolerances and environmental factors, and unique instrument characteristics.
While the calibration method provides for scaling of the measured temperature, these same changes are generally applied to all measurements or a whole range of measurements, and are not exact changes that account for temperature variations over a range of temperatures.
Accordingly, the temperature calibration method provides generally unsatisfactory results when attempting to accurately measure hemoglobin.
Unfortunately, inclusion of a temperature control unit within the automated hematology has several problems.
For example, the inclusion of the temperature control unit adds significant cost to the instrument which is then passed on to the purchaser of the instrument in the form of an increased price.
In addition, when a temperature control unit is added, additional parts are included in the machine that make the machine more susceptible to failure and need of repair.
Moreover, even with a temperature control unit, measurement results are not always accurate, as the hemoglobin reaction temperature may change frequently or may be higher than expected (e.g., higher than the predetermined temperature), resulting in a measurement being taken before the temperature control unit stabilizes the temperature to the predetermined temperature.

Method used


Image

  • Method of hemoglobin correction due to temperature variation
  • Method of hemoglobin correction due to temperature variation
  • Method of hemoglobin correction due to temperature variation

Examples


example

[0046] Hemoglobin concentration was measured using a Beckman Coulter automated hematology analyzer for thirty blood samples. The thirty blood samples were diluted and lysed using Lyse S™ III. Hemoglobin concentration measurements were obtained for each of the thirty blood samples at several different temperatures ranging from 70° F. to 88° F. The temperatures were measured at the reaction chamber of the automated hematology analyzer immediately before the hemoglobin concentration measurements were taken. After uncorrected hemoglobin measurements were obtained, corrected hemoglobin measurements were obtained using the method described herein. Both the uncorrected and corrected hemoglobin results were logged as shown in the tables below. Table 1 below provides the uncorrected hemoglobin concentration measurements for the thirty samples measured. Table 2 below provides the corrected hemoglobin concentration for the thirty samples measured.

TABLE 1Uncorrected HgbTrialyseTrialyseTrialys...


PUM


Abstract

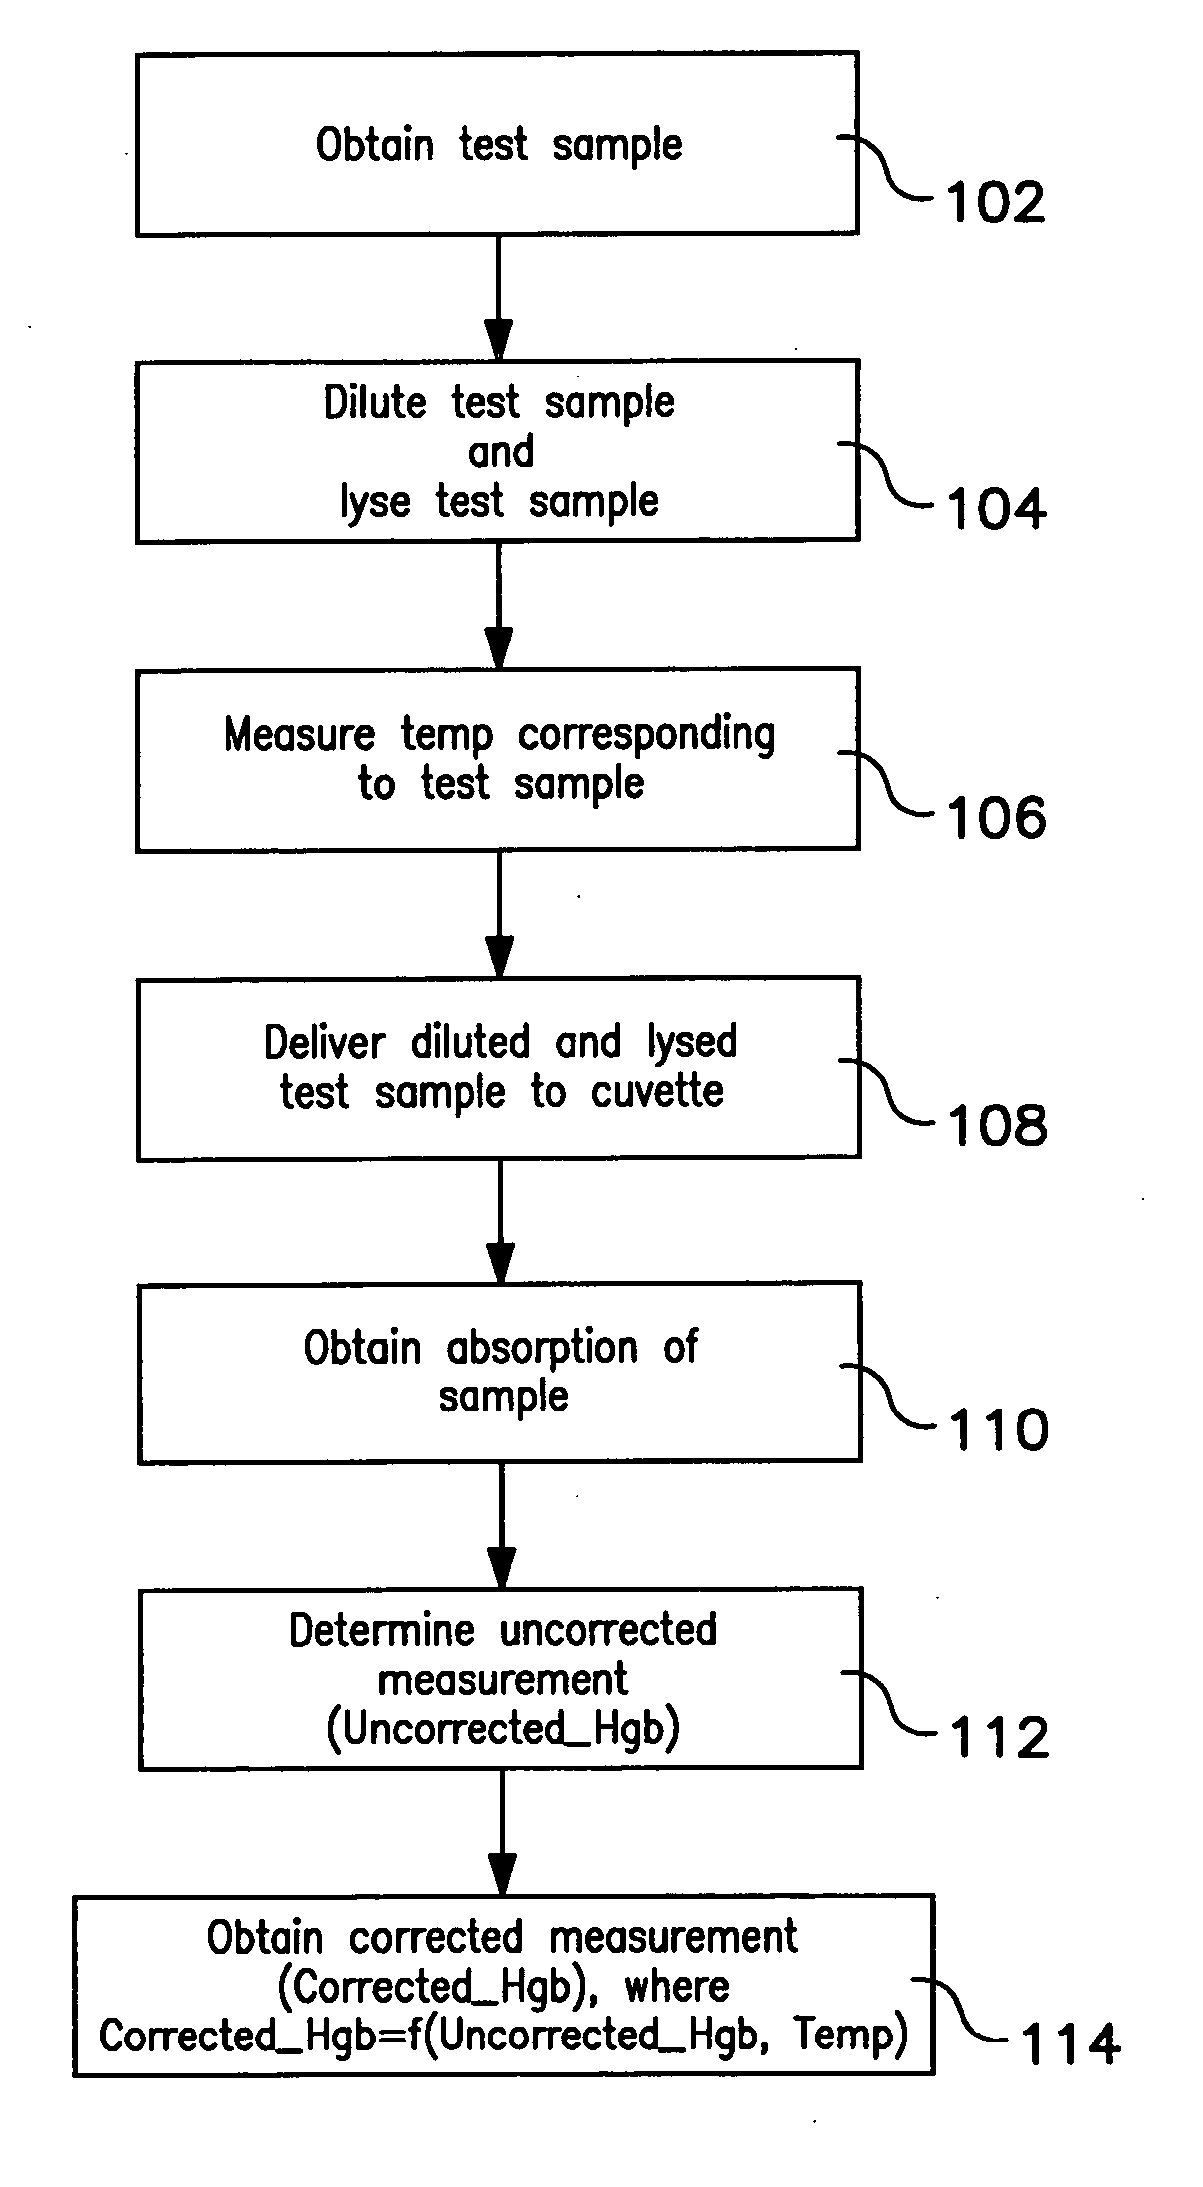
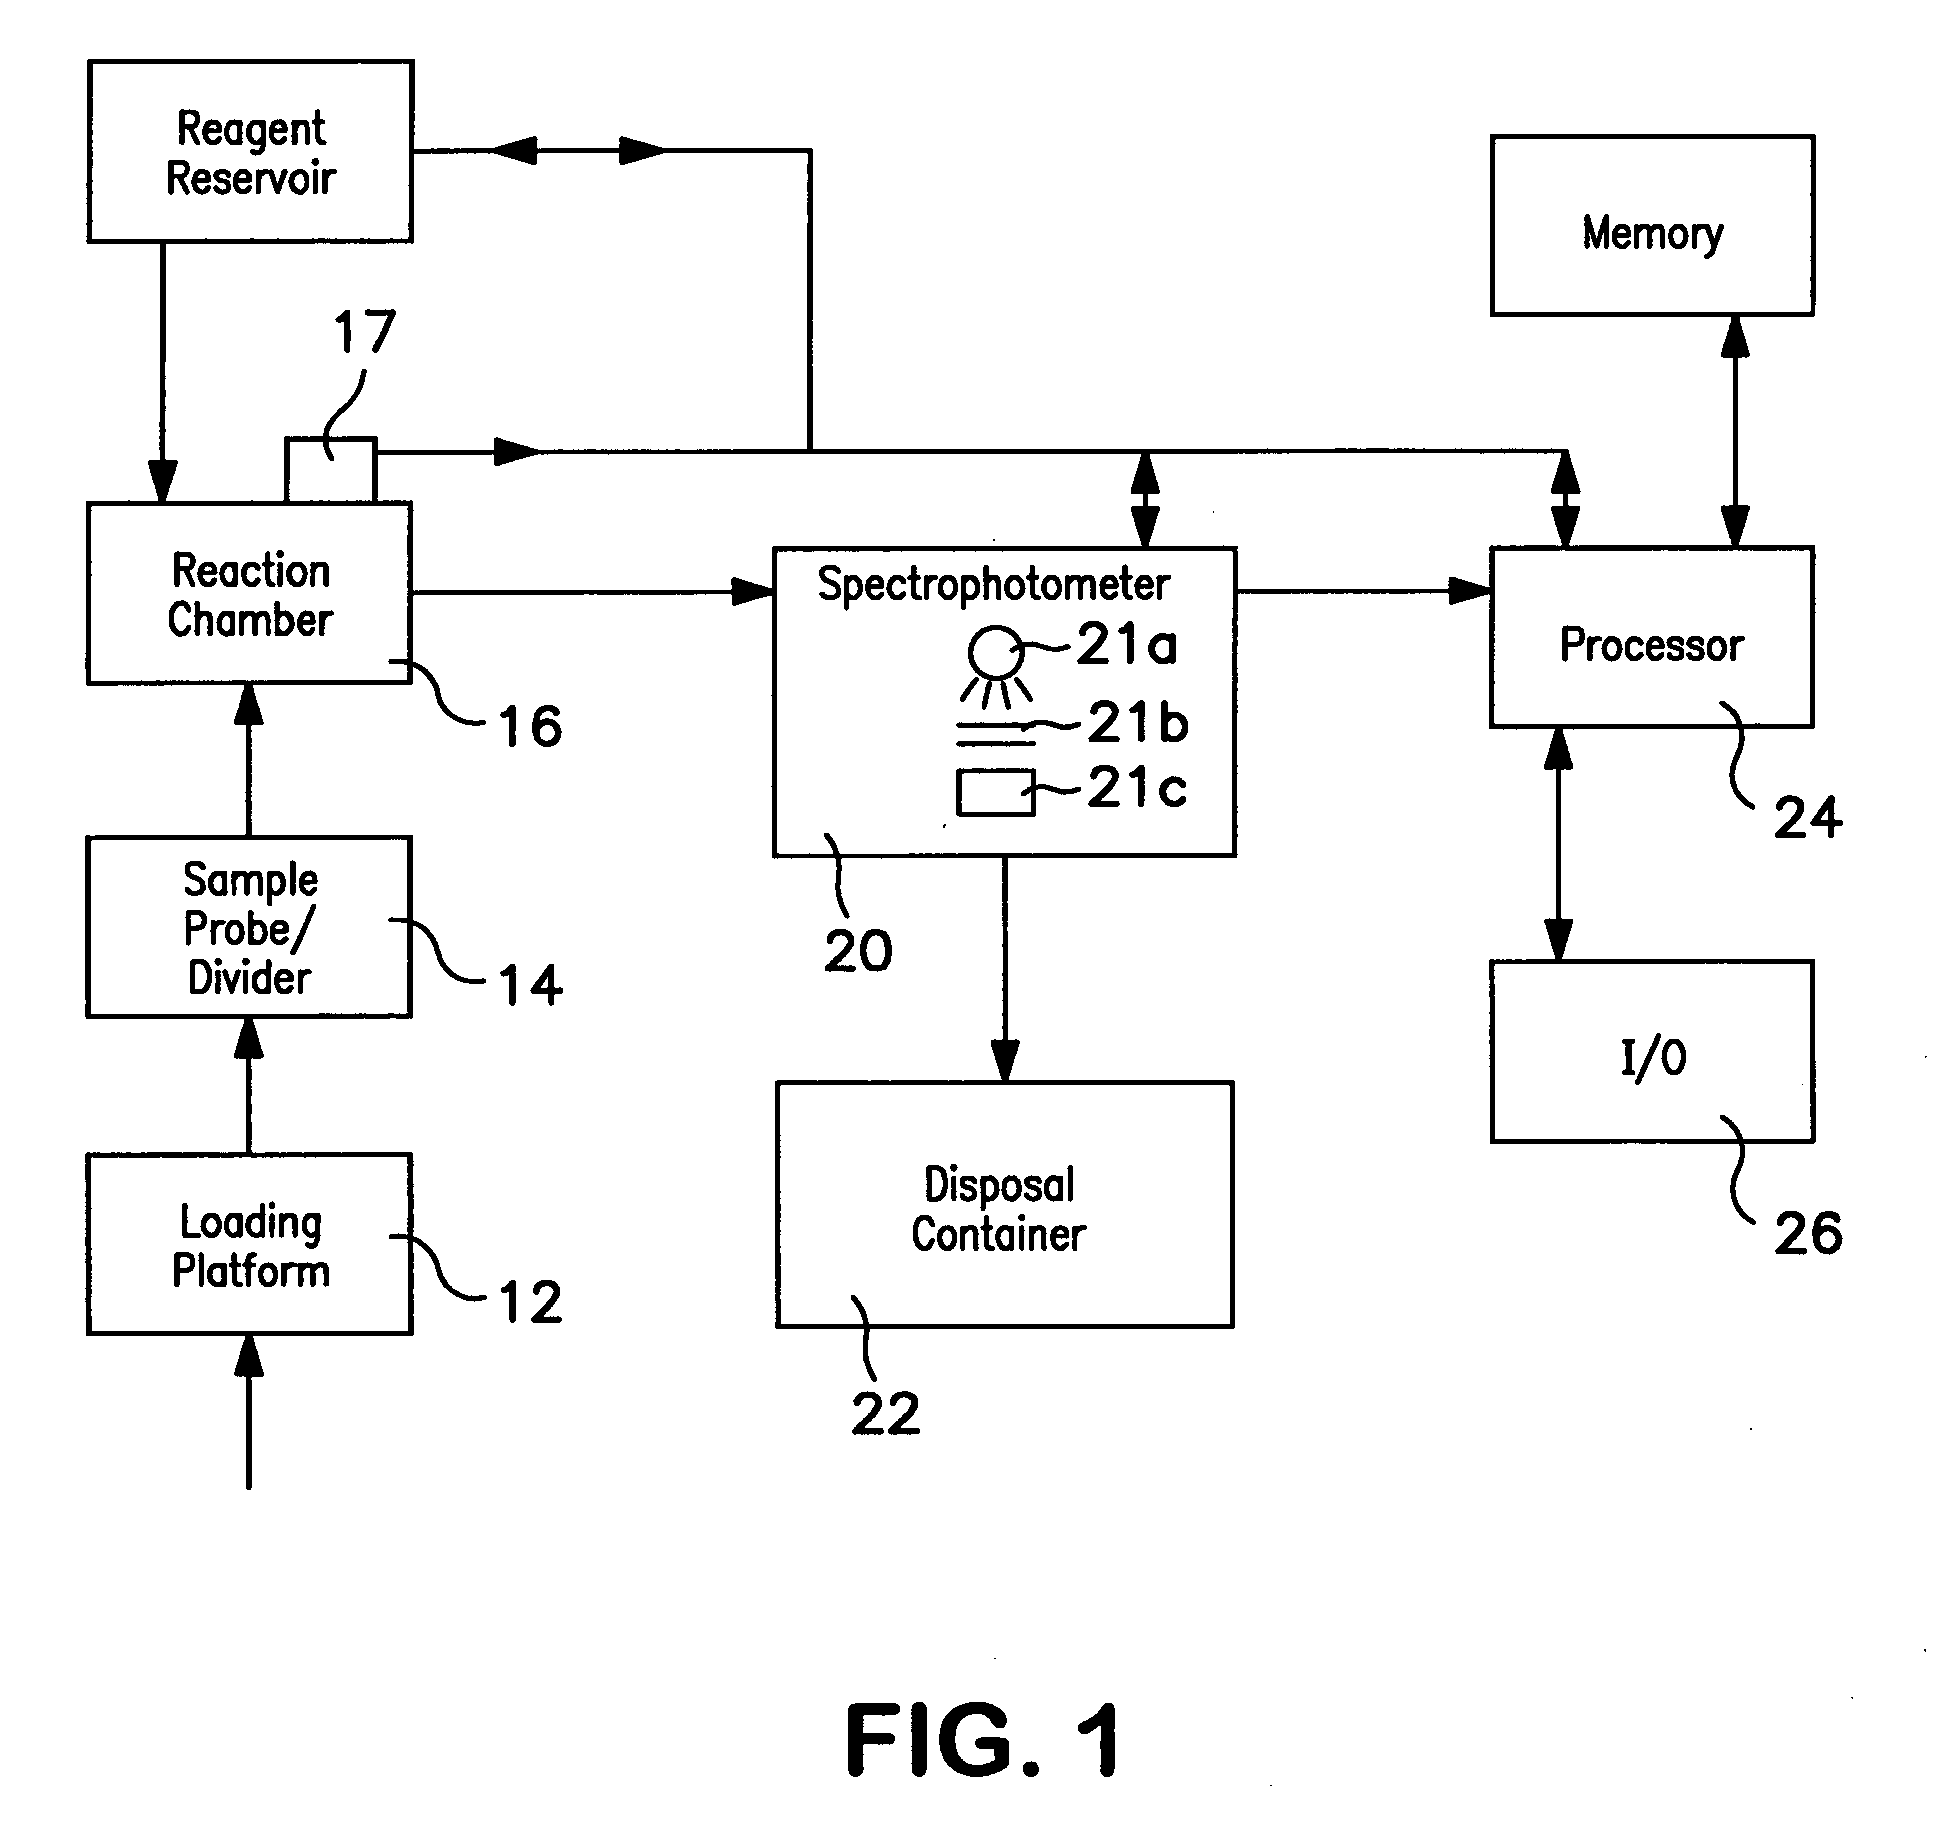
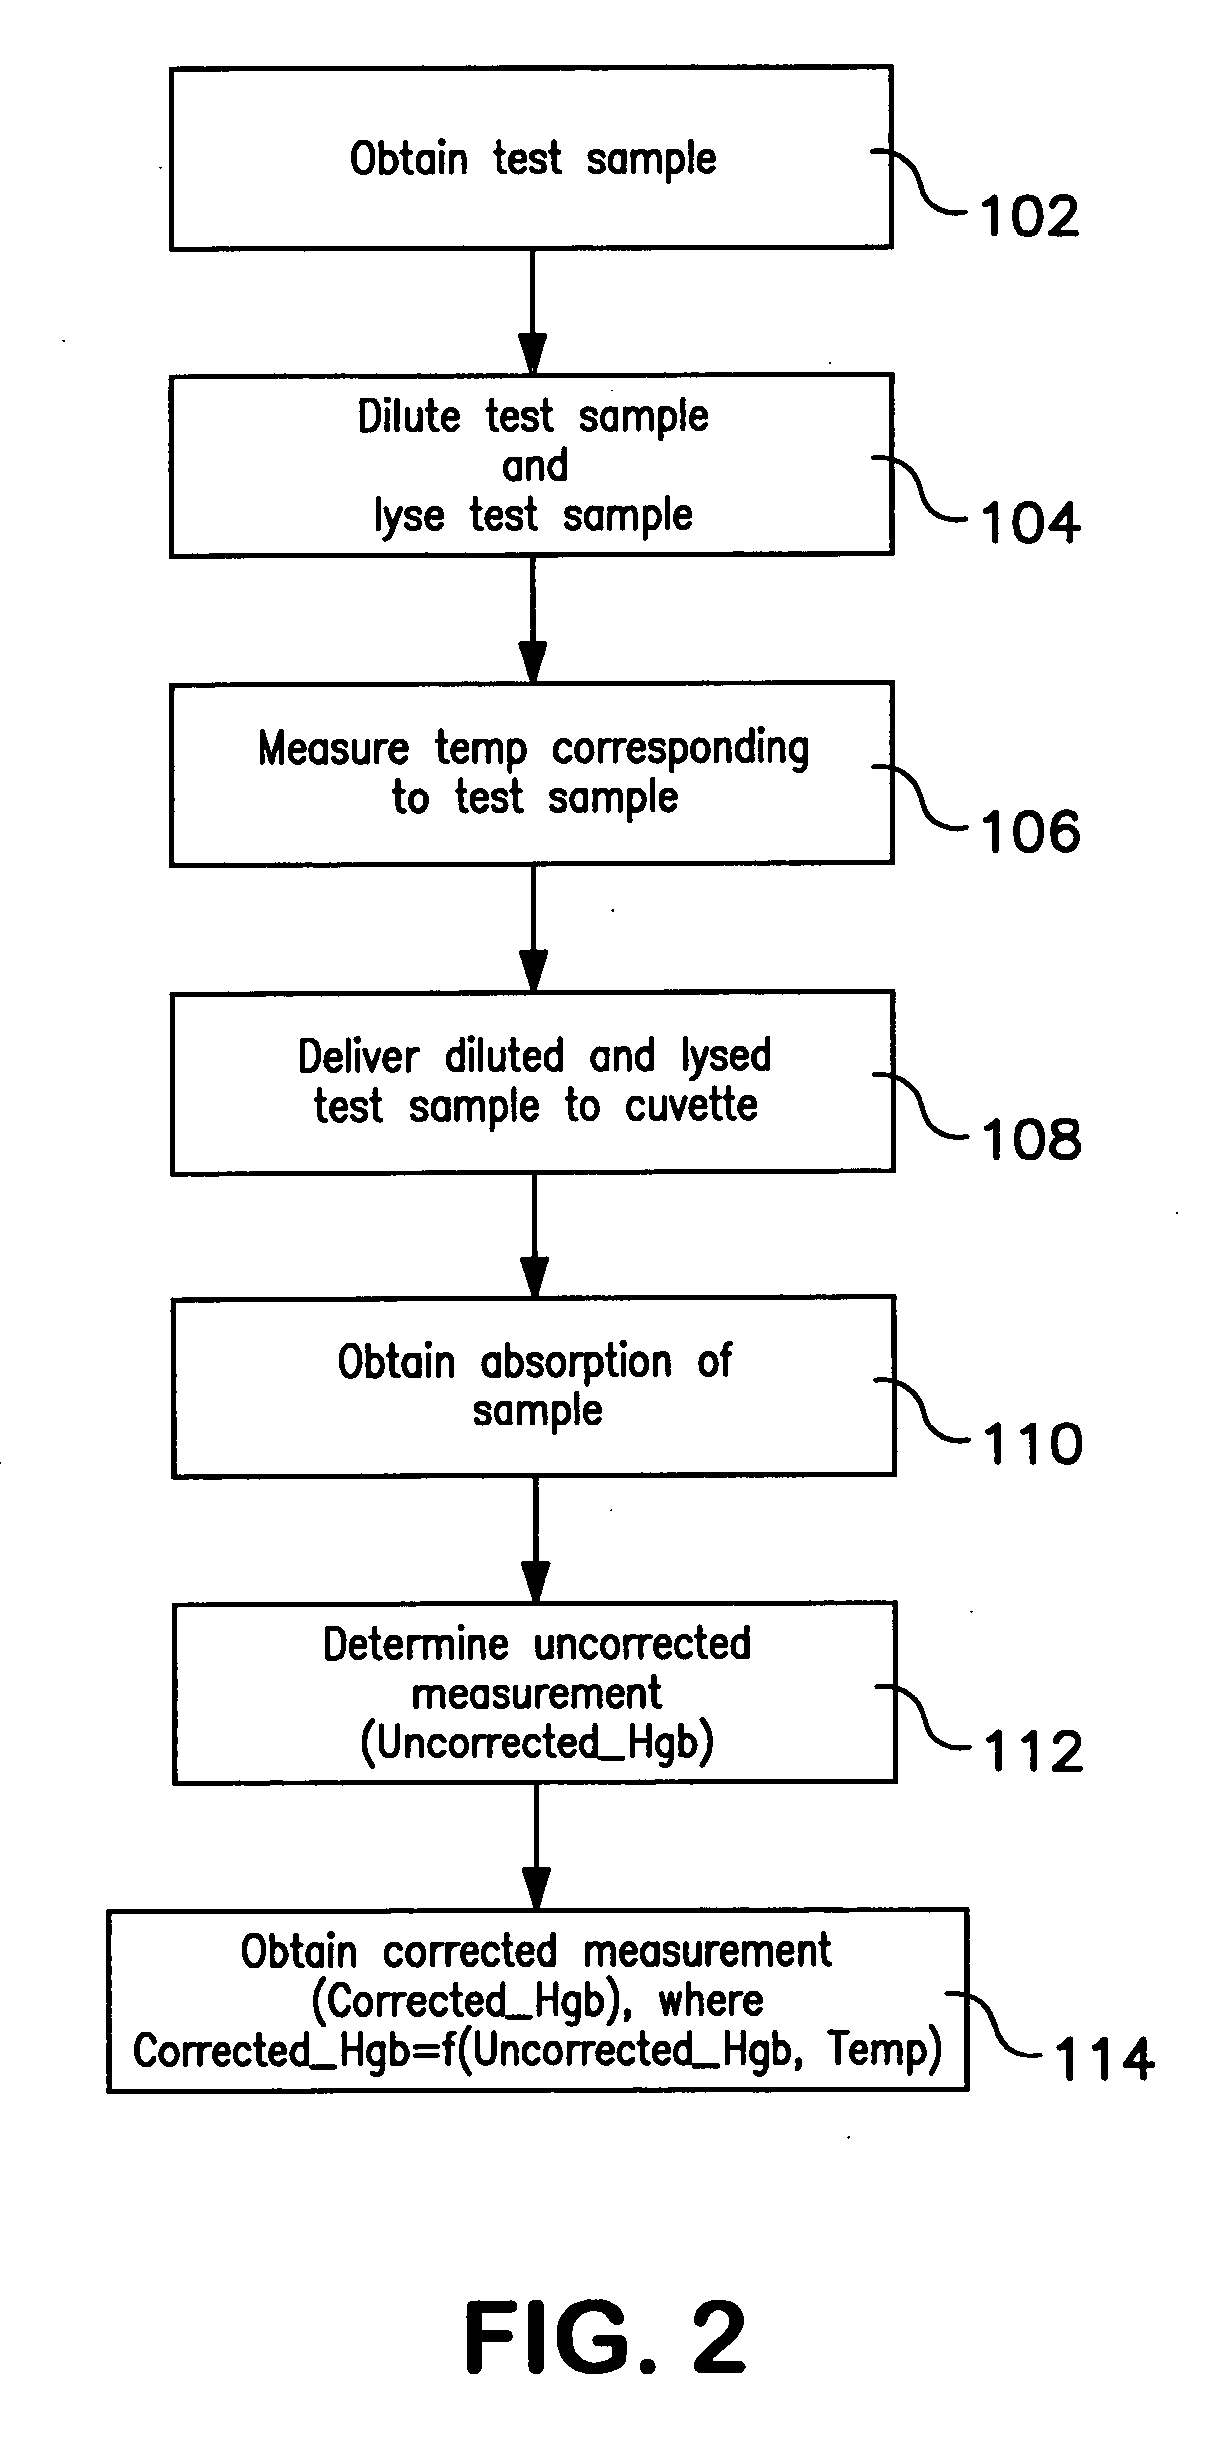
A method of measuring a hemoglobin parameter of a test sample of blood comprises diluting and lysing a test sample. Then, a temperature corresponding to the test sample is obtained. The diluted and lysed test sample is then delivered to a cuvette, and a spectrophotometer determines the absorbance and / or transmittance of the sample in the cuvette. With the absorbance and / or transmittance of the test sample, a first measurement of the hemoglobin parameter of the test sample is obtained. After a first measurement of the hemoglobin parameter is obtained, a processor determines a corrected measurement of the hemoglobin parameter of the test sample. The corrected measurement is a function of the measured temperature that corresponds to the test sample and the first measurement of the hemoglobin parameter. The method of measuring a hemoglobin parameter is valid over a range of test sample temperatures.

Description

BACKGROUND [0001] This invention relates to the field of hematology, and more particularly to the field of automated hematology analyzers. [0002] It is common medical diagnostic practice to obtain a sample of a patient's blood and test the sample for various hematology parameters. For example, a patient's blood sample may be tested and analyzed to determine red blood cell count, platelet count, white blood cell count, white blood cell types, hematocrit and / or hemoglobin concentration. A number of other hematology parameters may also be determined and analyzed. [0003] The parameters of the patient's blood revealed by the blood testing and analysis may be of significant assistance to a physician in making a diagnosis. For example, increased white blood cell count may indicate the existence of an infection in the body. Certain increased concentrations of white blood cells may indicate various conditions, such as leukemia. A high red blood cell count may indicate that the patient is not...

Claims


Application Information

Patent Timeline
IPC IPC(8): G01N33/72
CPCG01N33/726G01N33/721
Inventor HUO, ZILINGLI, WILLIAMQIAN, CHENG
Owner BECKMAN COULTER INC
Learn More