Eureka AIR delivers breakthrough ideas for toughest innovation challenges, trusted by R&D personnel around the world.

Non-invasive measurement of analytes

Active Publication Date: 2007-01-25
CERCACOR LAB INC
View PDF69 Cites 115 Cited by
  • Summary
  • Abstract
  • Description
  • Claims
  • Application Information

AI Technical Summary

Benefits of technology

[0393] In one embodiment, a small molecule metabolic reporter (i.e., Glucose Oxidase-Labeled Fluorophore: GO-LF), when brought in contact with glucose, forms a fluorescent species. The GO-LF molecule is in the form of glucose oxidase protein whereby a fluorescent cofactor analog is incorporated as a substituent molecule (SubMol) to the enzyme cofactor flavin adenine dinucleotide (FAD). One advantage of the present invention is the increased sensitivity of 10-100 times the former visible color reaction, smaller analyte concentration requirements (pM vs. μM or mM of glucose), and greater simplicity of the chemical strip system (i.e., a single reagent versus multiple reagents as described in detail herein). This sensor or reader measuring the strip response requires less sample volume, less sensitivity, and less power than previous strips while yielding improved accuracy.

Problems solved by technology

Invasive forms of self-testing are painful and fraught with a multitude of psychosocial hurdles, and are resisted by most diabetics.
However, other endogenous substances including, but not limited to, water, lipids, proteins, and hemoglobin are known to absorb energy, particularly infrared light and can easily obscure the relatively weak glucose signal.
While putatively non-invasive, these technologies have yet to be demonstrated as effective in clinical testing.
In keeping with its nearly noninvasive description, this technology is commonly associated with some discomfort and requires at least twice daily calibrations against conventional blood glucose measurements (e.g. invasive lancing).
Although technologically innovative, these in situ sensors have had limited success.
Implantable glucose oxidase (“GO”) sensors have been limited by local factors causing unstable signal output, whereas optical sensors must overcome signal obfuscation by blood constituents as well as interference by substances with absorption spectra similar to glucose.
Moreover, inflammation associated with subcutaneous monitoring may contribute to systematic errors requiring repositioning, recalibration or replacement, and more research is needed to evaluate the effects of variable local inflammation at the sensor implantation site on glucose concentration and transit time.

Method used


Image

  • Non-invasive measurement of analytes
  • Non-invasive measurement of analytes
  • Non-invasive measurement of analytes

Examples


example 1

Relating Fluorescence of Mitochondrial Membrane Probes to D-Glucose Concentration

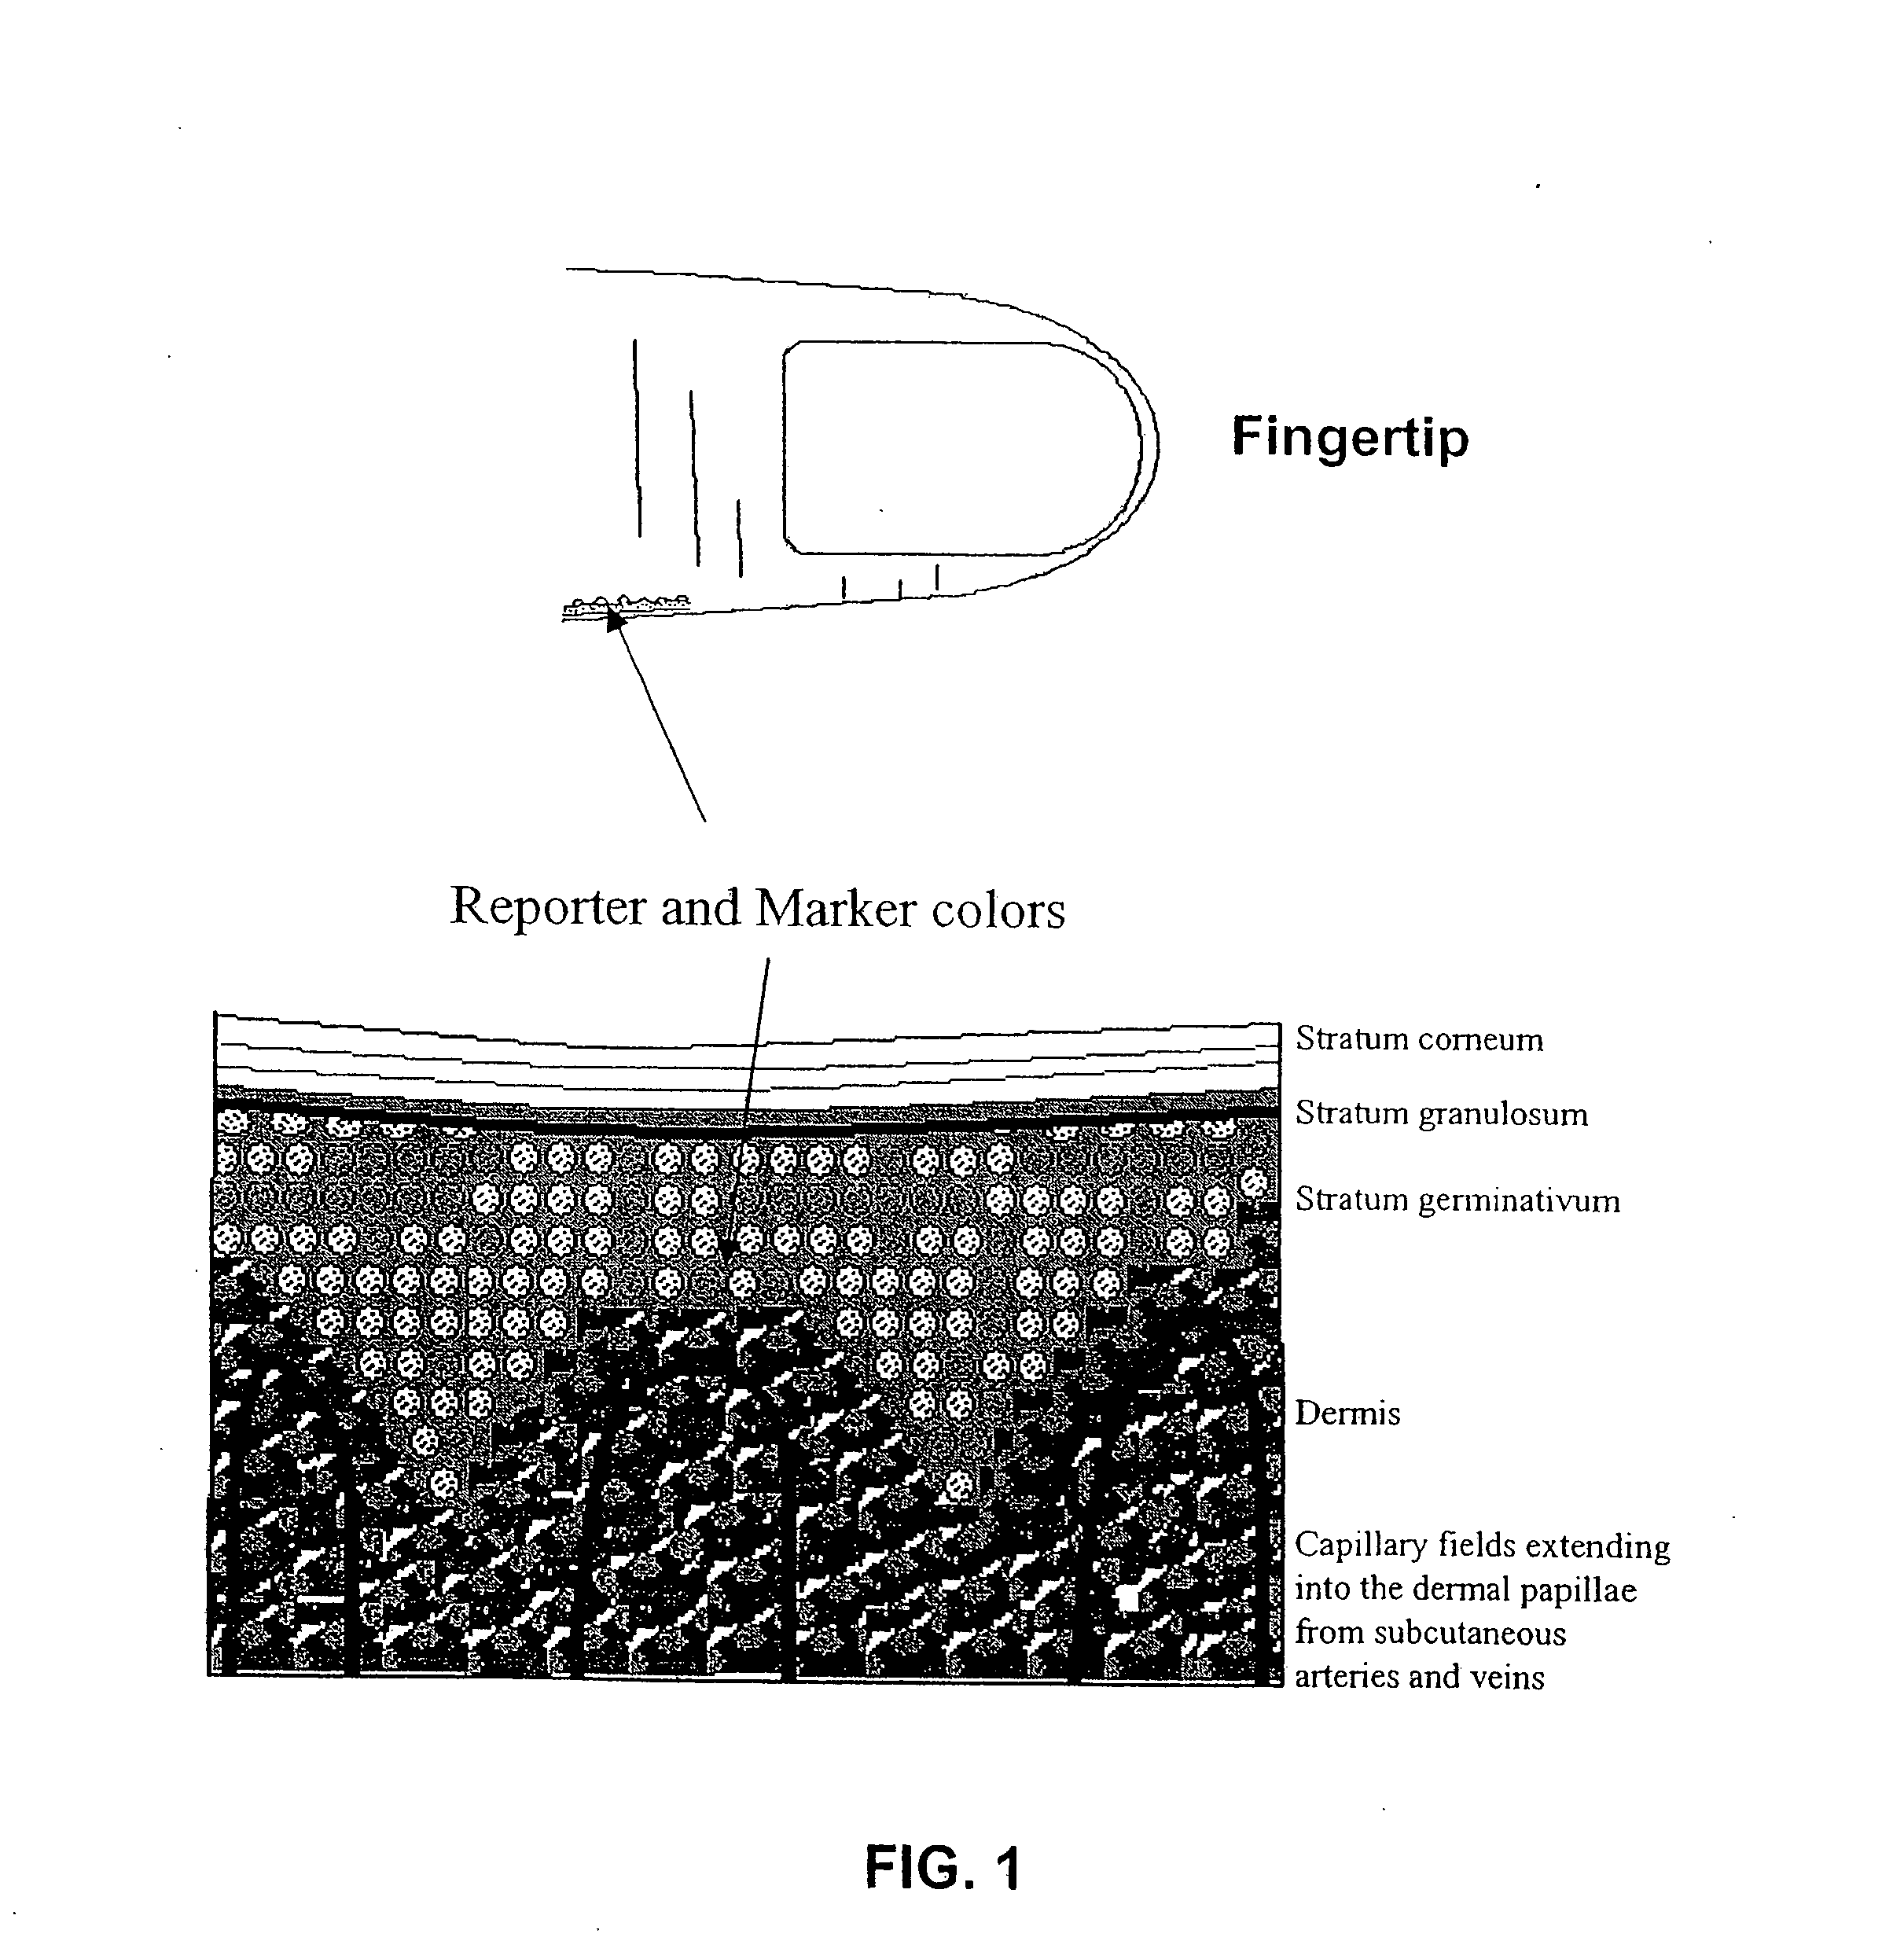
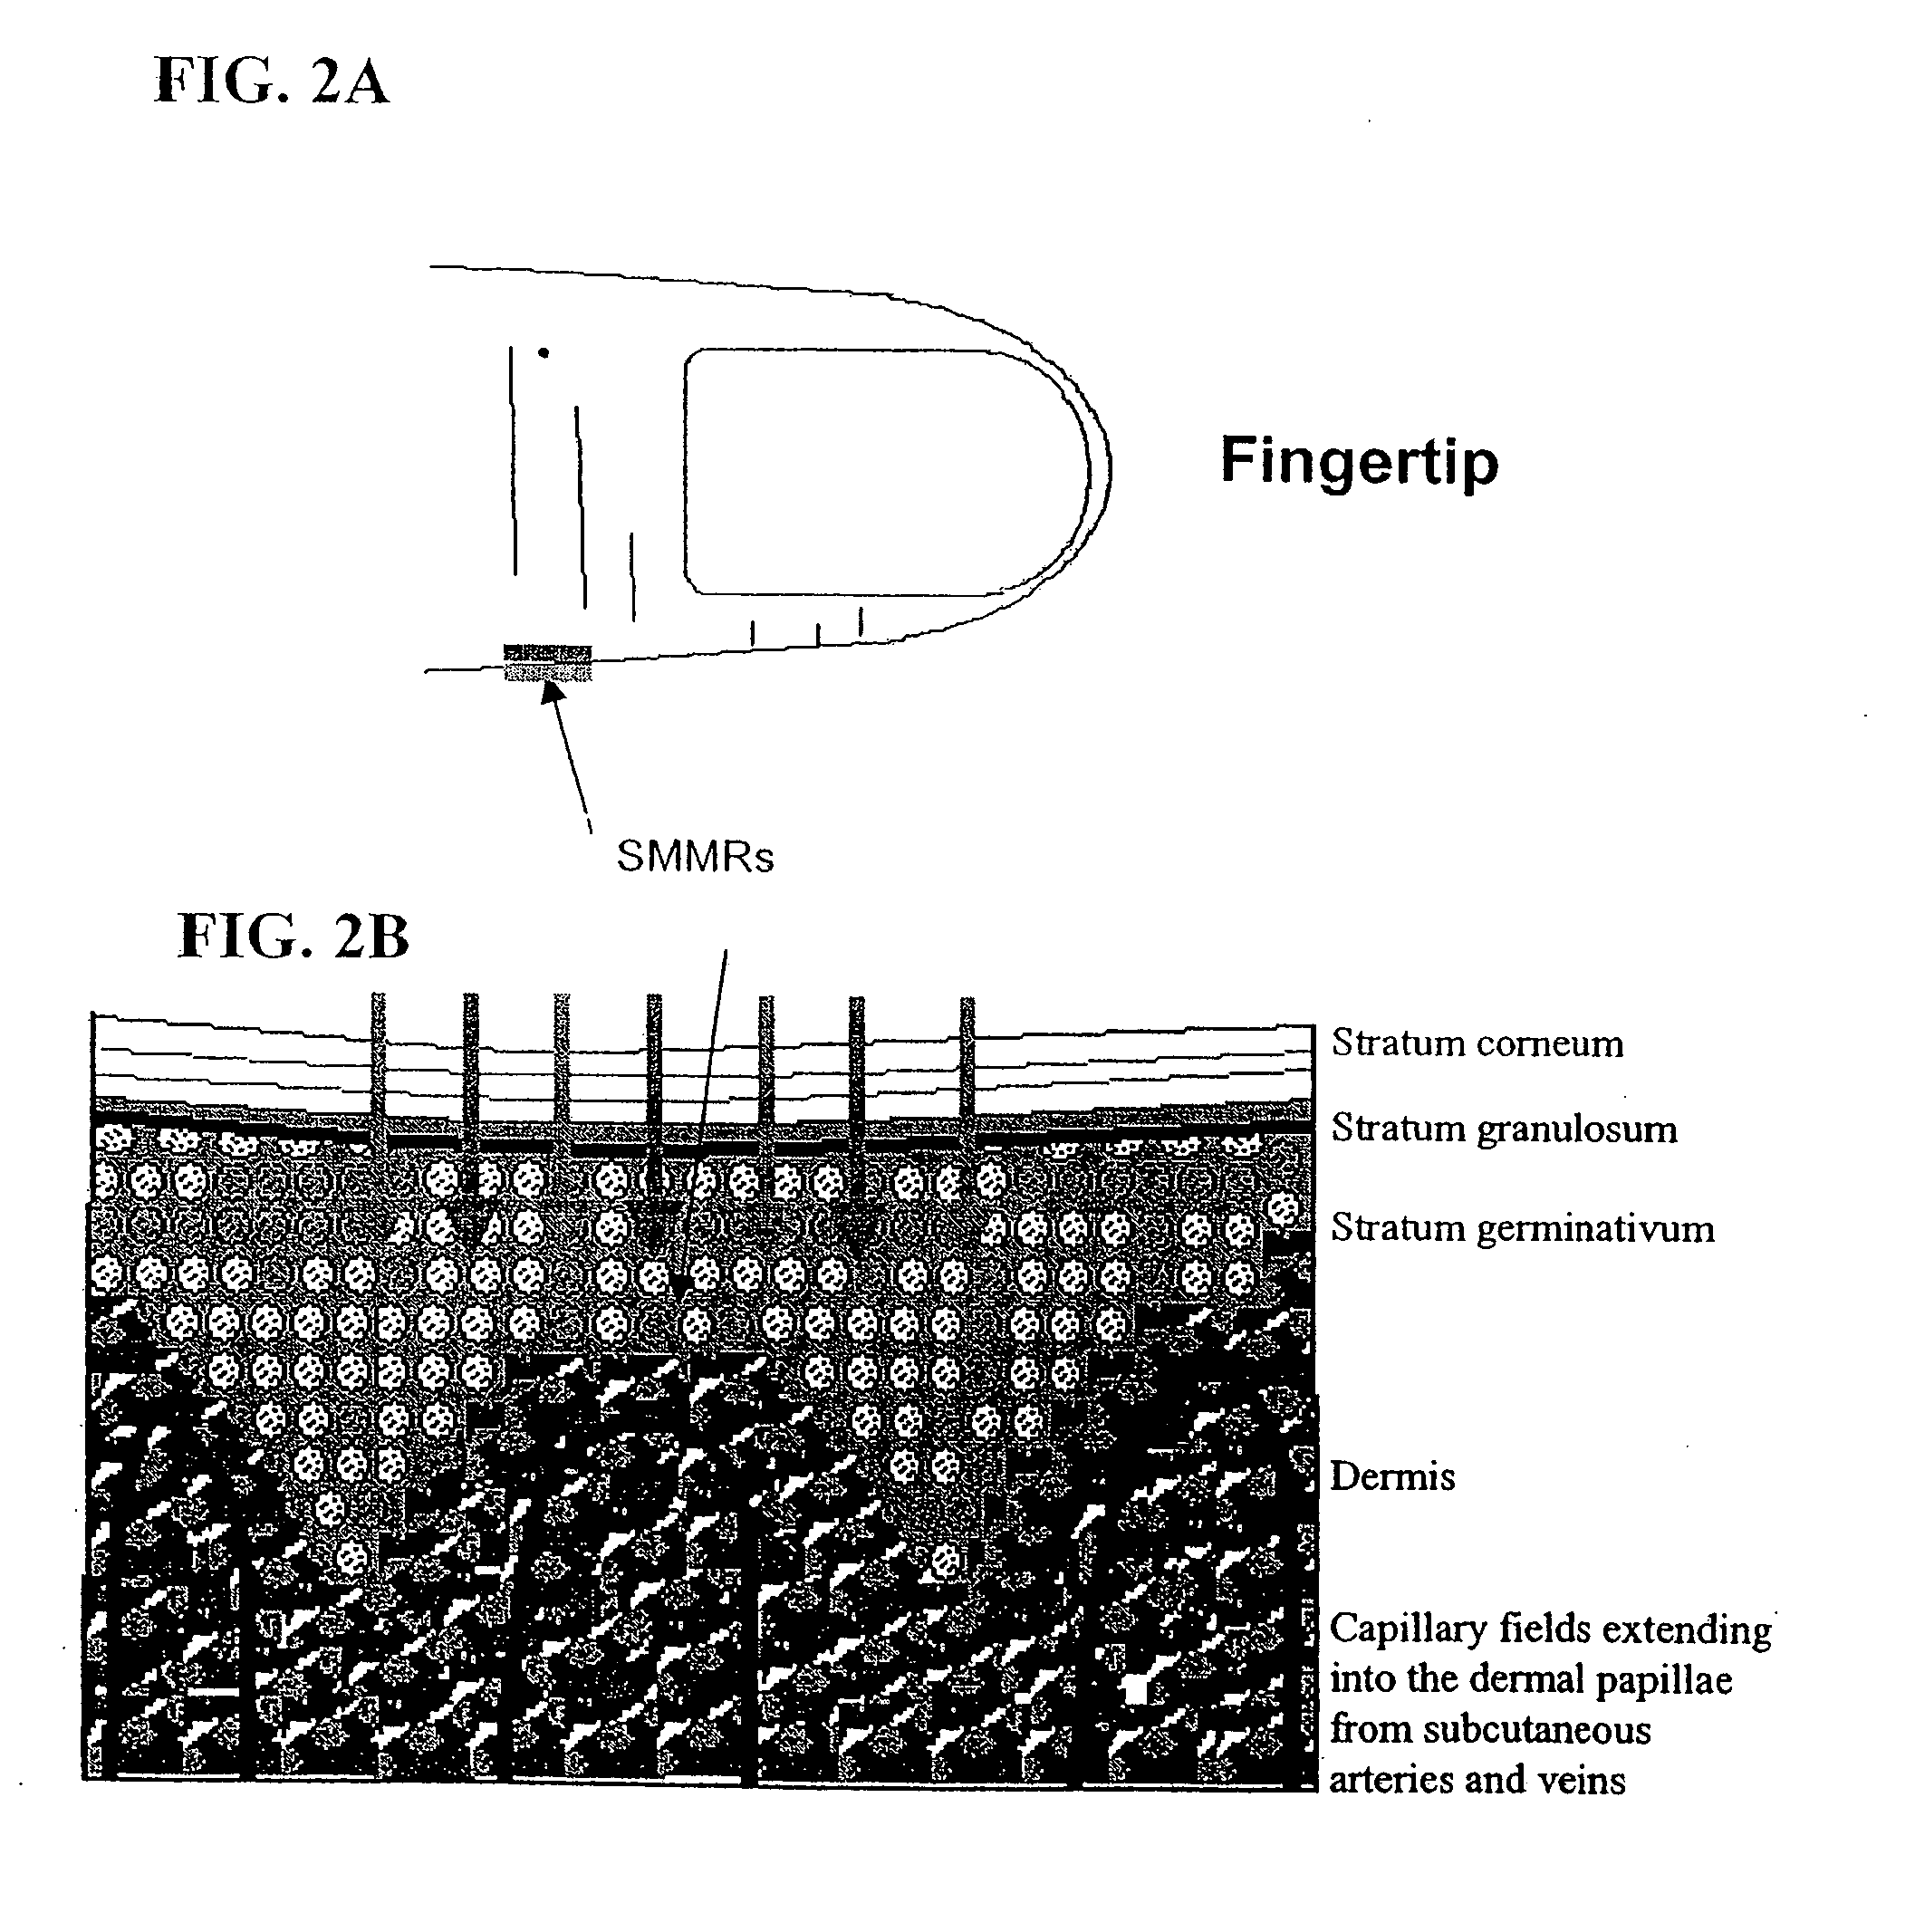
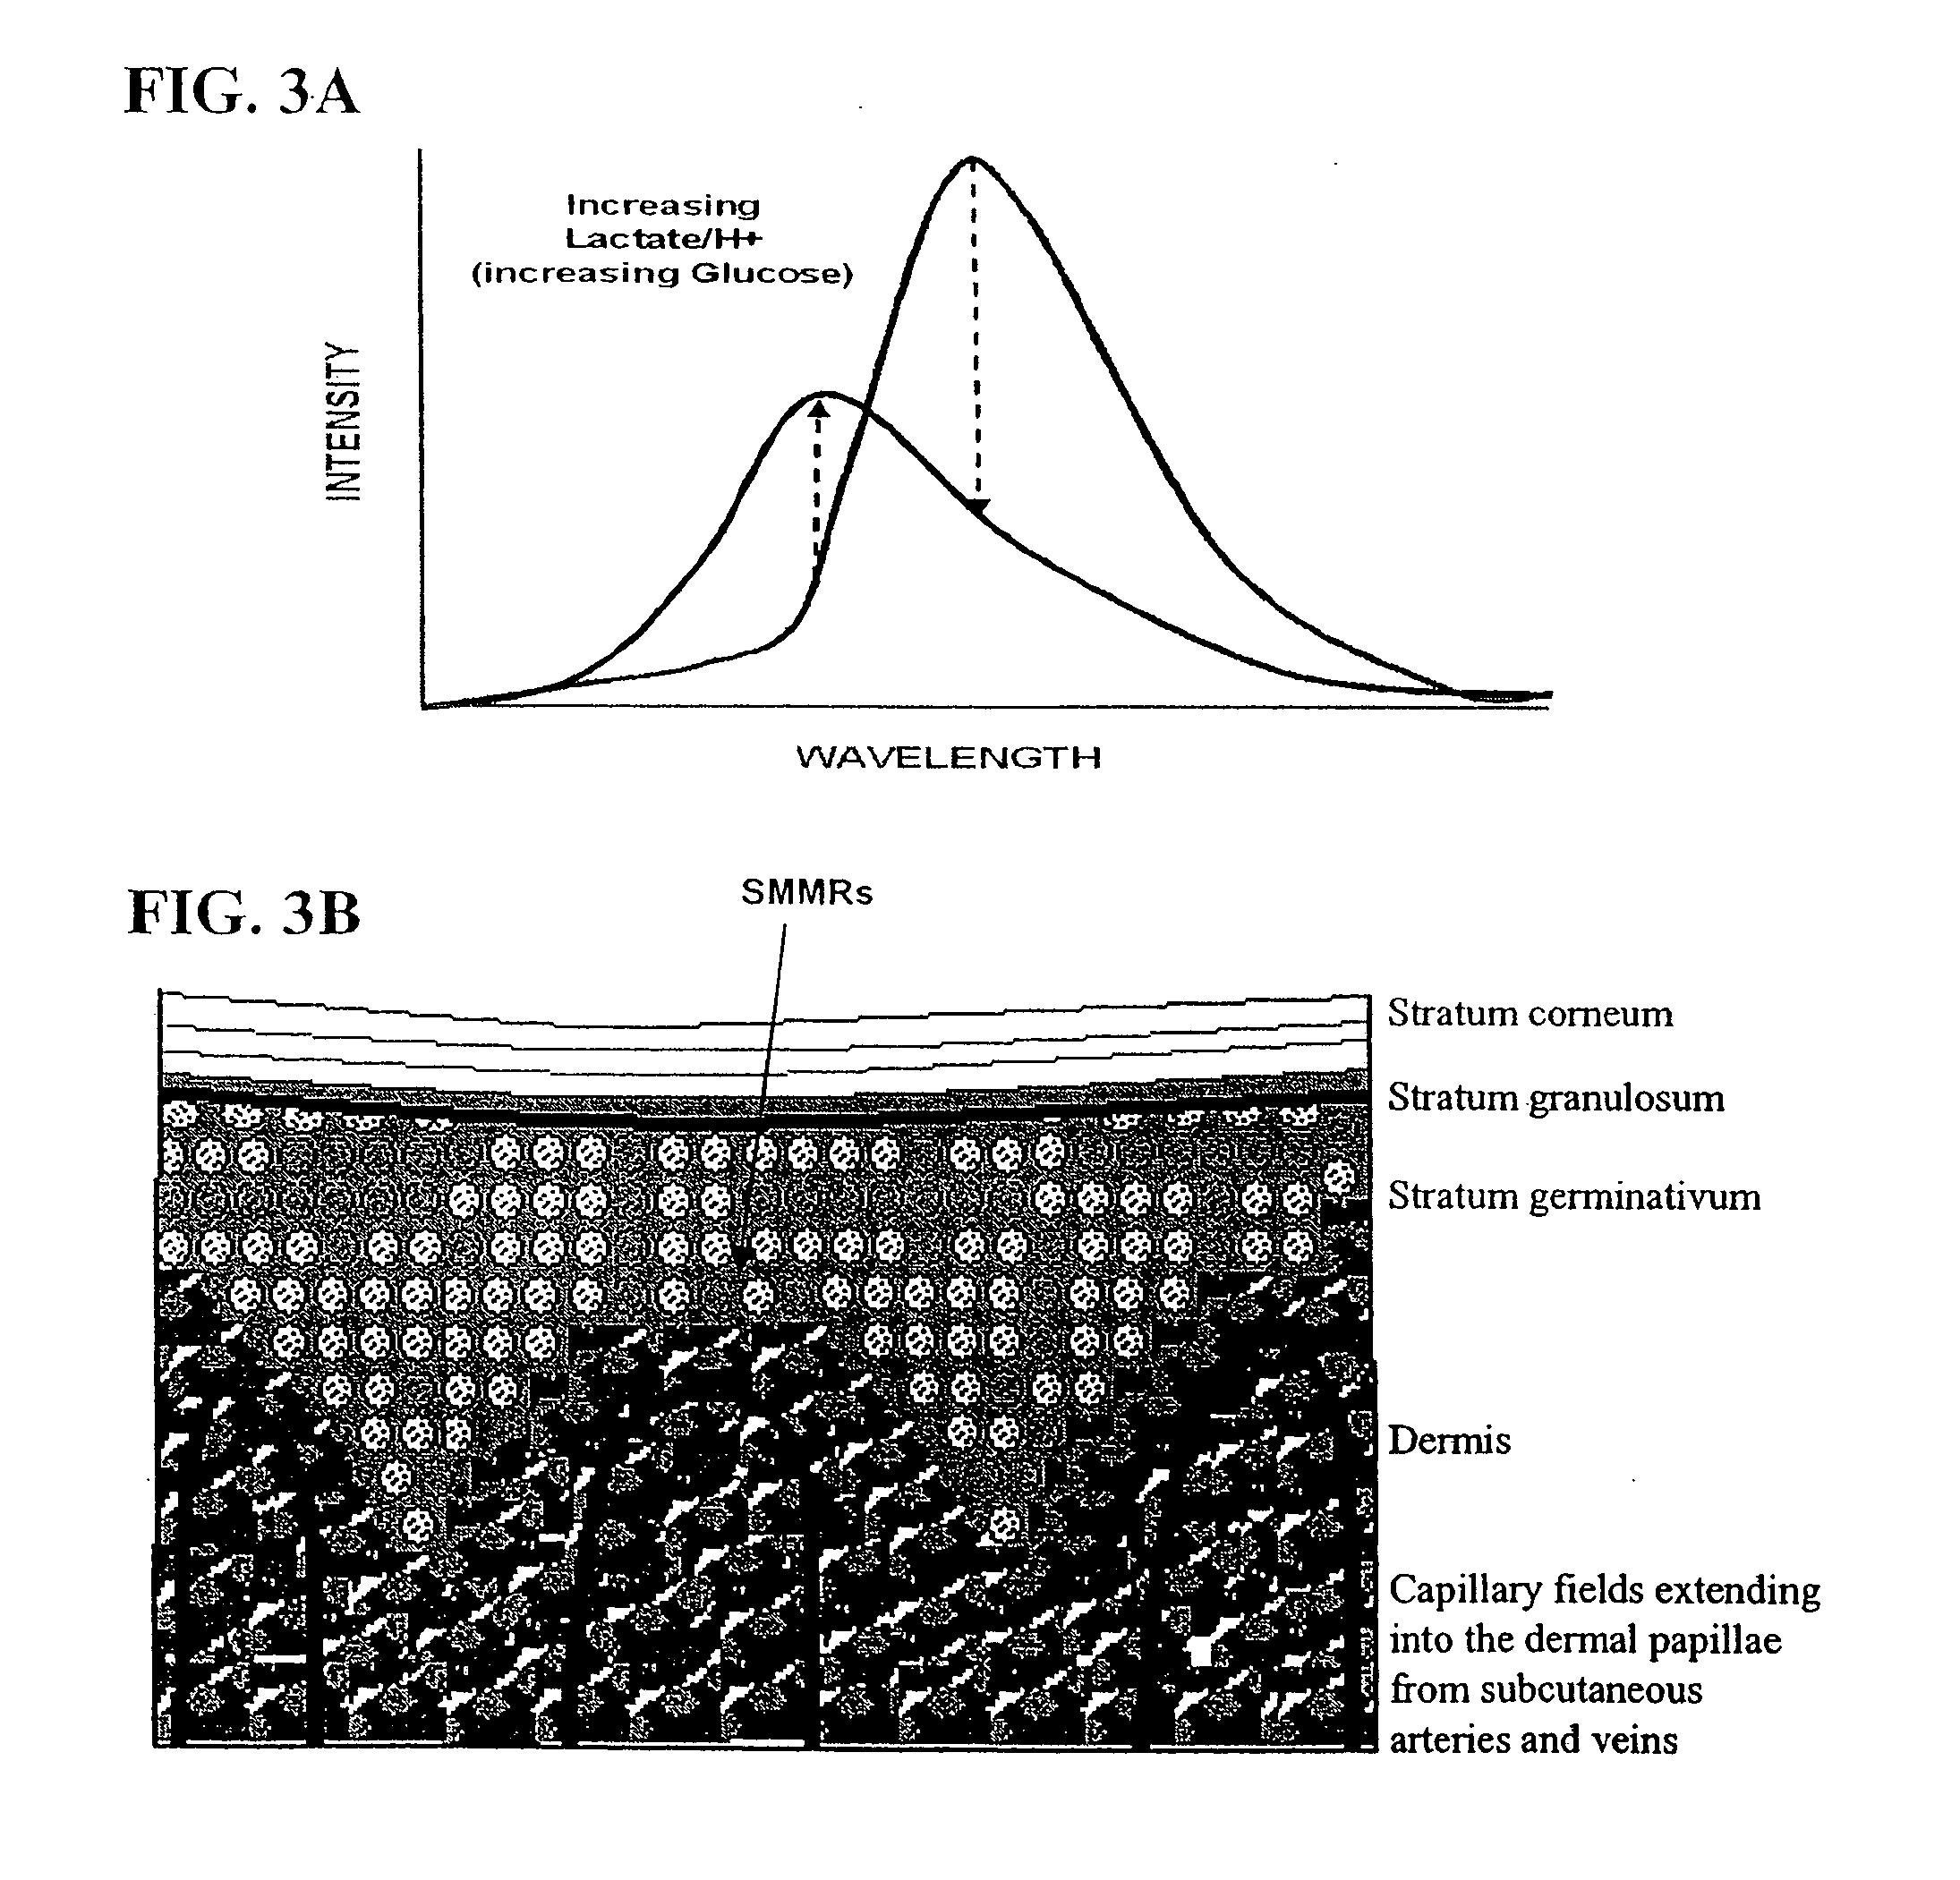
[0453] Described herein is a technique for establishing the dose-response relationship for tracking skin and blood glucose concentrations using mitochondrial membrane potential. The SMMR used in this embodiment have the demonstrated property of being mitochondrial-specific vital stains that respond in a direct relationship to the rate of glycolysis, which is directly related to intracellular glucose concentration. The fluorescence response of one specific embodiment of this invention uses SMMR exhibiting an excitation wavelength of from 290 to 790 nm, more preferably 400 to 550 nm, and most preferably from 440 to 490 nm, i.e., the wavelengths used to excite a fluorescence response of the SMMR. The fluorescence is monitored at above 480 nm, preferably above 490 nm and most preferably at 501 nm. The upper range for monitoring is at or below 790 nm. Excitation and emission wavelengths are selected to min...

example 2

Relating Fluorescence of Energy Transfer to a Reporter Dye to D-Glucose Concentration

[0463] SMMRs can also be used to report the metabolic state of cells, by using such dyes to monitor NAD(P)H concentration. NAD(P)H can be excited at wavelengths of 340 to 360 nm. Over this wavelength range, the molar absorption coefficient of SMMRs such as Rh123 is low (Rh123 ε−1 cm−1 from 345 nm to 425 nm compared with 6.3×10³ L·M−1 cm−1 for NADH. (NADH and NAD(P)H are indistinguishable by their absorption or emission spectra.) Excitation at 350 nm of tissue that has been incubated with Rh123 shows a distinct fluorescence signal at 530 nm. This fluorescence arises because of collisional energy transfer from NAD(P)H to the Rh123. Under conditions where the energy transfer is efficient this process leads to an enhancement of the sensitivity with which NAD(P)H can be detected, shown in equation (6) as:

[0464] The excited state of Rh123 (Rh-123*) relaxes to the ground state by fluorescence with almo...

example 3

Relating Fluorescence of Membrane Localizing Reporter Dyes to D-Glucose Concentration

[0465] Membrane localizing dyes are used to detect activity of membrane bound proteins. Dyes such as diphenylhexatriene have been used in the past to monitor membrane fluidity. However many dyes may be used to monitor membrane activity by energy transfer mechanisms. Dyes that are useful in this role include molecules that have lower singlet energy levels than amino acid residues such as tryptophan, that is, they absorb light at longer wavelengths than 320 nm. Suitable dyes include, but are not limited to xanthenes, cyanines as well as diphenyl hexatriene and its derivatives. The efficiency of energy transfer is determined by the separation of the donor and acceptor pair and is given by the expression in equation (7): E=Ro6Ro6+r6(7)

where E is the efficiency, R0 is the Förster radius and r is the donor acceptor separation. The Förster radius is defined as the donor acceptor separation that gives a...


PUM


Abstract

This invention provides devices, compositions and methods for determining the concentration of one or more metabolites or analytes in a biological sample, including cells, tissues, organs, organisms, and biological fluids. In particular, this invention provides materials, apparatuses, and methods for several non-invasive techniques for the determination of in vivo blood glucose concentration levels based upon the in vivo measurement of one or more biologically active molecules found in skin.

Description

RELATED APPLICATIONS [0001] This invention is a continuation in part of U.S. Ser. No. 10 / 617,915, filed on Jul. 10, 2003, which is a continuation in part of U.S. Ser. No. 10 / 616,533, filed on Jul. 9, 2003, which claims priority to U.S. provisional patent application Ser. No. 60 / 425,488, filed Nov. 12, 2002, and this application also claims priority to Ser. No. 60 / 438,837, filed Jan. 9, 2003, Ser. No. 60 / 439,395, filed Jan. 10, 2003, Ser. No. 60 / 447,603, filed Feb. 13, 2003, and Ser. No. 60 / ______, filed on Oct. 31, 2003, each of which is incorporated by reference in its entirety.FIELD OF THE INVENTION [0002] This invention provides devices, compositions and methods for determining the concentration of one or more metabolites or analytes in a biological sample, including cells, tissues, organs, organisms, and biological fluids. In particular, this invention provides materials, apparatuses, and methods for several non-invasive techniques for the determination of in vivo blood glucose ...

Claims


Application Information

Patent Timeline
IPC IPC(8): A61K49/00C12Q1/26A61B5/00
CPCA61B5/14532A61B5/14539A61B5/1455A61B5/413Y10T436/144444A61B5/418A61K49/0041A61K49/0052C12Q1/54A61B5/415
Inventor WORKMAN, JEROME J.LAMBERT, CHRISTOPHER R.COLEMAN, ROBERT L.
Owner CERCACOR LAB INC
Why Eureka
Eureka Blog
Learn More