Eureka AIR delivers breakthrough ideas for toughest innovation challenges, trusted by R&D personnel around the world.

System and method for conditional tracing of computer programs

a computer program and conditional tracing technology, applied in the field of software tools, can solve the problems of inability to always reproduce conditions, bugs giving rise to actual errors, and difficulty in setting such a breakpoint, so as to reduce the size of the trace data generated, and increase the likelihood of the relevance of stored trace information

Active Publication Date: 2006-10-26
BMC SOFTWARE ISRAEL LTD
View PDF53 Cites 207 Cited by
  • Summary
  • Abstract
  • Description
  • Claims
  • Application Information

AI Technical Summary

Benefits of technology

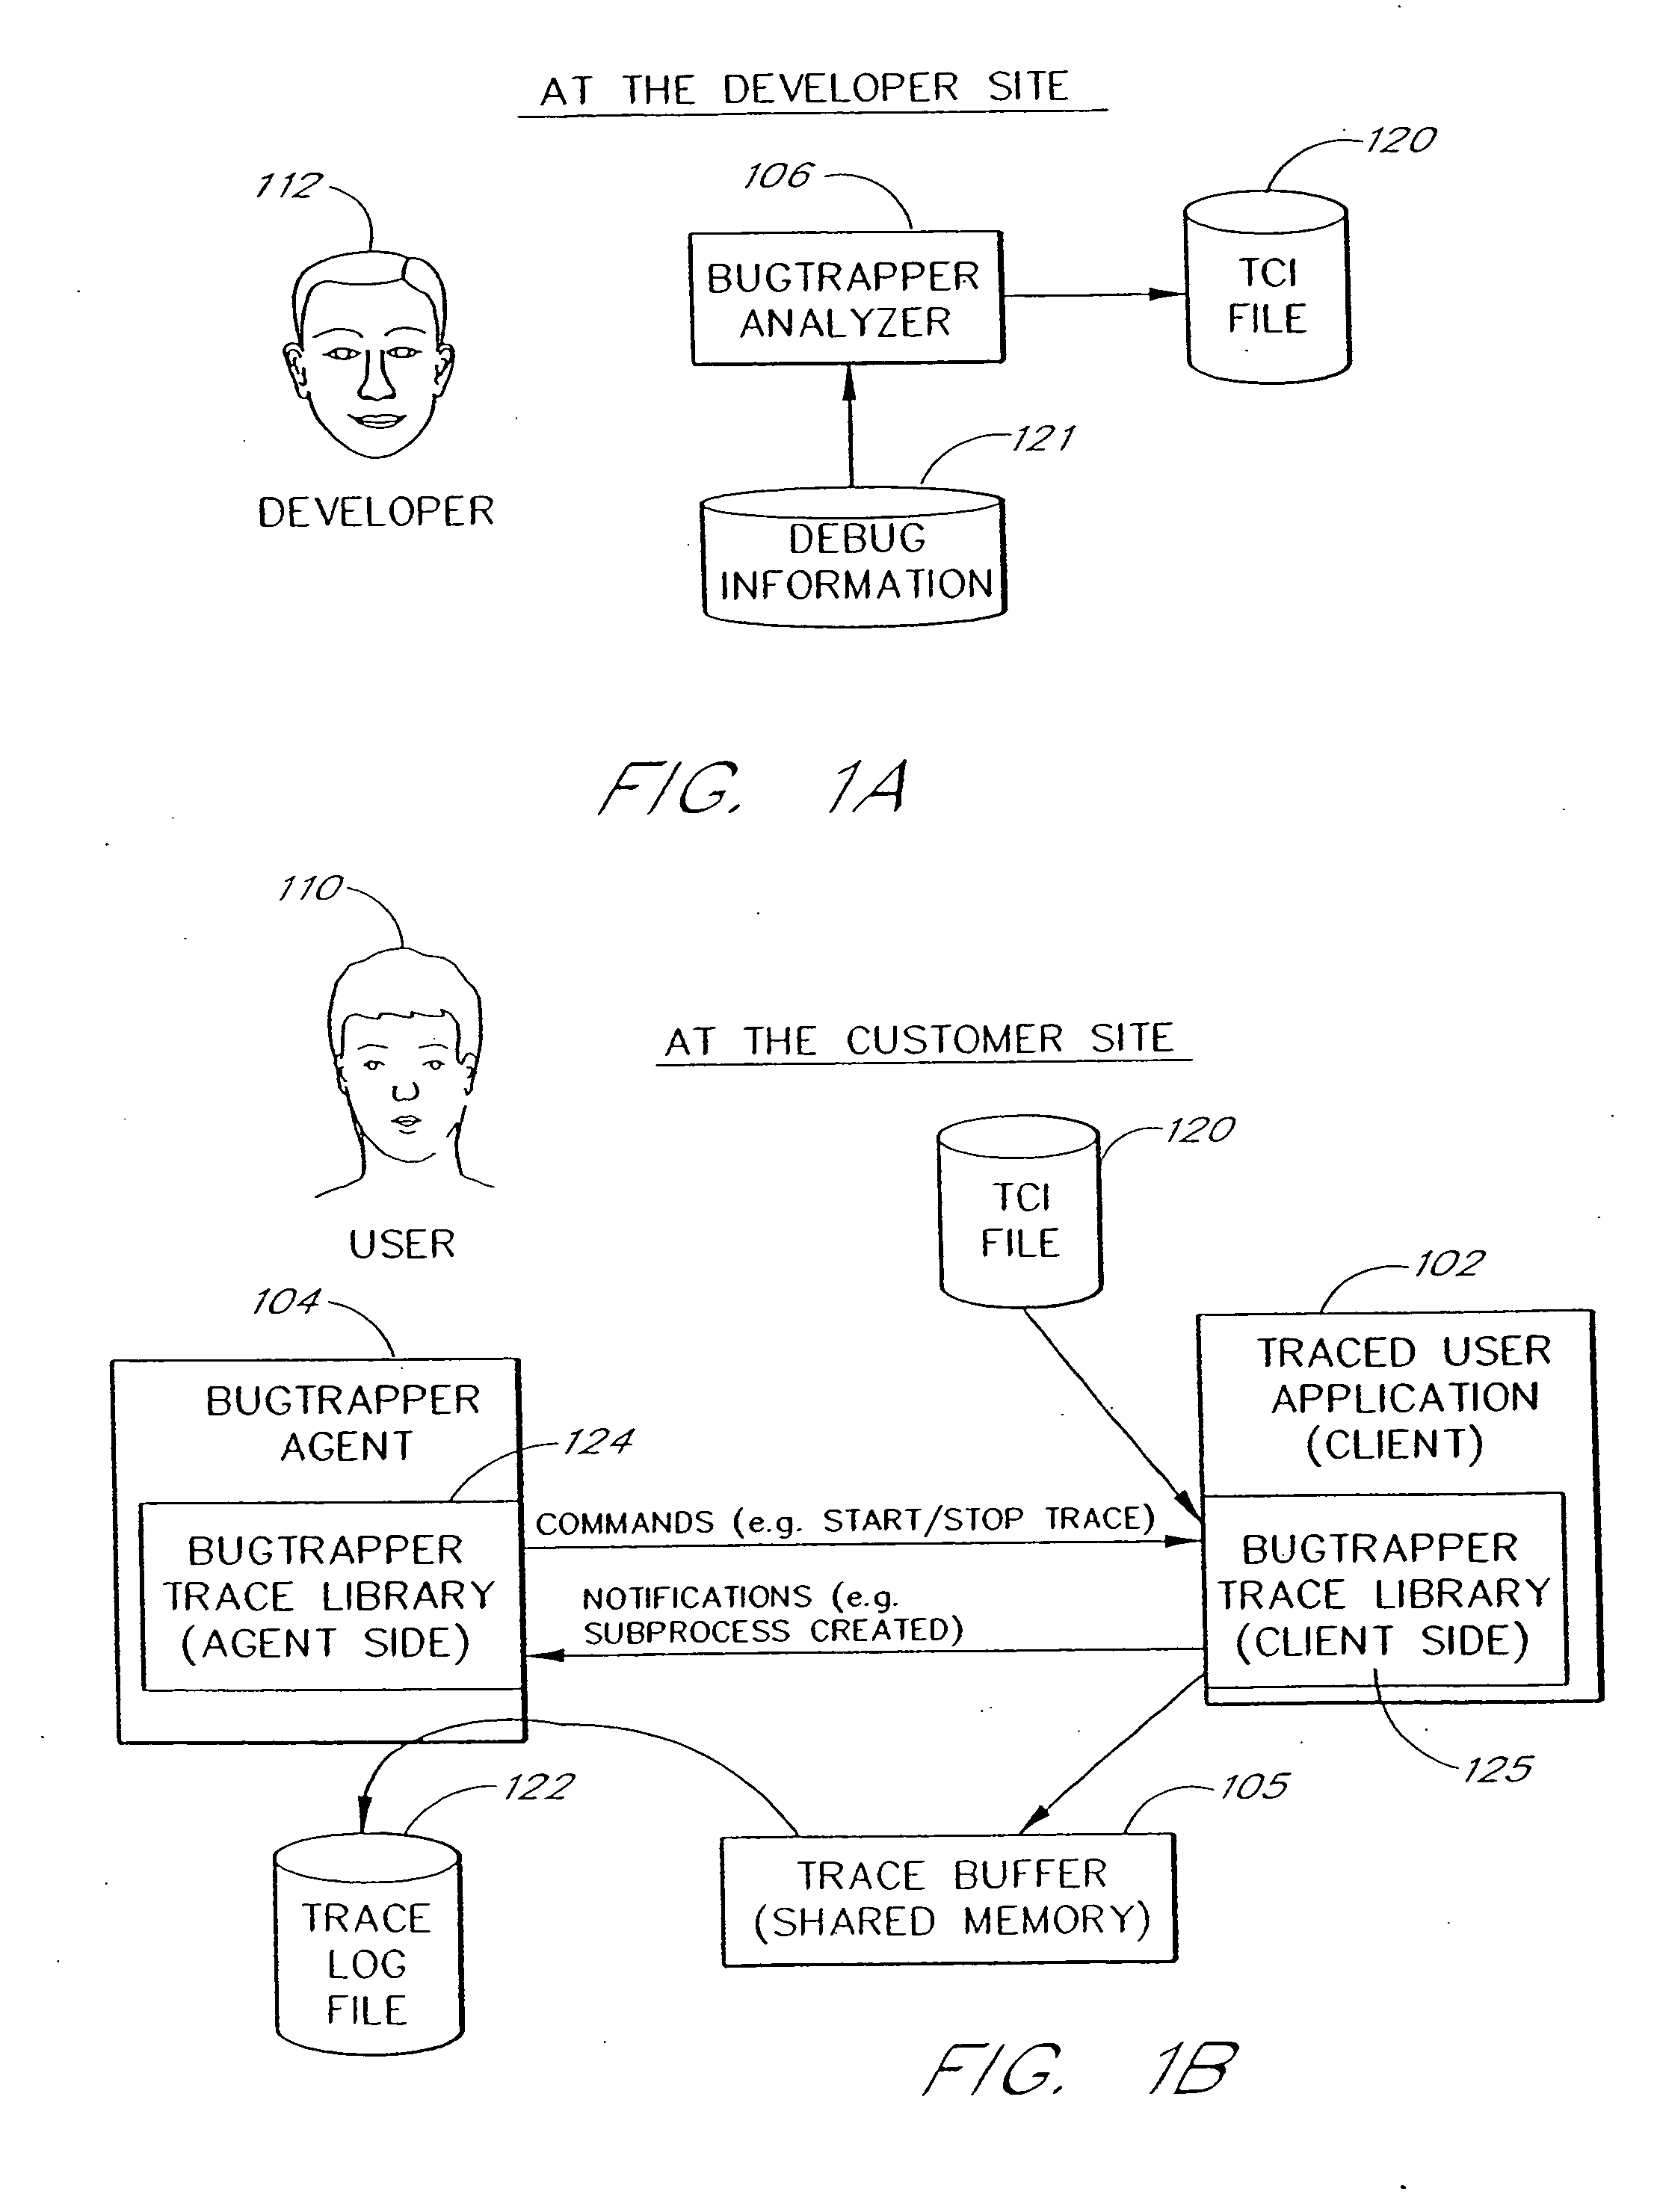
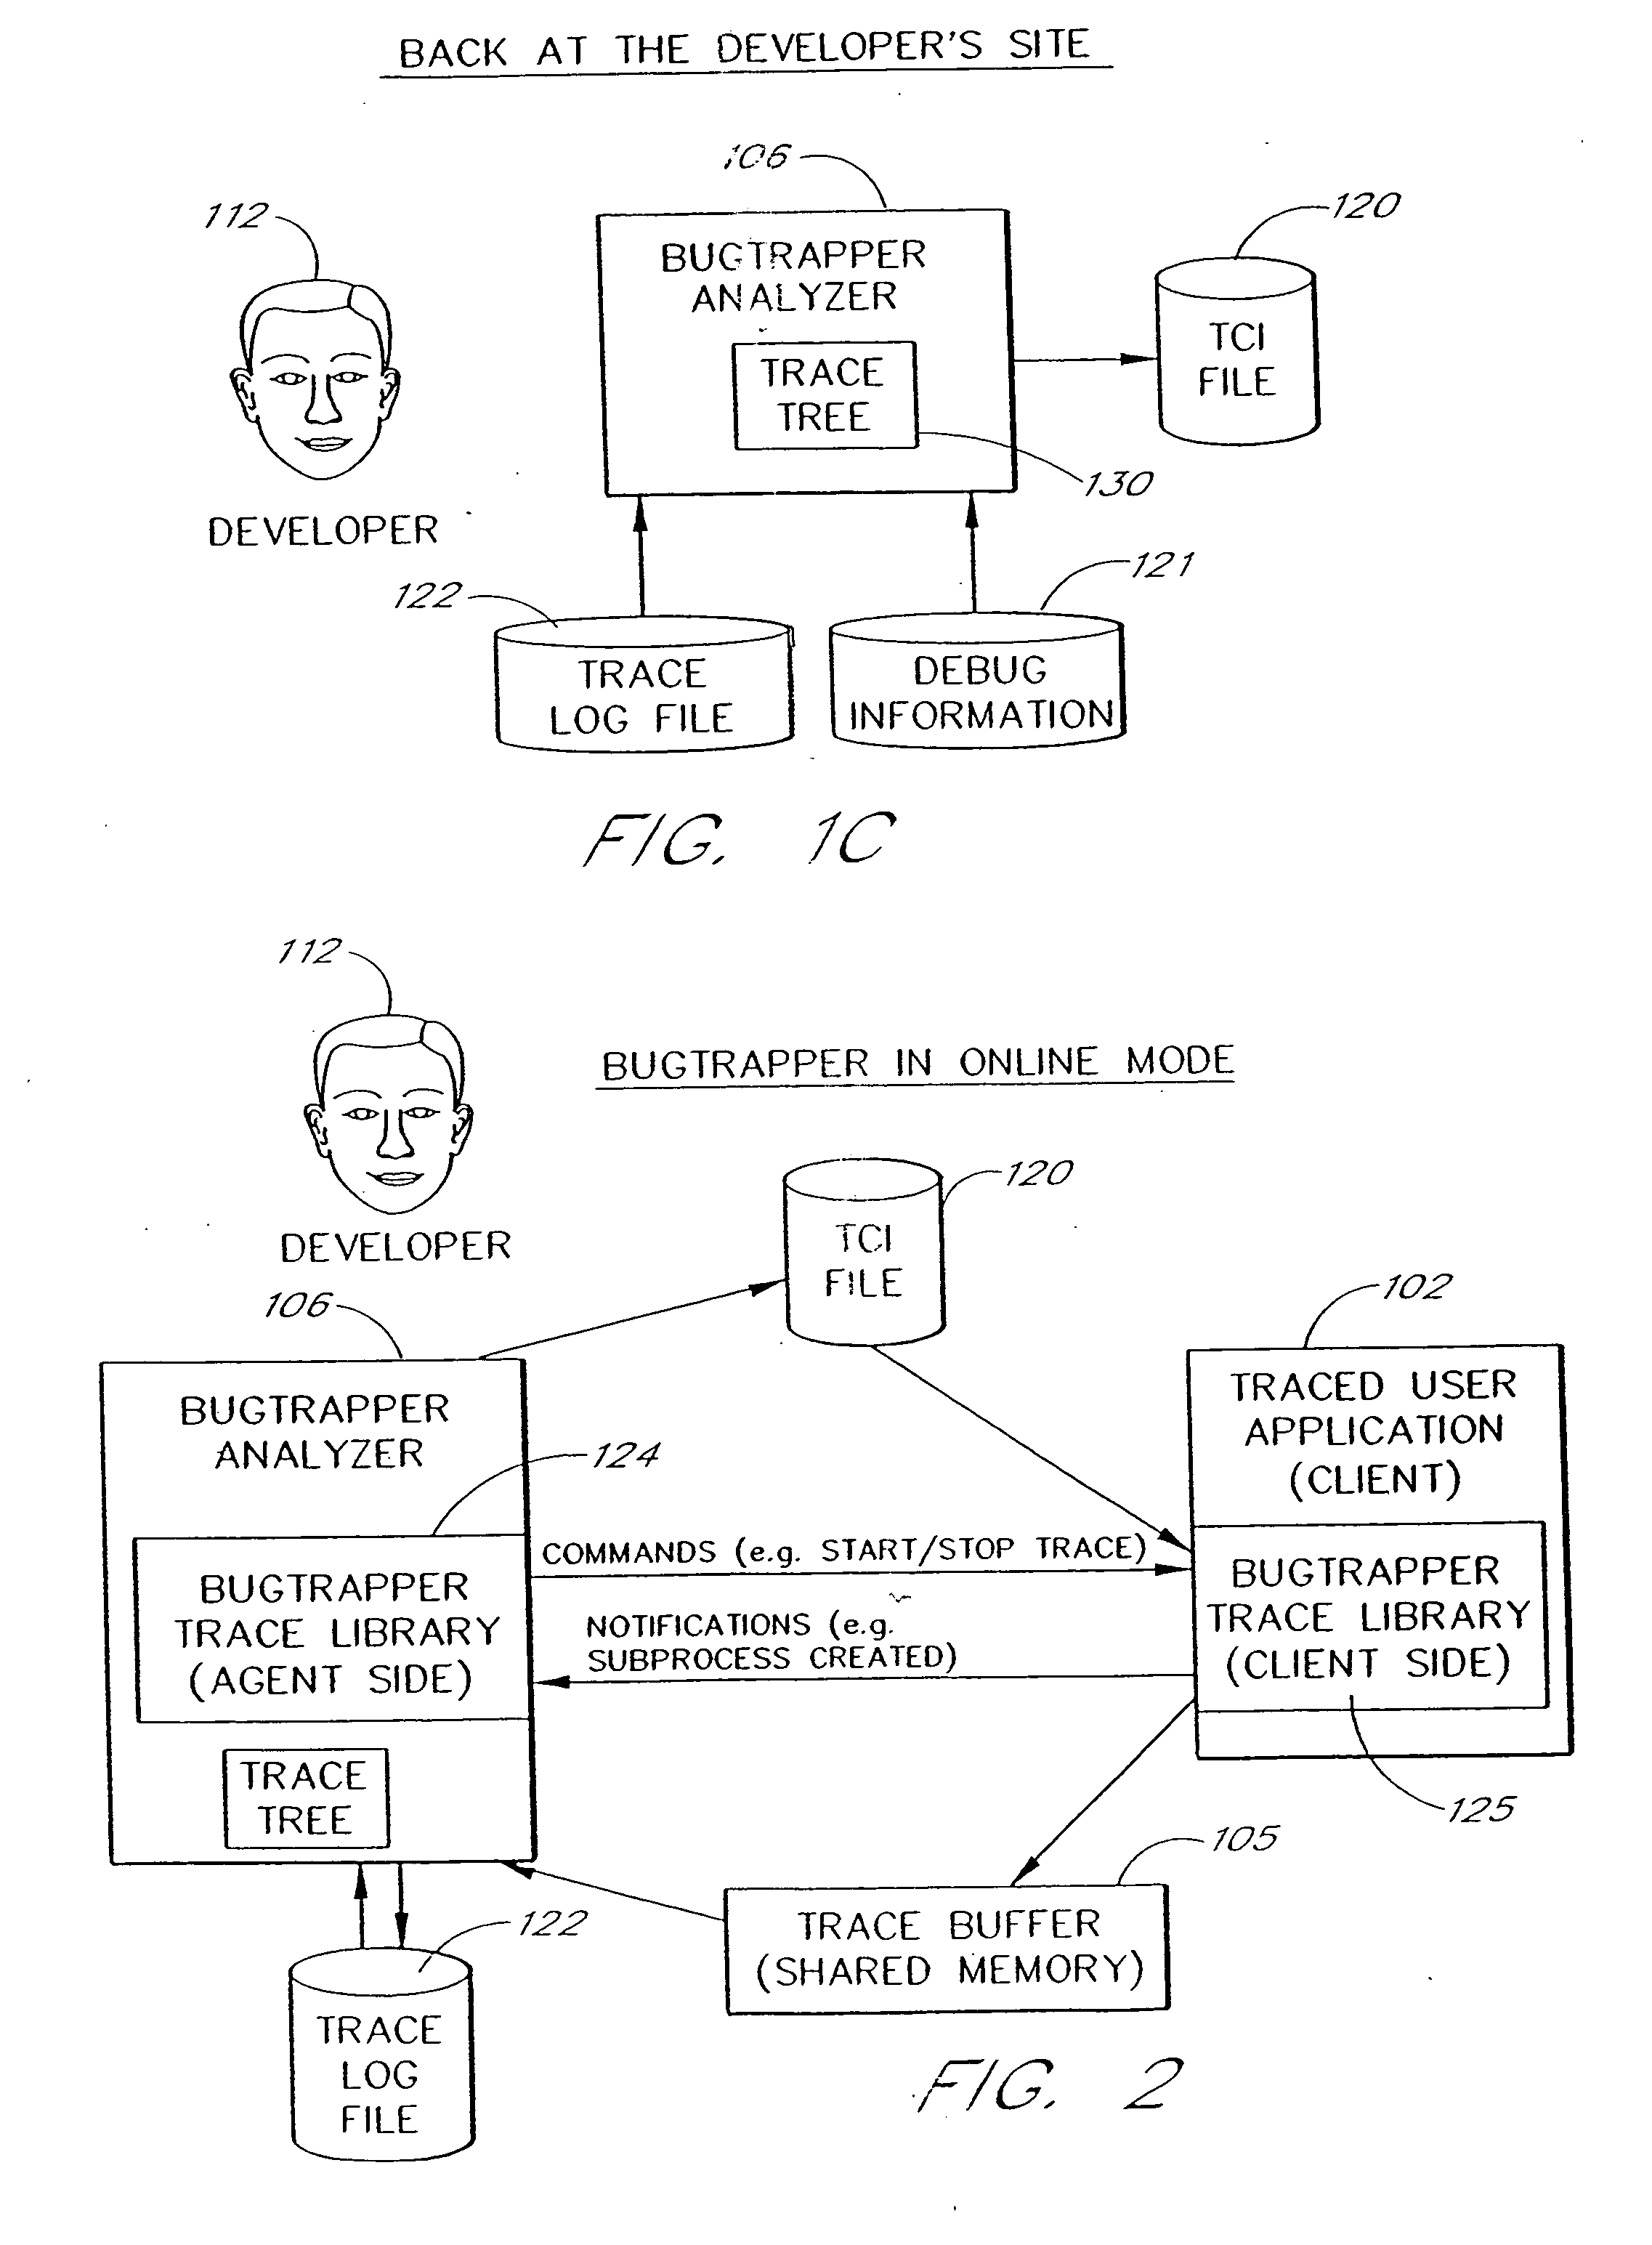
[0012] The present invention overcomes these and other problems associated with debugging and tracing the execution of computer programs. One aspect of the present invention is a software system that facilitates the process of identifying and isolating bugs within a client program by allowing a developer to trace the execution paths of the client using conditional tracing. The tracing can be performed without requiring modifications to the executable or source code files of the client program. Preferably, the trace data collected during the tracing operation is collected according to instructions in a trace control dataset, which is preferably stored in a Trace Control Information (TCI) file. The trace control dataset can include data specifying triggers, actions, and / or conditions related to the trigger and actions. Typically, the developer generates the TCI file by using a trace options editor program having a graphical user interface. The options editor displays the client's source code representation on a display screen together with controls that allow the software developer to interactively specify the source code and data elements to be traced. The options editor may use information created by a compiler or linker, such as debug information, in order to provide more information about the client and thereby make the process of selecting trace options easier. Once the trace options are selected, the client is run on a computer, and a tracing library is used to attach to the memory image of the client (the client process). The tracing library is configured to monitor execution of the client, and to collect trace data, based on selections in the trace options. The trace data collected by the tracing library is written to an encoded buffer in memory. The data in the buffer may optionally be saved to a trace log file for later use.
[0013] The developer then uses a trace analyzer program, also having a graphical user interface, to decode the trace information into a human-readable form, again using the debug information, and displays translated trace information on the display screen to allow the developer to analyze the execution of the client program. In a preferred embodiment, the trace options editor and the trace analyzer are combined into a single program called the analyzer. The analyzer is preferably configured to run under the control of a multi-process operating system and to allow the developer to trace multiple threads and multiple processes. The tracing library is preferably configured to run in the same process memory space as the client thereby tracing the execution of the client program without the need for context switches.
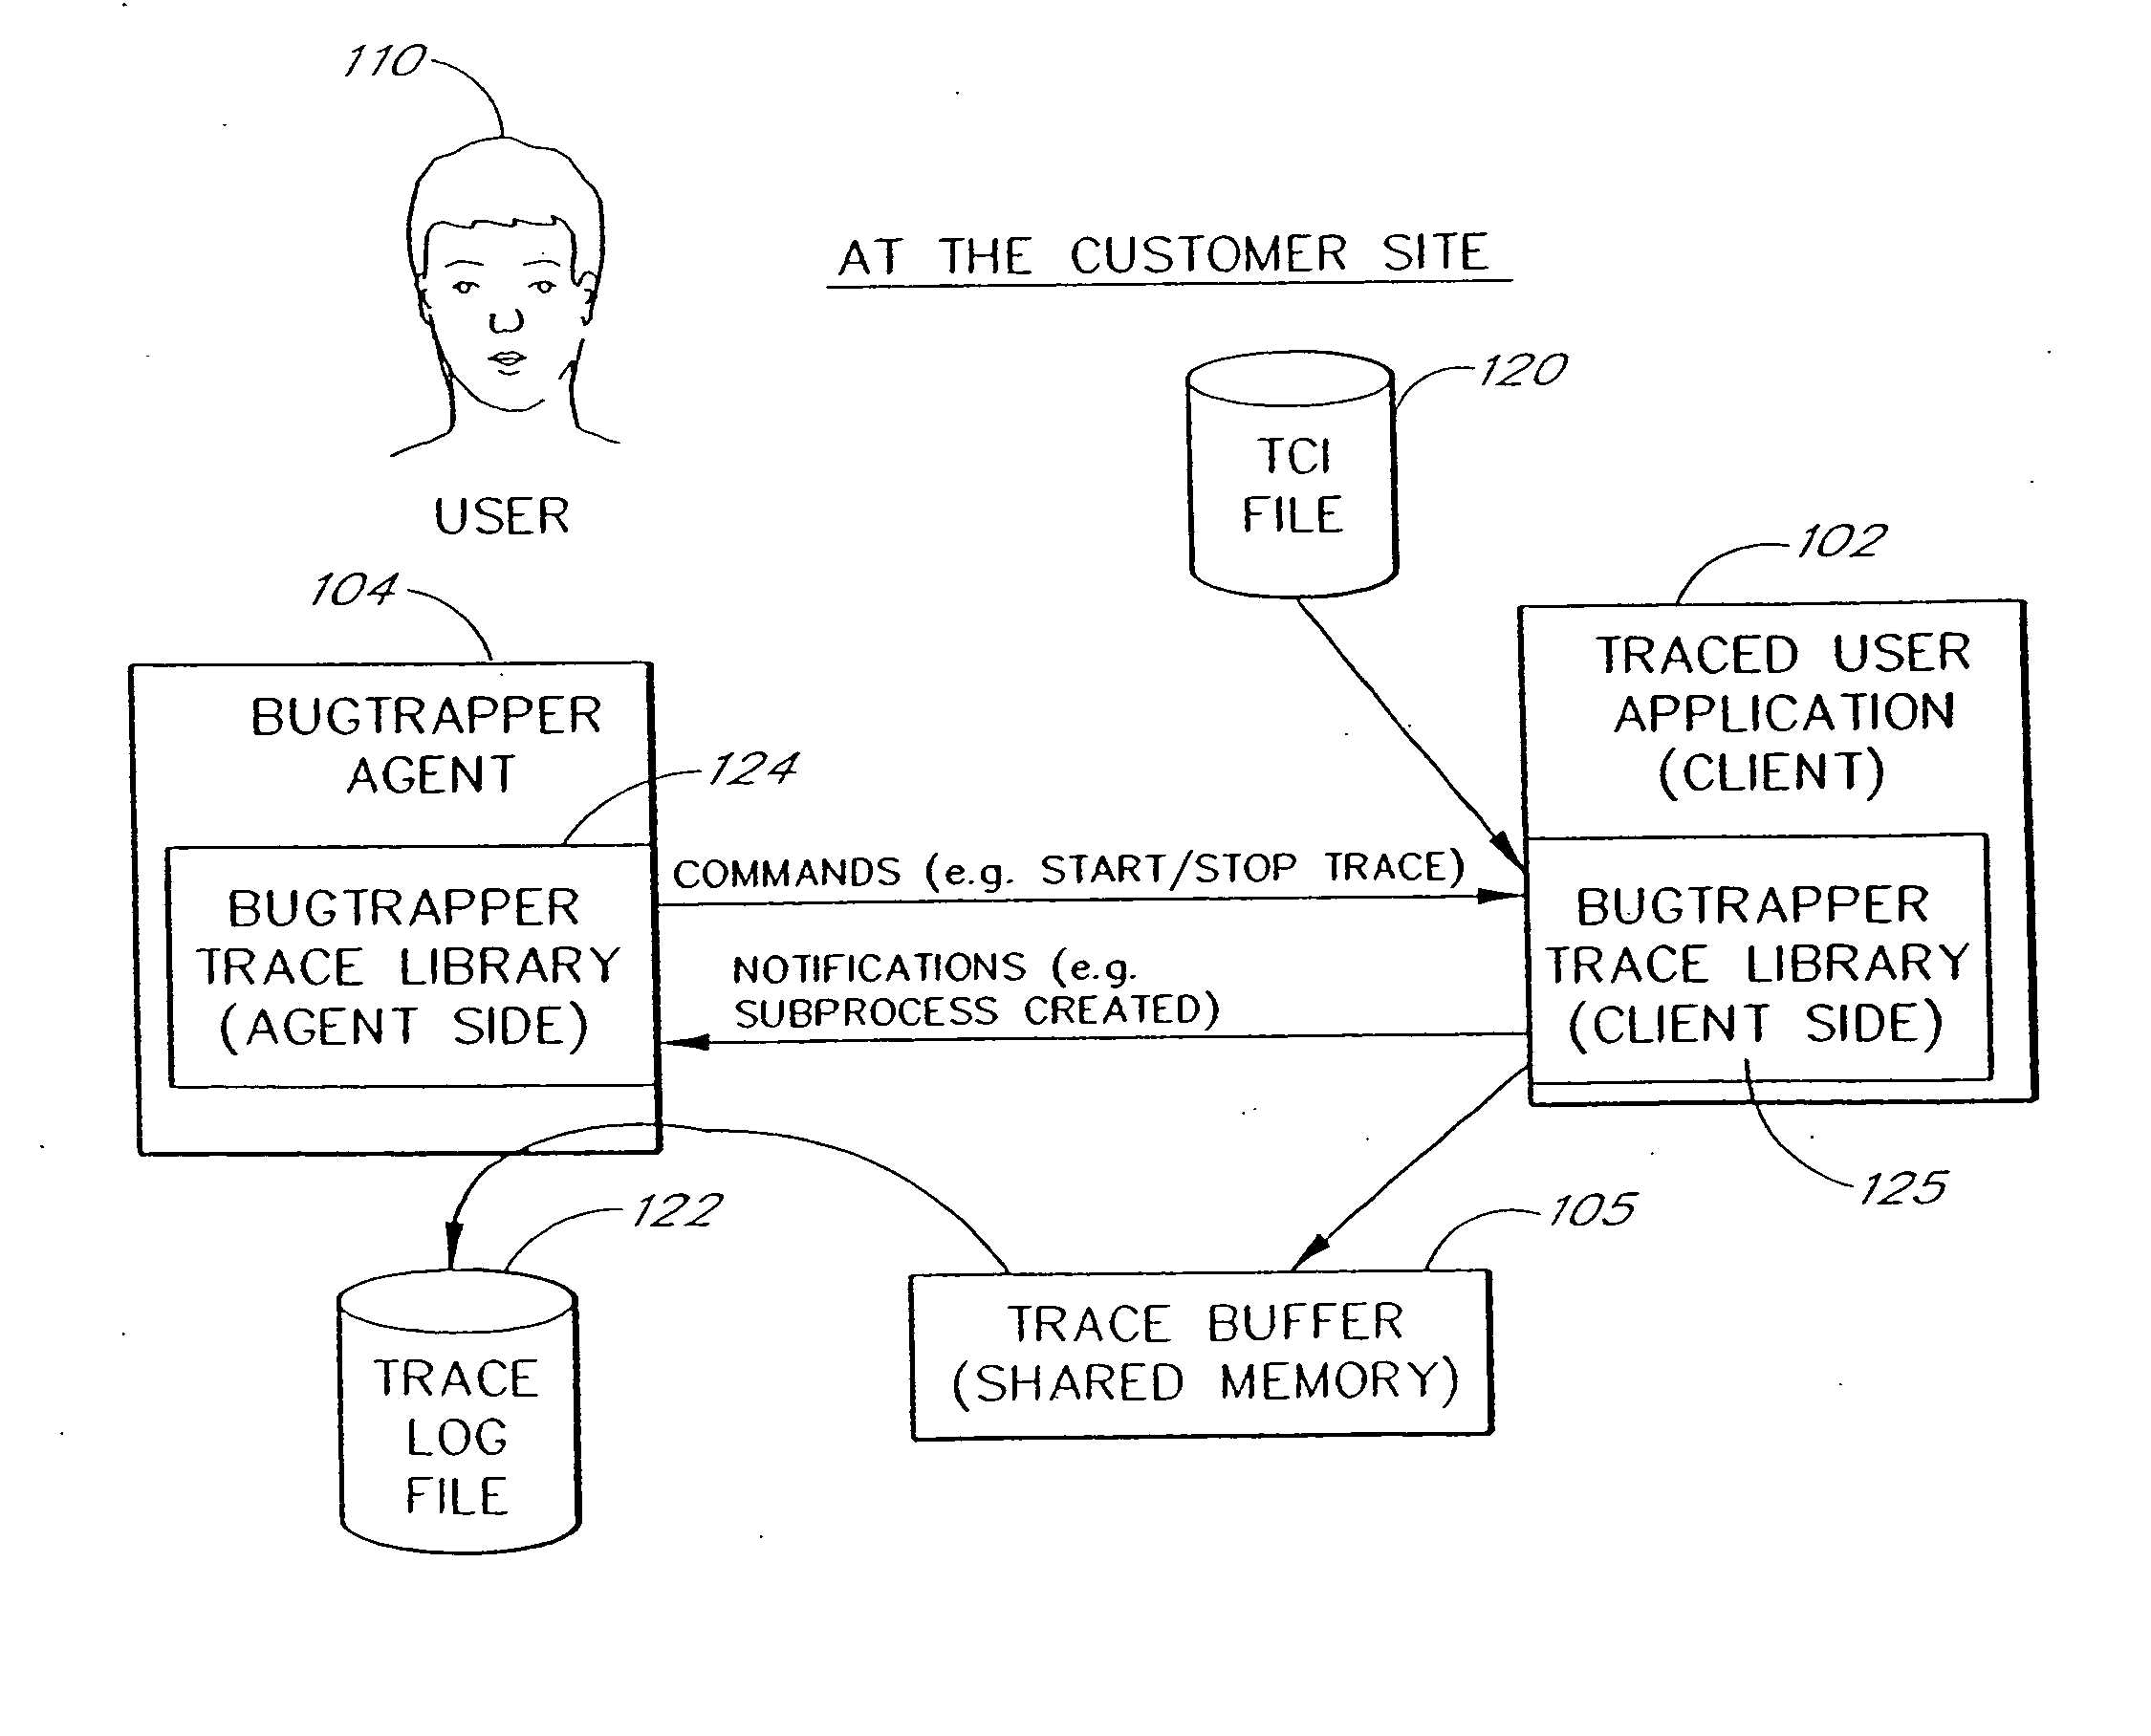
[0014] In one embodiment, the software system provides a remote mode that enables the client program to be traced at a remote site, such as by the customer at a remote customer site, and then analyzed at the developer site. When the remote mode is used, the developer sends the TCI file for the particular client to a remote user site together with a small executable file called the tracing “agent.” The agent is adapted to be used at the remote user site as a stand-alone tracing component that enables a remote customer, who does not have access to the source code of the client, to generate a trace file that represents execution of the client application at the remote site. The trace file is then sent to the developer site (such as by email), and is analyzed by the software developer using the analyzer. The remote mode thus enables the software developer to analyze how the client program is operating at the remote site, without the need to visit the remote site, and without exposing to the customer the source code or other confidential details of the client program.
[0016] In one embodiment, using conditional tracing, the user / programmer can control the tracing process and / or change the behavior of the tracer depending on certain events in the traced application. Conditional tracing can be used to reduce the size of the trace data generated and stored (i.e., the size of the trace file), and increases the likelihood that the stored trace information will be relevant to a particular problem that is being diagnosed. In one embodiment, the conditional tracing allows debugging to be controlled external to the application being debugged without the need for programming special trace functions in to the application being debugged.
[0017] In one embodiment, conditional tracing provides a mechanism for event-driven debugging of complex applications with evasive bugs. In one embodiment, conditional tracing allows the user to start or stop the tracing of the application after calling a certan funtion. In one embodiment, conditional tracing allows the user to show a stack call that precedes the call of a certain function. In one embodiment, conditional tracing allows the user to get information on threads and processes of a complex system at important synchronization points. In one embodiment, conditional tracing allows the user to perform screen captures (e.g., upon a system crash). In one embodiment, conditional tracing allows the user to start or stop tracing after some time interval. In one embodiment, conditional tracing allows the user to start or stop tracing after execution of certain statement. In one embodiment, conditional tracing allows the user to start or stop tracing after assignment of a specific value to a certain variable.

Problems solved by technology

Two significant problems arise in using this model.
Setting such a breakpoint can be difficult when working with an event-driven system (such as the Microsoft Windows® operating system), because the developer does not always know which of the event handlers (callbacks) will be called.
The second problem is that some bugs give rise to actual errors only during specific execution conditions, and these conditions cannot always be reproduced during the debugging process.
For example, a program error that occurs during normal execution may not occur during execution under the debugger, since the debugger affects the execution of the program.
An example of this second type of problem is commonly encountered when software developers attempt to diagnose problems that have been identified by customers and other end users.
Quite often, software problems appear for the first time at a customer's site.
When trying to debug these problems at the development site (typically in response to a bug report), the developer often discovers that the problem cannot be reproduced.
Distributed, client / server, and parallel systems, especially multi-threaded and multi-process systems, are notorious for having non-reproducible problems because these systems depend heavily on timing and synchronization sequences that cannot easily be duplicated.
When a bug cannot be reproduced at the development site, the developer normally cannot use a debugger, and generally must resort to the tedious, and often unsuccessful, task of manually analyzing the source code.
Unfortunately, sending a developer to a customer's site is often prohibitively time consuming and expensive, and the process of setting up a debugging environment (source code files, compiler, debugger, etc.) at the customer site can be burdensome to the customer.
Unfortunately, the imbedded code solution depends on inserting the tracing code into the source prior to compiling and linking the shipped version of the application.
Trying to anticipate where a bug will occur is, in general, a futile task.
Often there is no imbedded code where it is needed, and once the application has been shipped it is too late to add the desired code.
Another drawback of current monitoring systems is the inability to correctly handle parallel execution, such as in a multiprocessor system.
Using serial techniques for parallel systems may cause several problems.
First, the sampling activity done in the various parallel entities (threads or processes) may interfere with each other (e.g., the trace data produced by one entity may be over written by another entity).
Second, the systems used to analyze the trace data cannot assume that the trace is sequential.
Displaying the trace data as a separate calling tree for each entity is not appropriate, as this does not reveal when, during the execution, contexts switches were done between the various parallel entities.

Method used


Image

  • System and method for conditional tracing of computer programs
  • System and method for conditional tracing of computer programs
  • System and method for conditional tracing of computer programs

Examples


Embodiment Construction

[0043] The present invention provides a new model for tracing the execution path of and debugging a computer program. In the preferred embodiment of the invention, this tracing model is implemented within a set of tracing and debugging tools that are collectively referred to as the BugTrapper system (“BugTrapper”). The BugTrapper tools are used to monitor and analyze the execution of a computer program, referred to as a client. One feature of the BugTrapper is that it does not require special instructions or commands to be imbedded within the source code of the client, and it does not require any modifications to be made to the source or executable files of the client. “Tracing,” or “to trace,” refers generally to the process of using a monitoring program to monitor and record information about the execution of the client while the client is running. A “trace” generally refers to the information recorded during tracing. Unlike conventional debuggers that use breakpoints to stop the ...


PUM


Abstract

A software system is disclosed which facilitates the process of tracing the execution paths of a program, called the client. The tracing is performed without requiring modifications to the executable or source code files of the client. Trace data collected during the tracing operation is collected according to instructions in a trace options file. At run time, the tracing library attaches to the memory image of the client. The tracing library is configured to monitor execution of the client and to collect trace data, based on selections in the trace options file. Conditional tracing, through the use of triggers and actions taken in response to the triggers, allows the developer to control the tracing operation. The triggers can be conditional triggers in which the corresponding action is taken only if a conditional expression is satisfied. The system can trace multiple threads and multiple processes. The tracing system provides a remote mode and an online mode. In remote mode, the developer sends the trace control information (which can include triggers and corresponding actions) to a remote user site together with a small executable image called the agent that enables a remote customer, to generate a trace file that represents execution of the client application at the remote site. In online mode, the developer can generate trace options (including triggers and corresponding actions), run and trace the client, and display the trace results in near real-time on the display screen during execution of the client program.

Description

REFERENCE TO RELATED APPLICATIONS [0001] The present application is a continuation of application Ser. No. 10 / 057,002, filed Jan. 24, 2002, titled “SYSTEM AND METHOD FOR CONDITIONAL TRACING OF COMPUTER PROGRAMS, which is a continuation-in-part of application Ser. No. 09 / 923,972, filed Aug. 7, 2001, titled “SYSTEM AND METHOD FOR CONDITIONAL TRACING OF COMPUTER PROGRAMS,” which is a continuation of application Ser. No. 09 / 748,752, filed Dec. 26, 2000, titled “SYSTEM AND METHOD FOR CONDITIONAL TRACING OF COMPUTER PROGRAMS,” the disclosures of which are incorporated herein by reference in their entirety.BACKGROUND OF THE INVENTION [0002] 1. Field of the Invention [0003] The present invention relates to software tools for assisting software developers in the task of monitoring and analyzing the execution of computer programs, such as during the debugging process. [0004] 2. Description of the Related Art [0005] Despite the significant diversity in software tracing and debugging programs (...

Claims


Application Information

Patent Timeline
IPC IPC(8): G06F9/44
CPCG06F11/3636
Inventor WYGODNY, SHLOMOGOLENDER, VALERYBEN-MOSHE, IDOANDREEV, VLADIMIR
Owner BMC SOFTWARE ISRAEL LTD
Why Eureka
Eureka Blog
Learn More