
Methods and compositions for determining treatment regimens in systemic inflammatory response syndromes

a systemic inflammatory response and syndrome technology, applied in the field of systemic inflammatory response syndrome treatment regimens, can solve the problems of not being able to confirm 50% or more of patients exhibiting strong clinical evidence of sepsis, no diagnostic tools have been described to unambiguously distinguish sepsis related conditions, etc., and achieve the effect of increasing the discriminating power of marker panels

Inactive Publication Date: 2005-07-07
BIOSITE INC
View PDF31 Cites 131 Cited by
  • Summary
  • Abstract
  • Description
  • Claims
  • Application Information

AI Technical Summary

Benefits of technology

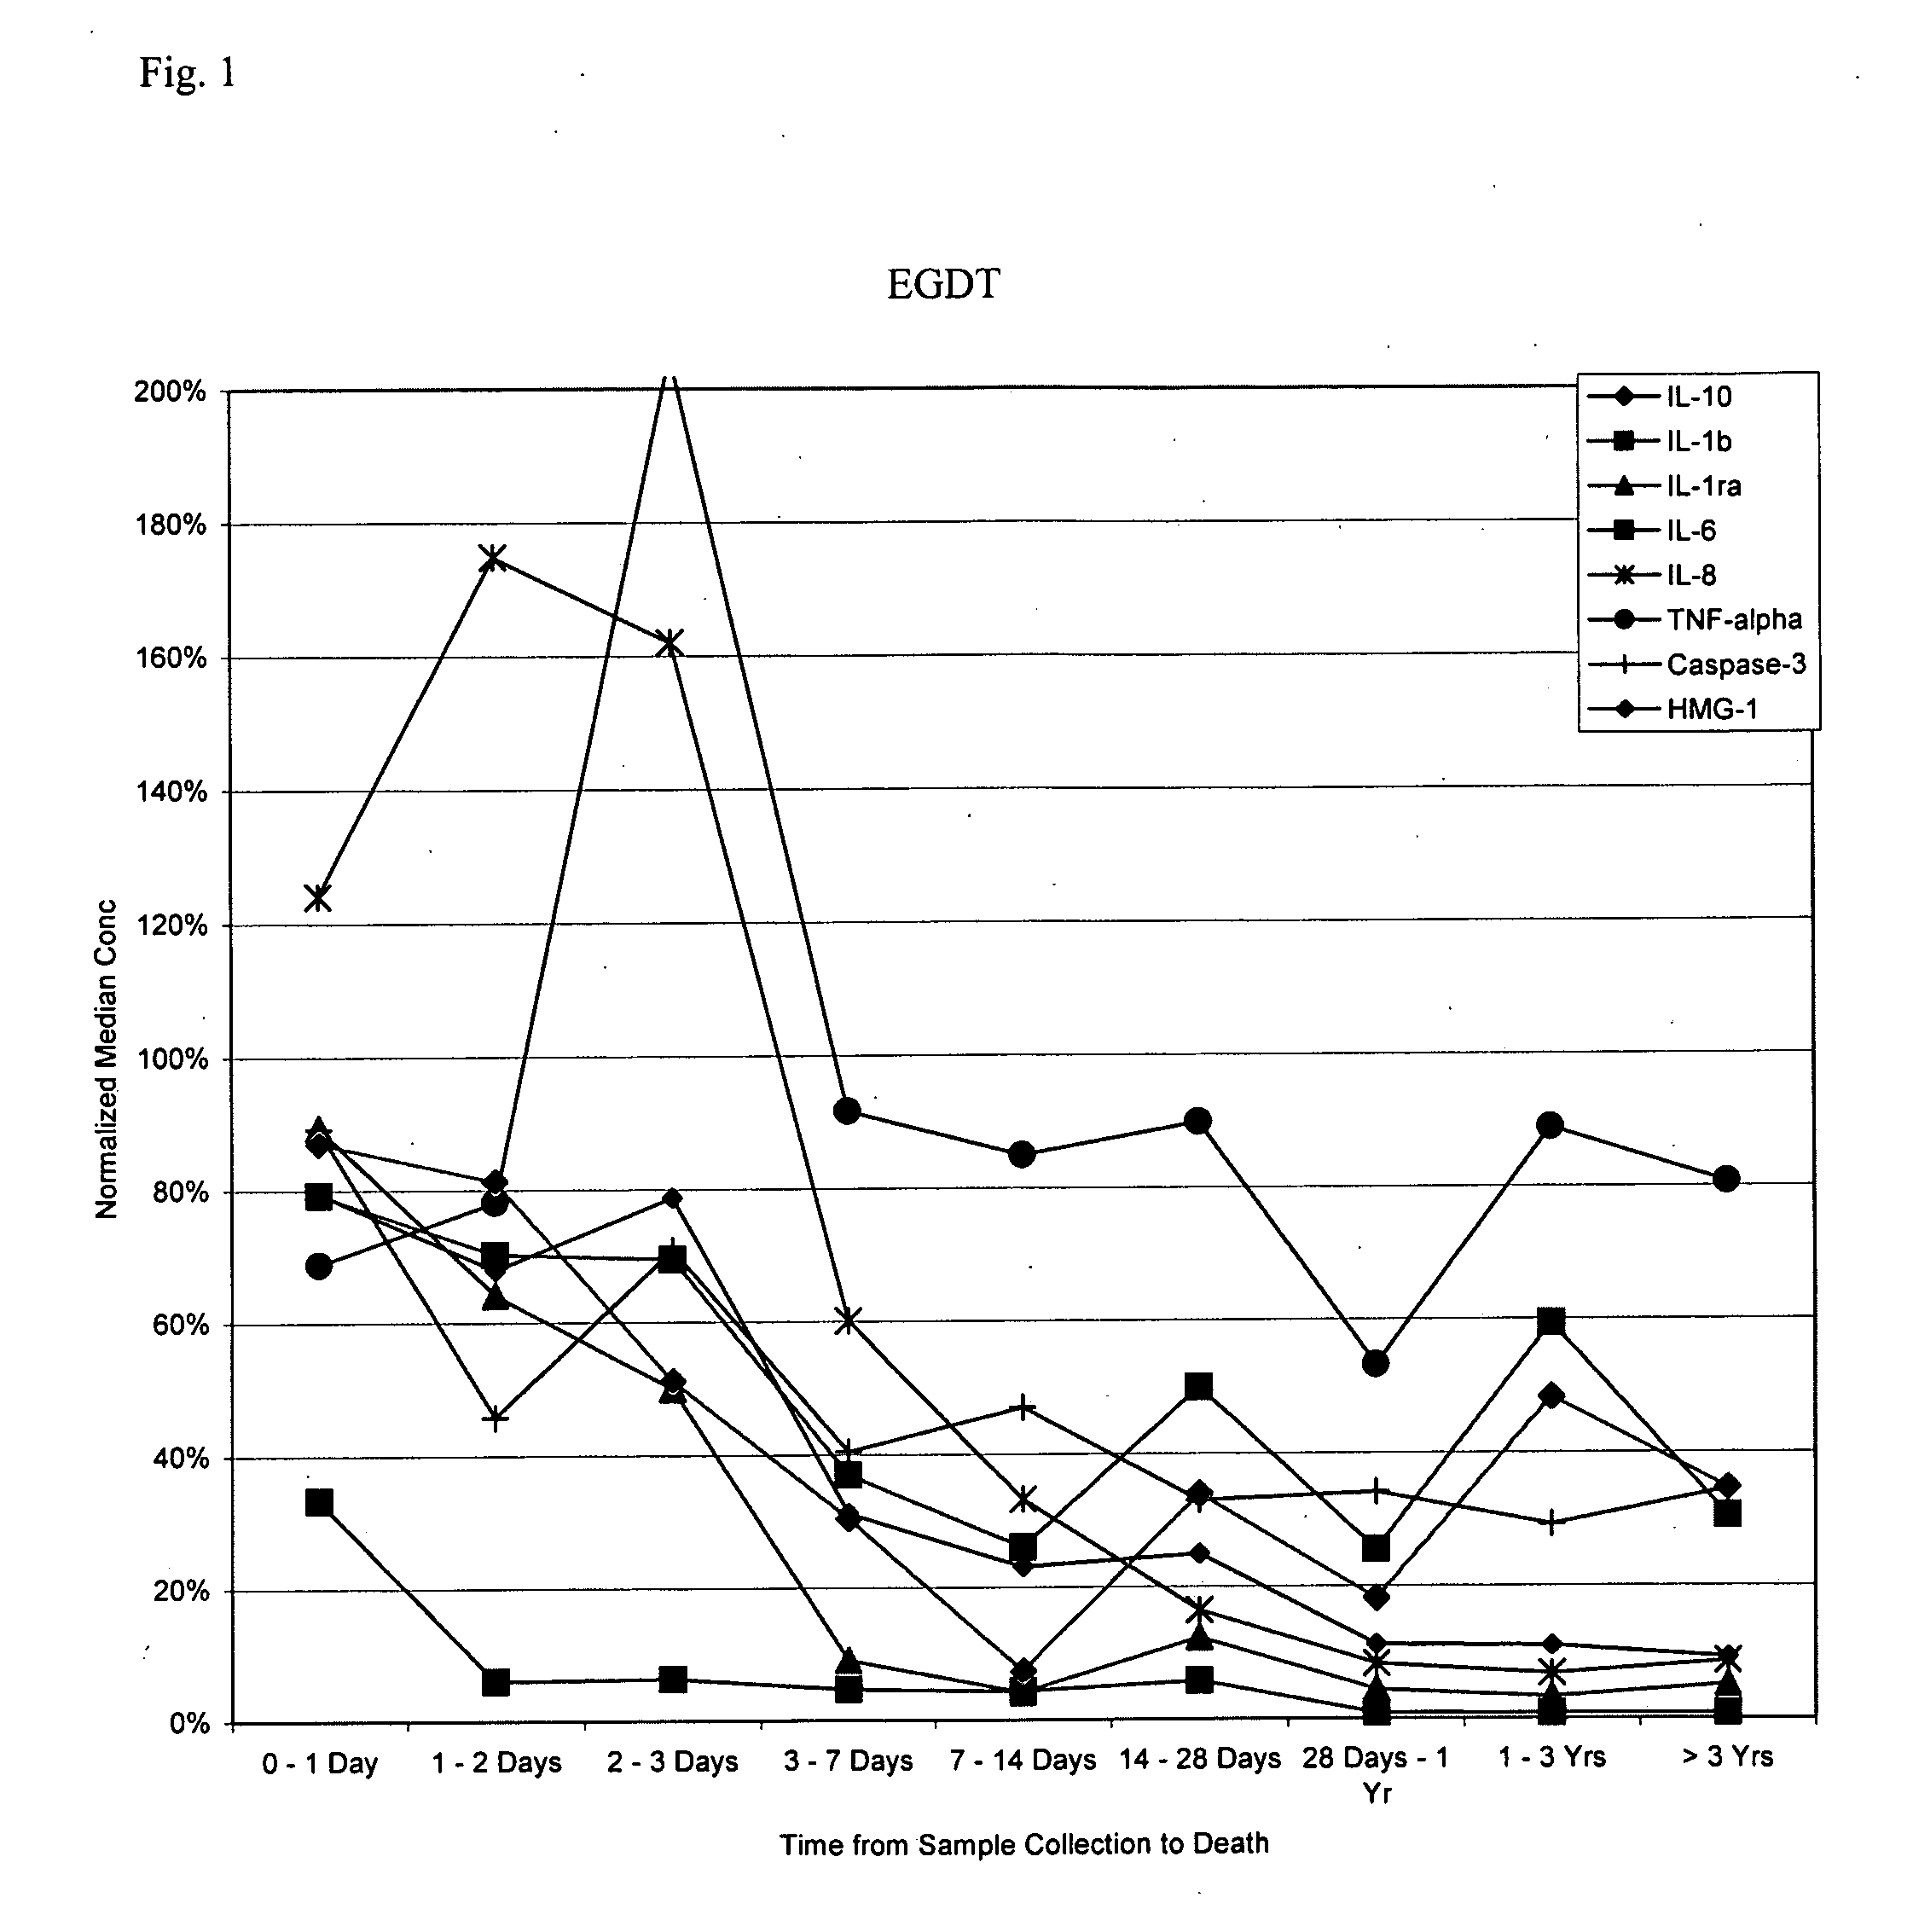
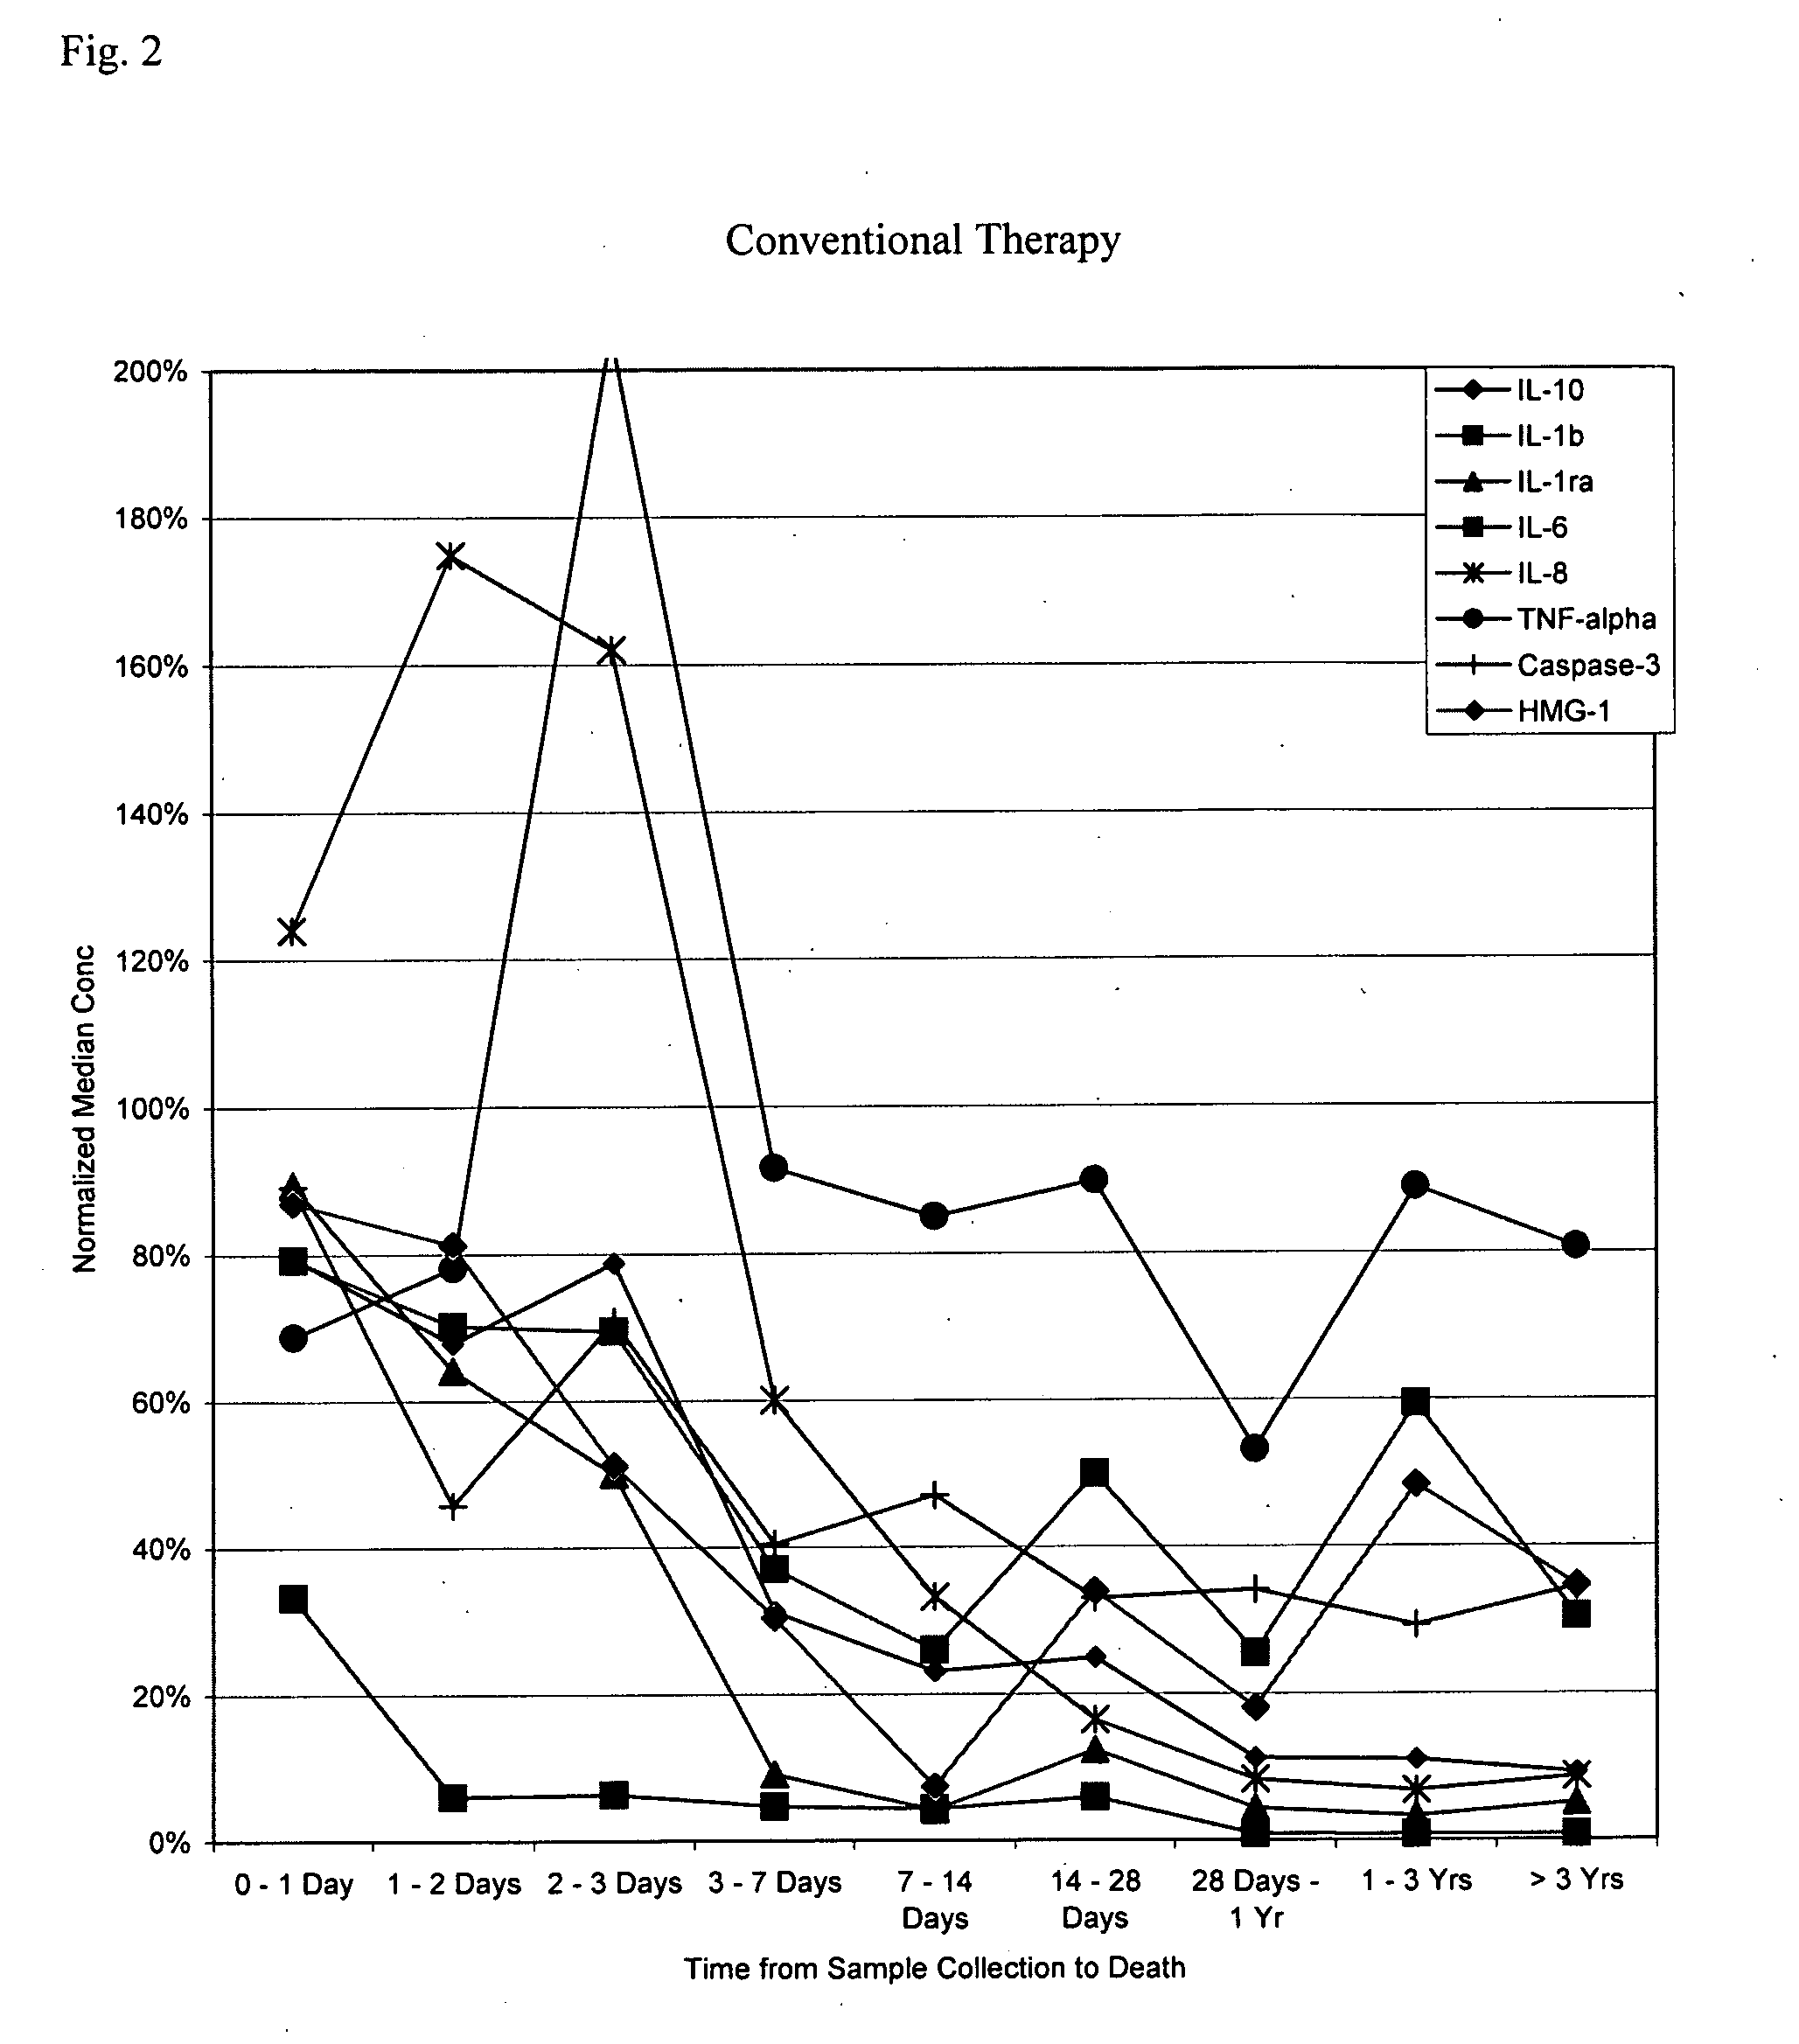
[0025] In yet other embodiments, multiple determinations of one or more markers can be made, and a temporal change in the markers can be used to rule in or out one or more particular therapies and / or prognoses. For example, one or more markers may be determined at an initial time, and again at a second time, and the change (or lack thereof) in the marker level(s) over time determined. In such embodiments, an increase in the marker from the initial time to the second time may be indicative of a particular prognosis, rule in or out a particular therapy, etc. Likewise, a decrease in the marker from the initial time to the second time may be indicative of a particular prognosis, rule in or out a particular therapy, etc. In such a panel, the markers need not change in concert with one another. Temporal changes in one or more markers may also be used together with single time point marker levels to increase the discriminating power of marker panels. In yet another alternative, a “panel response” may be treated as a marker, and temporal changes in the panel response may be indicative of a particular prognosis, rule in or out a particular therapy, etc.

Problems solved by technology

Because of clinical similarities to inflammatory responses secondary to non-infectious etiologies, identifying sepsis has been a particularly challenging diagnostic problem.
While conceptually it may be relatively simple to distinguish between sepsis and non-septic SIRS, no diagnostic tools have been described to unambiguously distinguish these related conditions.
Such culture has been reported, however, to fail to confirm 50% or more of patients exhibiting strong clinical evidence of sepsis.
Unchecked, the uncontrolled inflammatory response created can lead to ischemia, loss of organ function, and death.
Despite the availability of antibiotics and supportive therapy, sepsis represents a significant cause of morbidity and mortality.

Method used


Image

  • Methods and compositions for determining treatment regimens in systemic inflammatory response syndromes
  • Methods and compositions for determining treatment regimens in systemic inflammatory response syndromes

Examples


example 1

Subject Population

[0261] The subjects in the following examples are a subset of those reported in Rivers et al., N. Engl. J. Med. 345: 1368-77, 2001, which is hereby incorporated in its entirety. Samples were obtained at admission, and the subjects were then subdivided into two random groups, one of which received standard sepsis therapies, the other of which received an early goal-directed therapy (“EGDT”) regimen devised by the authors. In general, blood specimens are collected by trained study personnel using EDTA as the anticoagulant and centrifuged for greater than or equal to 10 minutes. The plasma component is transferred into a sterile cryovial and frozen at −20° C. or colder. Clinical histories are available for each of the patients to aid in the statistical analysis of the assay data.

example 2

Biochemical Analyses

[0262] Markers are measured using standard immunoassay techniques. These techniques involved the use of antibodies to specifically bind the protein targets. A monoclonal antibody directed against a selected marker is biotinylated using N-hydroxysuccinimide biotin (NHS-biotin) at a ratio of about 5 NHS-biotin moieties per antibody. The antibody-biotin conjugate is then added to wells of a standard avidin 384 well microtiter plate, and antibody conjugate not bound to the plate is removed. This forms the “anti-marker” in the microtiter plate. Another monoclonal antibody directed against the same marker is conjugated to alkaline phosphatase using succinimidyl 4-[N-maleimidomethyl]-cyclohexane-1-carboxylate (SMCC) and N-succinimidyl 3-[2-pyridyldithio]propionate (SPDP) (Pierce, Rockford, Ill.).

[0263] Immunoassays are performed on a TECAN Genesis RSP 200 / 8 Workstation. Biotinylated antibodies are pipetted into microtiter plate wells previously coated with avidin and ...

example 3

Marker Panels for Assignment of Therapy in SIRS

[0265] Using the methods described in PCT application no. US03 / 41426, filed Dec. 23, 2003, exemplary panels for risk stratification is SIRS were identified. Starting with a large number of potential markers, an iterative procedure was applied. In this procedure, individual threshold concentrations for the markers are not used as cutoffs per se, but are used as values to which the assay values for each patient are compared and normalized. Rather, a “window” of assay values between a minimum and maximum marker concentration (calculated as midpoint±midpoint×linear range in the tables below) is determined. Measured marker concentrations above the maximum are assigned a value of 1 and measured marker concentrations below the minimum are assigned a value of 0; measured marker concentrations within the window are linearly interpolated to a value of between 0 and 1. The value is then multiplied by a weighting factor (weight average in the tabl...


PUM

PropertyMeasurementUnit
Fractionaaaaaaaaaa
Fractionaaaaaaaaaa
Currentaaaaaaaaaa

Abstract

The present invention relates to methods and compositions for symptom-based differential diagnosis, prognosis, and determination of treatment regimens in subjects. In particular, the invention relates to methods and compositions selected to rule in or out SIRS, or for differentiating sepsis, severe sepsis, septic shock and / or MODS from each other and / or from non-infectious SIRS.

Description

[0001] The present application is a continuation in part of U.S. patent application Ser. No. 10 / 952,275 filed Sep. 27, 2004, entitled METHODS AND COMPOSITIONS FOR THE DIAGNOSIS OF SEPSIS (pending), which claims priority to U.S. Provisional Applications 60 / 507,113 filed Sep. 29, 2003, 60 / 532,777 filed Dec. 23, 2003, and 60 / 558,945 filed Apr. 2, 2004, each of which is hereby incorporated in its entirety and from each of which priority is hereby claimed.FIELD OF THE INVENTION [0002] The present invention relates to the identification and use of diagnostic markers related to sepsis. In a various aspects, the invention relates to methods and compositions for use in assigning a treatment pathway to subjects suffering from SIRS, sepsis, severe sepsis, septic shock and / or multiple organ dysfunction syndrome. BACKGROUND OF THE INVENTION [0003] The following discussion of the background of the invention is merely provided to aid the reader in understanding the invention and is not admitted to...

Claims


Application Information

Patent Timeline
IPC IPC(8): C12Q1/68G01N33/00G01N33/53G01N33/554G01N33/569
CPCC12Q1/6883G01N33/68G01N33/6893G01N2333/525G01N2800/60G01N2333/58G01N2333/585G01N2800/26G01N2333/54C12Q2600/118C12Q2600/158
Inventor BUECHLER, KENNETH F.ANDERBERG, JOSEPH MICHAELMCPHERSON, PAUL H.
Owner BIOSITE INC
Learn More