Use of high wavenumber raman spectroscopy for measuring tissue
A technology of organization and purpose, applied in optical radiation measurement, radiation pyrometry, spectrometry/spectrophotometry/monochromator, etc., can solve problems such as unsatisfactory signal-to-noise ratio
- Summary
- Abstract
- Description
- Claims
- Application Information
AI Technical Summary
Problems solved by technology
Method used
Image


Examples
Embodiment 1
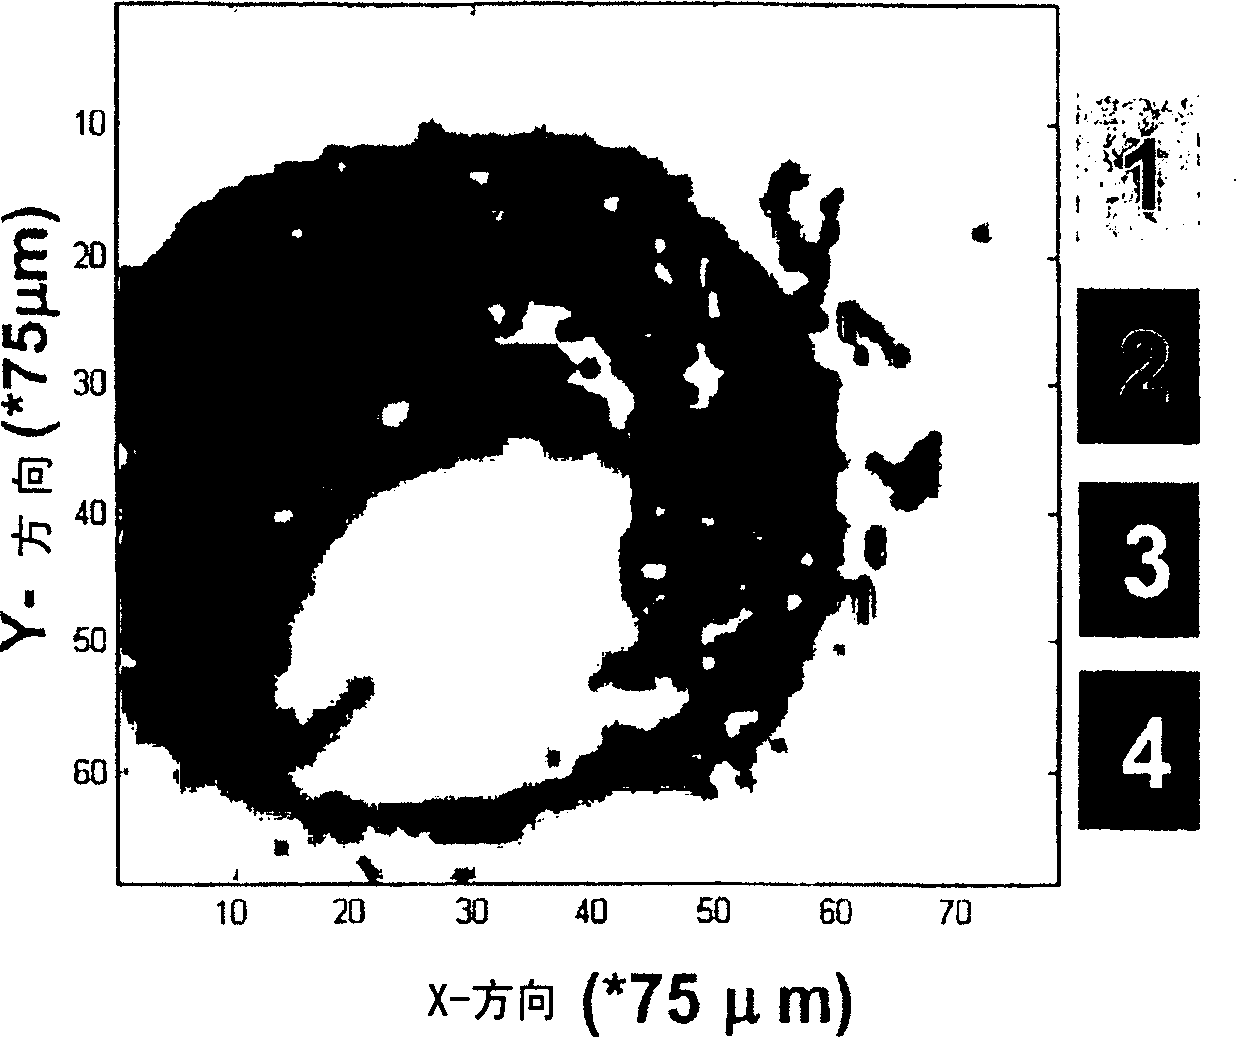
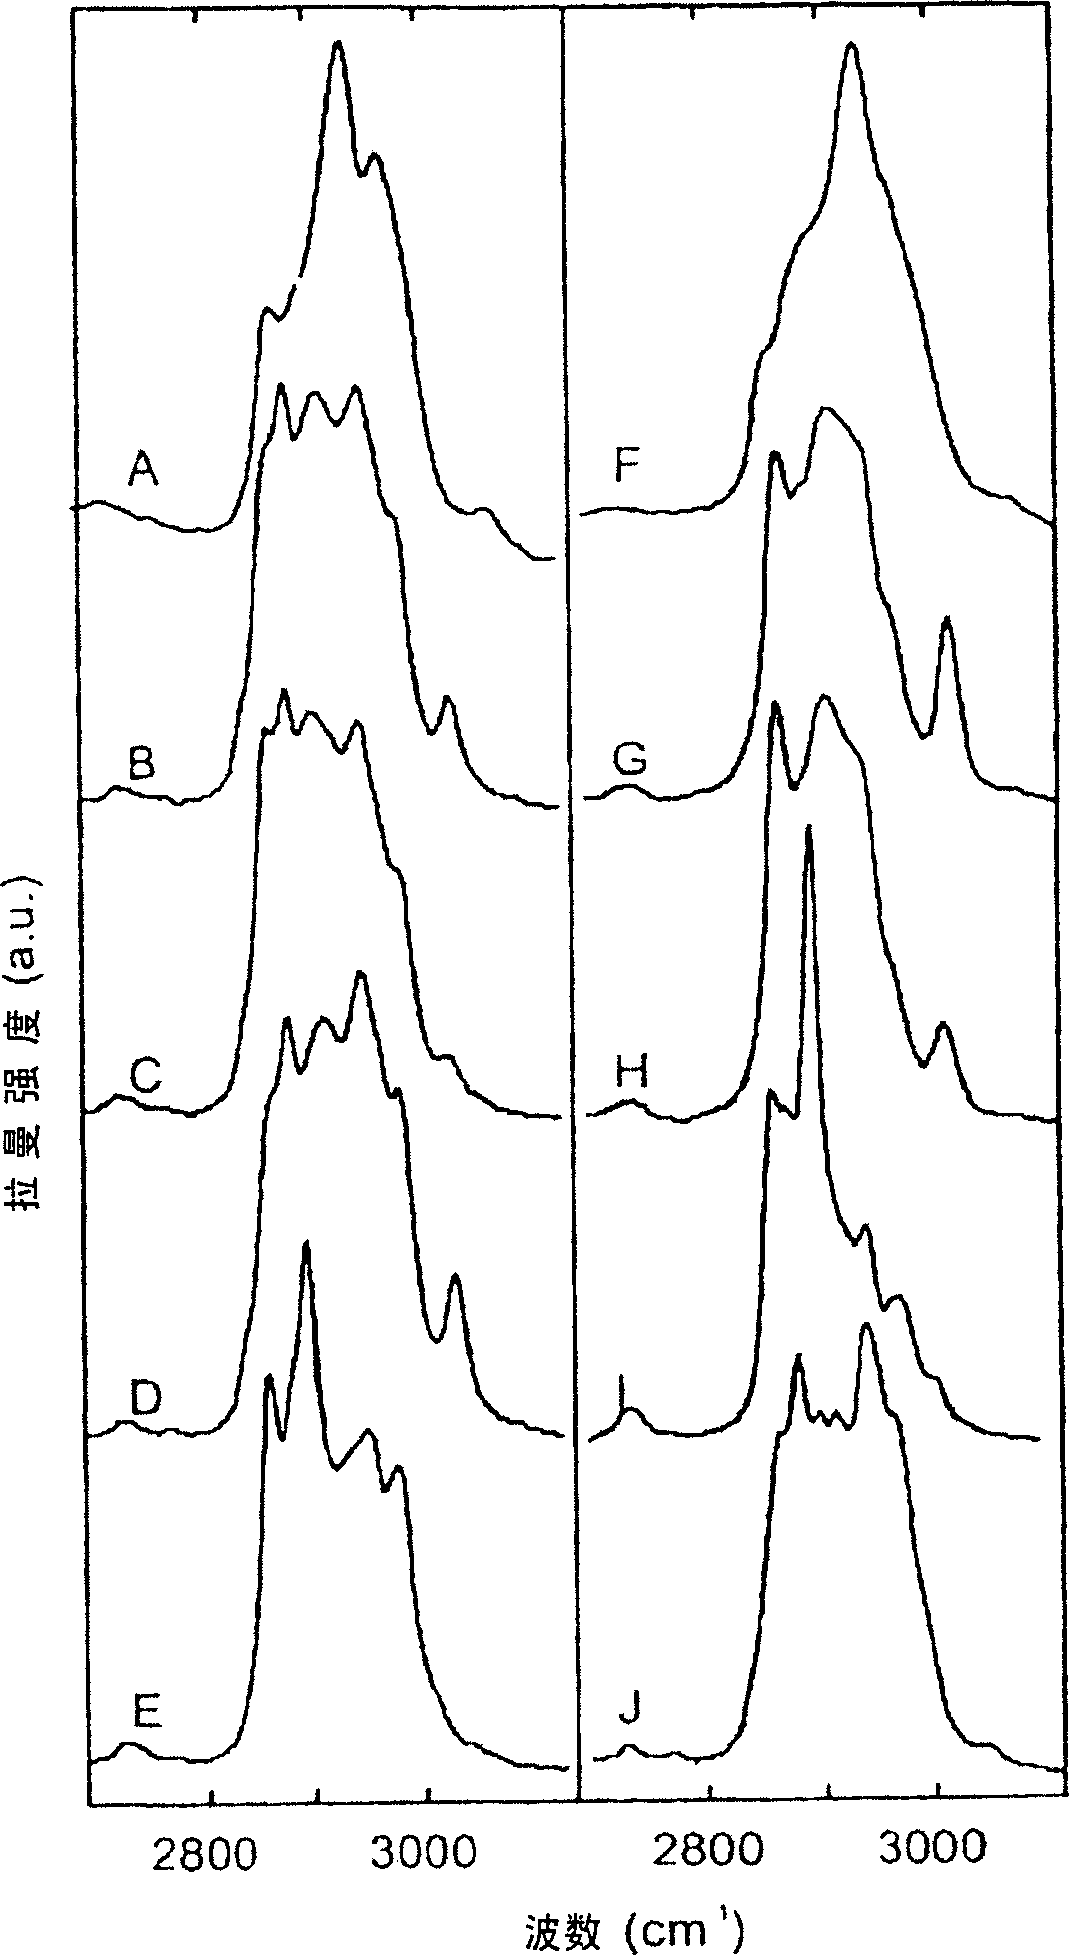
[0110] Example 1: Raman mapping of atherosclerotic arteries
[0111] This experiment describes the possibility of Raman spectroscopy in the spectral region of the present invention for studying atherosclerotic plaques.
[0112] The human coronary artery samples used to generate the Raman maps shown in Figure 1 were obtained at autopsy (less than 24 hours postmortem). They were snap frozen in liquid nitrogen and stored at -80°C until use. For Raman measurements, a 20 μm thick cryosection was placed in calcium fluoride (CaF 2 ) window (Crystran UK) and passively heated to room temperature. Raman measurements were followed by staining using standard hematoxylin and eosin staining procedures.
[0113] To collect Raman spectra, a 719 nm laser from an argon-ion pumped titanium:sapphire laser system (Spectra Physics, Mountain View, CA) was used. The Raman microspectrometer system used is described in detail in Van de Poll SWE, Bakker Schut TC, Van der Laarse A, Puppels GJ "In Sit...
Embodiment 2
[0130] Example 2: Raman mapping of cancer tissue
[0131] This experiment describes the possibility of Raman spectroscopy in the spectral region of the invention for studying cancerous tissue.
[0132] High wavenumber regions can also be beneficially used in various clinical applications. For example, Figure 4A shows a Raman map obtained from a thin tissue section of meningioma-infiltrated human dura in a manner similar to the map of an atherosclerotic lesion of Figure 1A. It is not currently possible to evaluate the cut margins well intraoperatively. However, it is known that remaining meningioma tissue may lead to tumor recurrence. Figure 4B shows pictures of adjacent tissue sections after staining with hematoxylin and eosin (H&E staining). Surprisingly, histopathological evaluation of this section and its comparison with the Raman map showed that the light gray areas of the Raman map corresponded to the dura, while the dark gray areas corresponded to meningiomas (MGs). ...
Embodiment 3
[0134] Example 3: Raman Mapping of Cancer Tissue
[0135] This experiment describes the possibility of Raman spectroscopy in the spectral region of the present invention for studying cancerous tissue.
[0136] Figure 5A shows a Raman map of a thin section of a human glioblastoma with both major tumor areas and areas of necrotic tissue. Surprisingly, comparison of the Raman map, evaluated by a neuropathologist, with the H&E-stained adjacent section revealed light gray areas corresponding to primary tumor tissue, whereas dark gray areas in the Raman map corresponded to necrotic tissue.
[0137] This experiment shows that the Raman determination of the spectral region of the present invention provides valuable information on cancerous tissue of the brain, enabling Raman spectroscopy to distinguish primary tumor tissue from necrotic tissue.
PUM
 Abstract
Description
Claims
Application Information
 - R&D
- Intellectual Property
- Life Sciences
- Materials
- Tech Scout
- Unparalleled Data Quality
- Higher Quality Content
- 60% Fewer Hallucinations
Browse by: Latest US Patents, China's latest patents, Technical Efficacy Thesaurus, Application Domain, Technology Topic, Popular Technical Reports.
© 2025 PatSnap. All rights reserved.Legal|Privacy policy|Modern Slavery Act Transparency Statement|Sitemap|About US| Contact US: help@patsnap.com