High-sensitivity hydrogen sulfide response type nanoprobe as well as preparation method and application thereof
A high-sensitivity, nano-probe technology, applied in the field of near-infrared and photoacoustic nano-probe biological imaging, can solve the problems of shallow penetration and poor spatial resolution, achieve remarkable results, realize the integration of diagnosis and treatment, and achieve good passive target tropism effect
- Summary
- Abstract
- Description
- Claims
- Application Information
AI Technical Summary
Problems solved by technology
Method used
Image
Examples
Embodiment 1
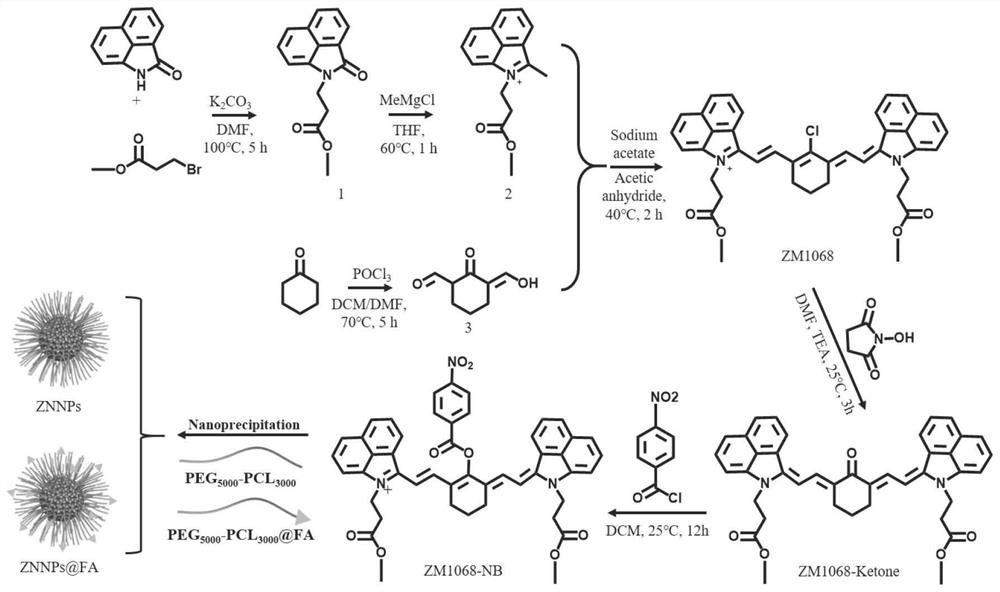
[0074] Example 1: Synthesis of novel high-sensitivity hydrogen sulfide-responsive nanoprobes ZNNPs and ZNNPs@FA. The schematic diagram of the reaction and the chemical structural formulas related to the products of each step are as follows: figure 1 shown in .
[0075] (1) Under nitrogen protection, add naphthalimide (1.69 g, 10 mmol), methyl 3-bromopropionate (2.38 g, 20 mmol) and 10 mL of anhydrous N,N- Dimethylformamide was used as a solvent, and the mixture was heated to 100 °C with magnetic stirring and refluxed for 5 h. The reaction was completed, cooled to room temperature, the mixture was poured into 500 mL of ice-water mixture, and the pH was adjusted to neutral with 1mol / L hydrochloric acid aqueous solution, filtered under reduced pressure, and the crude product was purified by silica gel column chromatography (petroleum ether: ethyl acetate = 9:1, v / v), the product was yellow solid compound 1 (1.56 g, yield: 75 %).
[0076] (2) Under nitrogen-protected ice-bath c...
Embodiment 2
[0083] Example 2: Chemical characterization of ZNNPs and ZNNPs@FA.
[0084] Firstly, the average hydrodynamic sizes determined by dynamic light scattering (DLS) were 70 and 75 nm, respectively, indicating that ZNNPs and ZNNPs@FA were monodisperse nanoparticles in aqueous solution ( Figure 5 a and Figure 6 a). In the same way, Figure 5 b and Figure 6 The transmission electron microscopy (TEM) results of b show that their average diameters are 70 ± 3.5 nm and 77 ± 5 nm, respectively. The structure of the nanoparticles was then characterized by Fourier transform infrared spectroscopy (IR), zeta potential analysis, and UV-Vis absorption spectroscopy. Figure 6 The infrared spectrum results of c show that at 3200-3300 m -1 and 1637 cm -1 The characteristic absorption peaks at correspond to amino and ester groups, respectively. In addition, another maximum absorption peak recorded by ZNNPs and ZNNPs@FA at 1000 nm should be the ether bond, which is very consistent with the...
Embodiment 3
[0088] Example 3: Derivation and verification of the living hydrogen sulfide quantitative equation of the novel high-sensitivity hydrogen sulfide-responsive nanoprobe ZNNPs
[0089] In order to establish a quantitative method for endogenous H2S in vivo, Balbc-Nu mice (18 ± 0.5 g) were injected intraperitoneally with 100 μL of L-Cys solution (0, 1, 2, 3, 4, 5 mM) to construct H2S in the liver. 2Mouse models with different S concentrations. After 30 min, the experimental group probe ZNNPs (1 mg / mL, 200 μL) prepared in Example 1 was injected through the tail vein. 680 nm and 900 nm PA images were collected at 90 min time point ( Figure 8 a), using iThera MSOT imaging software to measure the average intensity of PA signal in the liver ROI area at 90 min and draw the curve ( Figure 8 b). Finally, the livers of each group (n=3) were dissected and homogenized, and the H 2 S colorimetric kit for determination of H in liver 2 The actual concentration of S ( Figure 8 d). Then ...
PUM
 Abstract
Description
Claims
Application Information
 - R&D
- Intellectual Property
- Life Sciences
- Materials
- Tech Scout
- Unparalleled Data Quality
- Higher Quality Content
- 60% Fewer Hallucinations
Browse by: Latest US Patents, China's latest patents, Technical Efficacy Thesaurus, Application Domain, Technology Topic, Popular Technical Reports.
© 2025 PatSnap. All rights reserved.Legal|Privacy policy|Modern Slavery Act Transparency Statement|Sitemap|About US| Contact US: help@patsnap.com


