
Power equipment state monitoring data clustering method and system

A technology for monitoring data and power equipment, applied in the field of pattern recognition and anomaly detection, to achieve the effect of improving accuracy and effectiveness, and improving clustering methods and systems

Pending Publication Date: 2020-08-25
CHONGQING UNIV
View PDF4 Cites 5 Cited by
  • Summary
  • Abstract
  • Description
  • Claims
  • Application Information

AI Technical Summary

Problems solved by technology

[0004] In the DBSCAN model, the neighborhood radius parameter E and the density threshold parameter k have a significant impact on the performance of the DBSCAN model, but under the unsupervised condition of lack of data labels, the cross-validation method cannot be used for parameter optimization, and the traditional k-based The optimization model of the distance map will make the parameter optimization results show strong subjectivity and inaccuracy

Method used


Image

  • Power equipment state monitoring data clustering method and system
  • Power equipment state monitoring data clustering method and system
  • Power equipment state monitoring data clustering method and system

Examples


Embodiment Construction

[0047] The application will be further described below in conjunction with the accompanying drawings. The following examples are only used to illustrate the technical solutions of the present invention more clearly, but not to limit the protection scope of the present application.

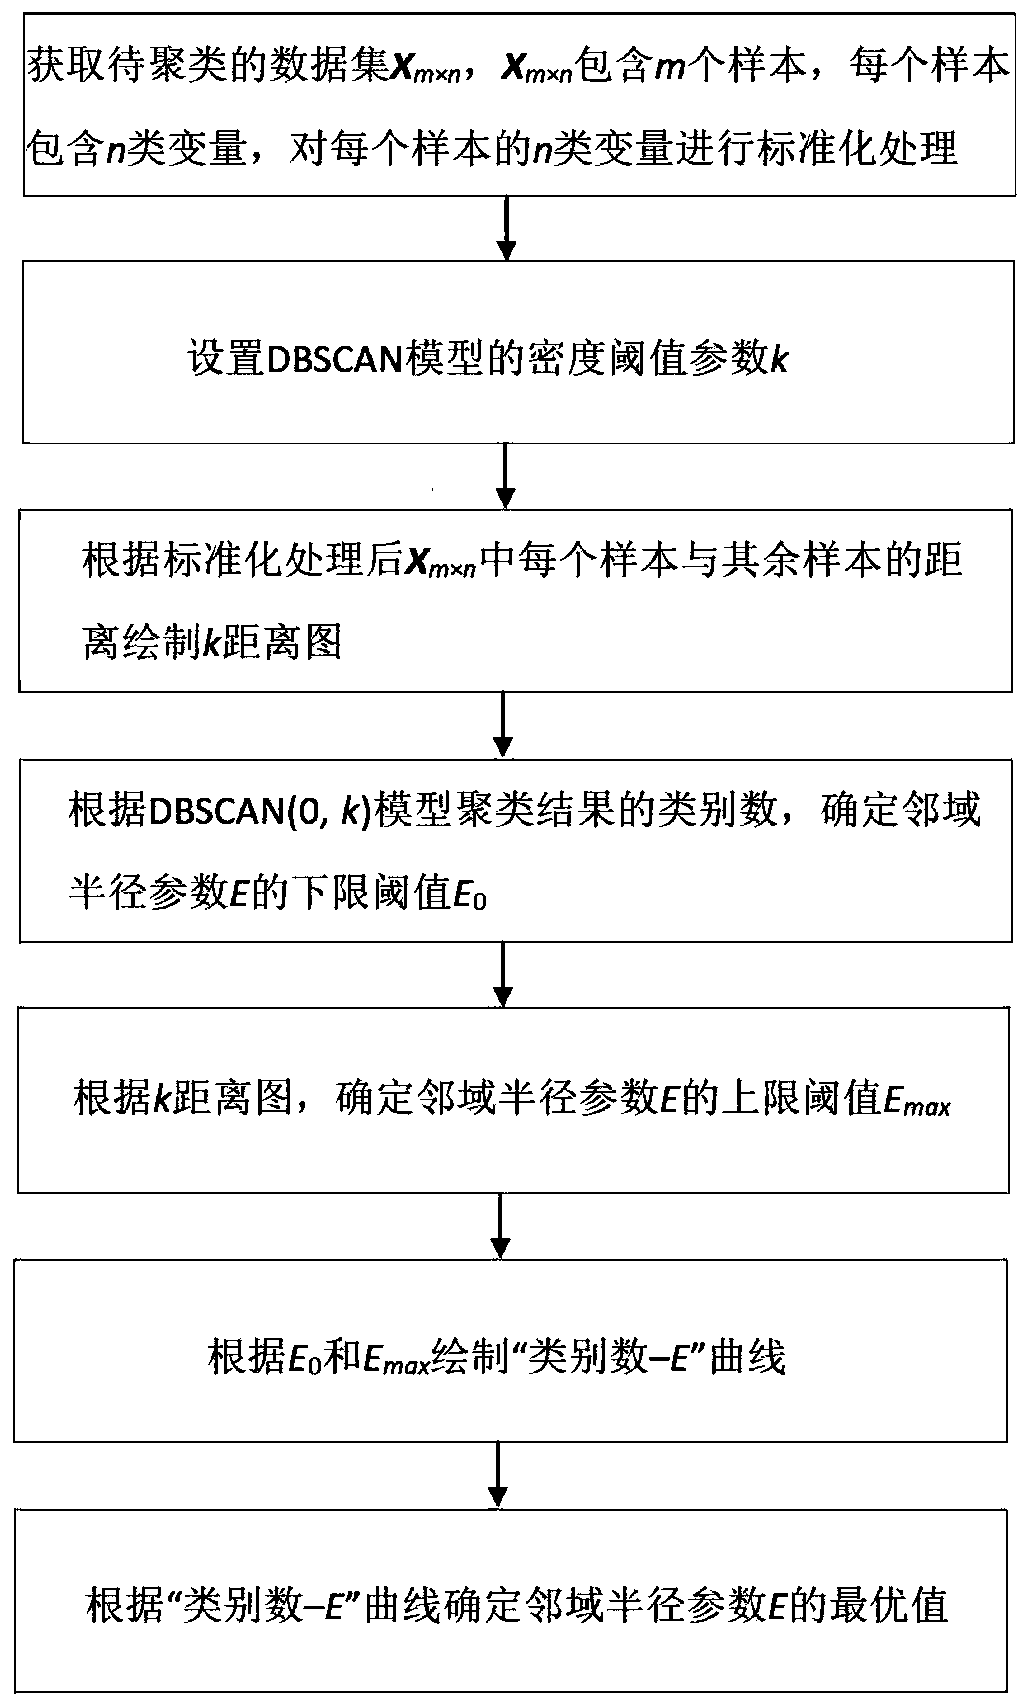
[0048] Such as figure 1 As shown, a method for clustering power equipment condition monitoring data of the present application includes the following steps:

[0049] Step 1: Obtain an online monitoring data set of dissolved gas in transformer oil containing 101 outliers X780×6 , the data set contains 780 samples, each sample contains 6 types of variables, and the z-score standardization process is performed on the 6 types of variables of each sample, taking the jth type of variable as an example, the standardization method is shown in formula (1).

[0050]

[0051] In the formula, is the standardized measured value of the i-th sample of the j-th variable; and σ j are the mean and standard ...


PUM


Abstract

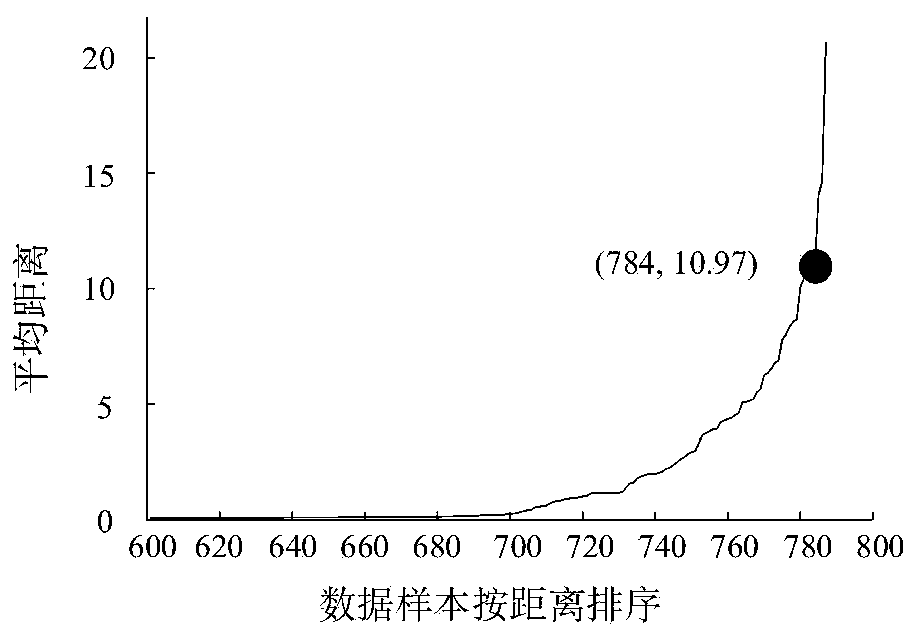
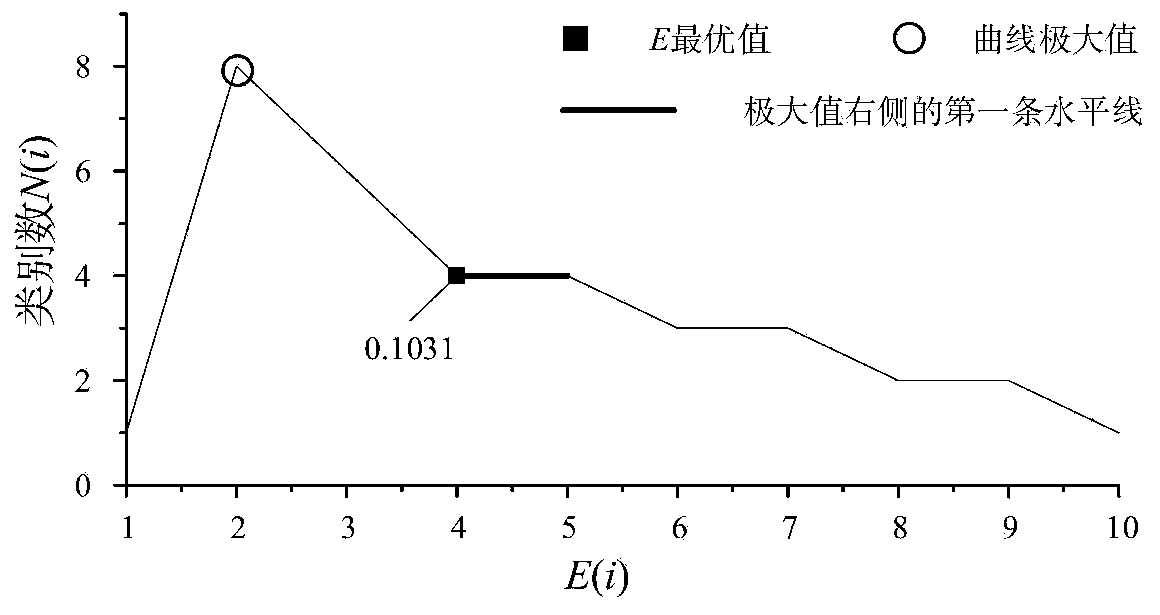
The invention discloses a power equipment state monitoring data clustering method and system, and the method comprises the steps: obtaining a to-be-clustered data set Xm * n which comprises m samples,enabling each sample to comprise n types of variables, and standardizing the n types of variables of each sample; setting a density threshold parameter k of the DBSCAN model; drawing a k distance mapaccording to the distance between each sample in the standardized Xm * n and other samples; determining a lower limit threshold E0 of the neighborhood radius parameter E according to the category number of the clustering result of a DBSCAN (0, k) model; determining an upper limit threshold Emax of E according to the k distance graph; drawing a'category number-E 'curve according to the E0 and theEmax; and determining the optimal value of E according to the'category number-E 'curve. Optimization of a neighborhood radius parameter E and a density threshold parameter k of a DBSCAN model is achieved by designing and drawing a category number-E curve, and the DBSCAN model is used for clustering power equipment online monitoring data and used for pattern recognition and anomaly detection of online monitoring real-time data and judging normal data categories and anomaly types.

Description

technical field [0001] The invention belongs to the technical field of pattern recognition and abnormality detection, and in particular relates to a method and system for clustering data of state monitoring of electric power equipment. Background technique [0002] Power equipment is the most important core part of the smart grid, and its normal operation is the fundamental guarantee of grid security. The power equipment in the smart grid includes: large power transformers: transmission and distribution networks (overhead lines, cable tunnels); relay protection and control equipment, and may also include generators and other equipment. With the rapid development of network technology, sensor technology and computer technology, from the analysis of the latest smart grid research trends, the use of artificial intelligence methods for online monitoring and condition maintenance of power equipment has become a development trend in this field. [0003] The DBSCAN (Density-Based ...

Claims


Application Information

Patent Timeline
Patent Type & Authority Applications(China)
IPC IPC(8): G06K9/62H02J13/00
CPCH02J13/00002G06F18/285G06F18/23213
Inventor 王有元刘航陈伟根杜林李剑梁玄鸿周湶王飞鹏万福谭亚雄黄正勇
Owner CHONGQING UNIV
Learn More