Method for detecting concentration of light chrome yellow in heavy metal concentrated alkali liquid
A detection method and technology for heavy metals, applied in Raman scattering, material excitation analysis, etc., can solve the problems of inability to achieve rapid detection, inability to exclude other sources of lead and chromium, cumbersome processes, etc., to achieve convenient focusing, speed up processing, Simple to use effects
- Summary
- Abstract
- Description
- Claims
- Application Information
AI Technical Summary
Problems solved by technology
Method used
Image
Examples
Embodiment 1
[0047] A method for detecting the concentration of light chrome yellow in heavy metal concentrated alkali liquid, including:
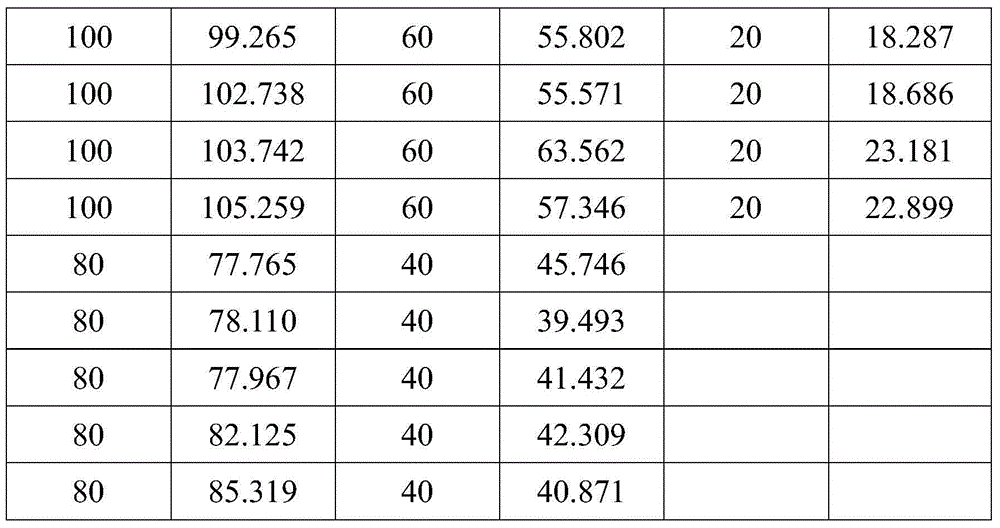
[0048] (1) Use heavy metal concentrated alkali liquids with different light chrome yellow concentrations as test samples, and obtain each test sample at 2717.2cm -1 ~112.3cm -1 Raman spectrum with silicon wafer as substrate in the wave number range.
[0049] In this embodiment, a 96-well flat-bottom culture dish (aperture: 6.4mm, bottom area: 0.32cm 2 , The volume is 0.36ml) as a container, and a hole is a container. Place a round silicon wafer with a diameter of 5mm and a thickness of 0.5mm at the bottom of each hole. Use a pipette to transfer 0.4ml of liquid into the well of the petri dish, and use a scraper to remove the excess liquid along the edge of the petri dish , And then place the petri dish on the glass slide for use.
[0050] Place the container containing the test sample on the stage of the Raman microscope to test the Raman spectrum of each tes...
Embodiment 2
[0073] Same as embodiment 1, the difference is that after the calibration model is built in step (3), it also includes updating the calibration wave number and the calibration model. The updating method is as follows:
[0074] Perform variance analysis on the first linear regression model to screen the calibration wavenumber, and use the screened calibration wavenumber as the final calibration wavenumber, and according to the light chrome yellow concentration of all test samples, and the selected values in the Raman spectrum. Peak intensity at scalar wave number and 520cm -1 The second linear regression model of the concentration-intensity ratio is constructed as the updated calibration model by the ratio of peak intensity at.
[0075] Perform variance analysis on the calibration model before updating, and the results are shown in Table 2
[0076] Table 2
[0077]
[0078]
[0079] Table 2 shows the wavenumber variable λ 526 , Λ 460 , Λ 416 , Λ 112 (Sample in wave number 526cm -1 , ...
PUM
| Property | Measurement | Unit |
|---|---|---|
| diameter | aaaaa | aaaaa |
| thickness | aaaaa | aaaaa |
| correlation coefficient | aaaaa | aaaaa |
Abstract
Description
Claims
Application Information
 - R&D
- Intellectual Property
- Life Sciences
- Materials
- Tech Scout
- Unparalleled Data Quality
- Higher Quality Content
- 60% Fewer Hallucinations
Browse by: Latest US Patents, China's latest patents, Technical Efficacy Thesaurus, Application Domain, Technology Topic, Popular Technical Reports.
© 2025 PatSnap. All rights reserved.Legal|Privacy policy|Modern Slavery Act Transparency Statement|Sitemap|About US| Contact US: help@patsnap.com


