Chemiluminescent protein chip method and kit for antigen-like proteins in serum
An antigen protein and protein chip technology, applied in the field of chemiluminescence protein chip method and kit for antigen-like proteins in serum, can solve the problems of long detection time, high cost, large blood volume, etc., and achieve lower detection cost and low cost. , the effect of high sensitivity
- Summary
- Abstract
- Description
- Claims
- Application Information
AI Technical Summary
Problems solved by technology
Method used
Image
Examples
Embodiment 1
[0056] Example 1. Protein chip preparation and use process
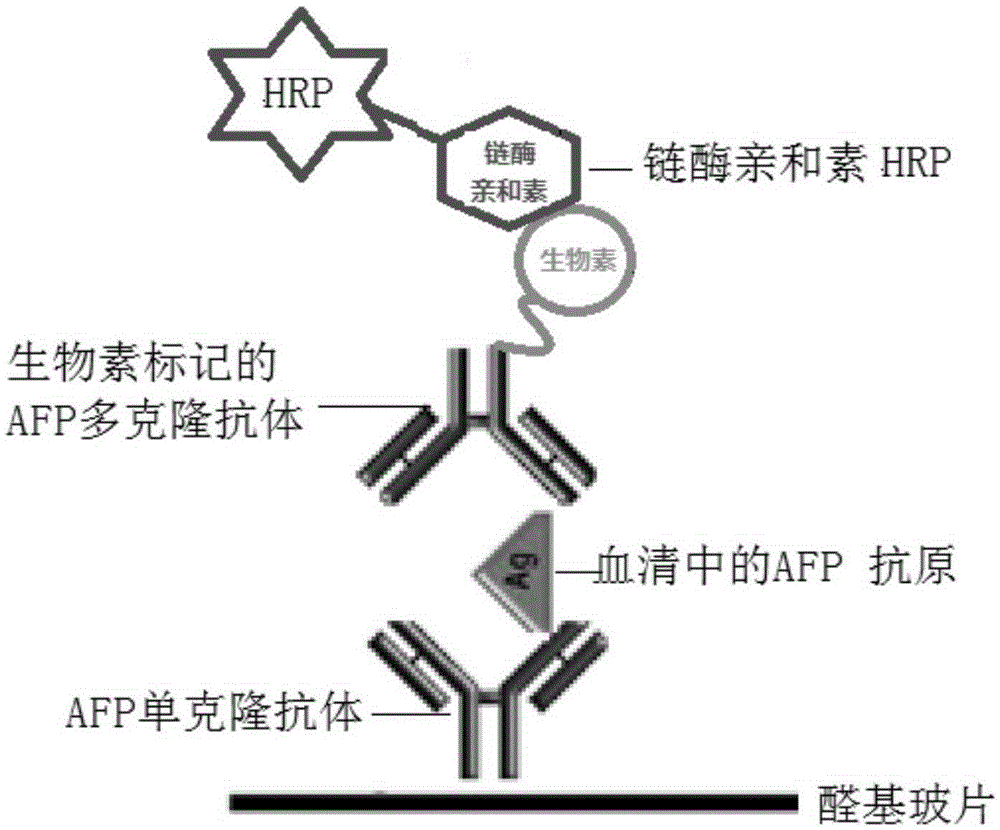
[0057] Reagents used in the experiment: mouse monoclonal antibody AFP (Shenzhen Faipeng Company); aldehyde-based chip (Shanghai Biopro Company); biotin-labeled rabbit-derived primary antibody (Abcam Company, USA); HRP-labeled streptavidin ( American abcam company); HRP substrate luminescent fluid (US millipore company), chemical imager (developed by the Academy of Military Medical Sciences).
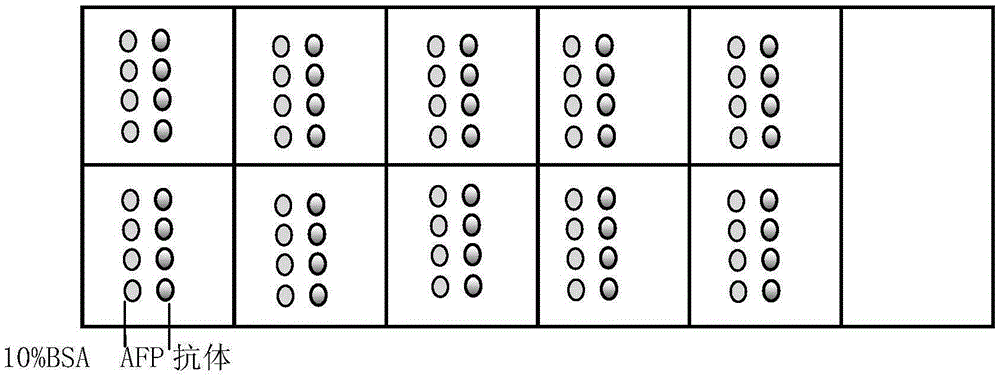
[0058] In a preferred embodiment of the present invention, the mouse monoclonal antibody AFP (Shenzhen Faipeng Company) was spotted on the chip in turn, and the sample was spotted four times at a spotting concentration of 2 mg / ml to form a detection spot.
[0059] 10% bovine serum albumin (BSA) was used as a negative control, and the sample was also spotted four times to form a control spot. The chip is an aldehyde-based chip (Shanghai BioPro Company), each chip contains 10 detection squares, each square detects one serum, and...
Embodiment 2
[0067] Embodiment 2. Establishment of the detection method of the present invention
[0068] Step 1: Develop a Standard Curve
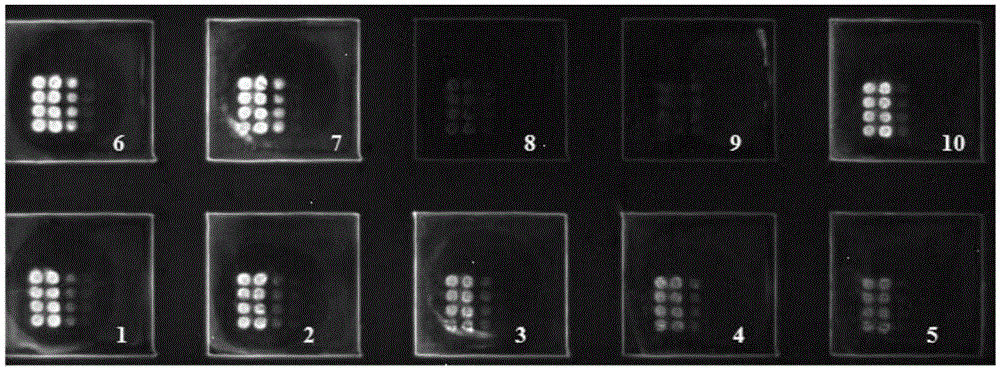
[0069] Use the purchased AFP antigen (abcam company in the United States), set to different concentration gradients, 80ng / ml, 40ng / ml, 20ng / ml, 10ng / ml, 5ng / ml, 2.5ng / ml, 1.25ng / ml, 0.625ng / ml.
[0070] Adopt the operation flow in the embodiment 1 and protein chip to detect each concentration gradient of AFP standard substance, scanning result
[0071] Such as image 3 .
[0072] Table 1. Standard curve detection data results
[0073]
[0074]
[0075] The test results are drawn into a standard curve, with the concentration of the standard as the abscissa and the pixel value as the ordinate, and the standard curve is drawn on the coordinate paper; the corresponding concentration is found from the standard curve according to the pixel value of the sample; then multiplied by the dilution Multiple; or use the concentration and OD value of the...
PUM
 Abstract
Description
Claims
Application Information
 - R&D
- Intellectual Property
- Life Sciences
- Materials
- Tech Scout
- Unparalleled Data Quality
- Higher Quality Content
- 60% Fewer Hallucinations
Browse by: Latest US Patents, China's latest patents, Technical Efficacy Thesaurus, Application Domain, Technology Topic, Popular Technical Reports.
© 2025 PatSnap. All rights reserved.Legal|Privacy policy|Modern Slavery Act Transparency Statement|Sitemap|About US| Contact US: help@patsnap.com


