Method and apparatus for measuring deposition of particulate contaminants in pulp and paper slurries
a technology of particulate contaminants and which is applied in the field of methods and equipment for measuring the deposition of particulate contaminants in pulp and paper slurries, can solve the problems of affecting the the deposition, quality and efficiency of the papermaking process, and the impact of quality and operating efficiency of the pulp or paper mill
- Summary
- Abstract
- Description
- Claims
- Application Information
AI Technical Summary
Benefits of technology
Problems solved by technology
Method used
Image
Examples
example 1
[0047]A sorted office waste (“SOW”) from a recycle pulp mill with a dichloromethane (“DCM”) extractable level of 7 gm / Kg, and a bleached hardwood Kraft pulp with no detectable DCM, were both diluted to 0.5% consistency at 200 ppm. Calcium was added in the form of calcium chloride. The two slurries were then mixed in various ratios (see Table 1 below) and added to a beaker equipped with a magnetic stirrer and heater. The slurry mixtures were then heated to 50° C. with mixing. Two 35 mm photographic slide holders to which 3M adhesive tape 175-O (3M, St. Paul, Minn., USA) was mounted as the substrate were then suspended in the slurry for a period of one hour. The slides were mounted in such a fashion that the orientation of the substrate was parallel with flow of the slurry. After the hour of residence time, the slides were removed from the heated slurry, rinsed with cold water, and then air dried in a dust free environment. Each slide was then scanned utilizing a Nikon CoolScan V ED (...
example 2
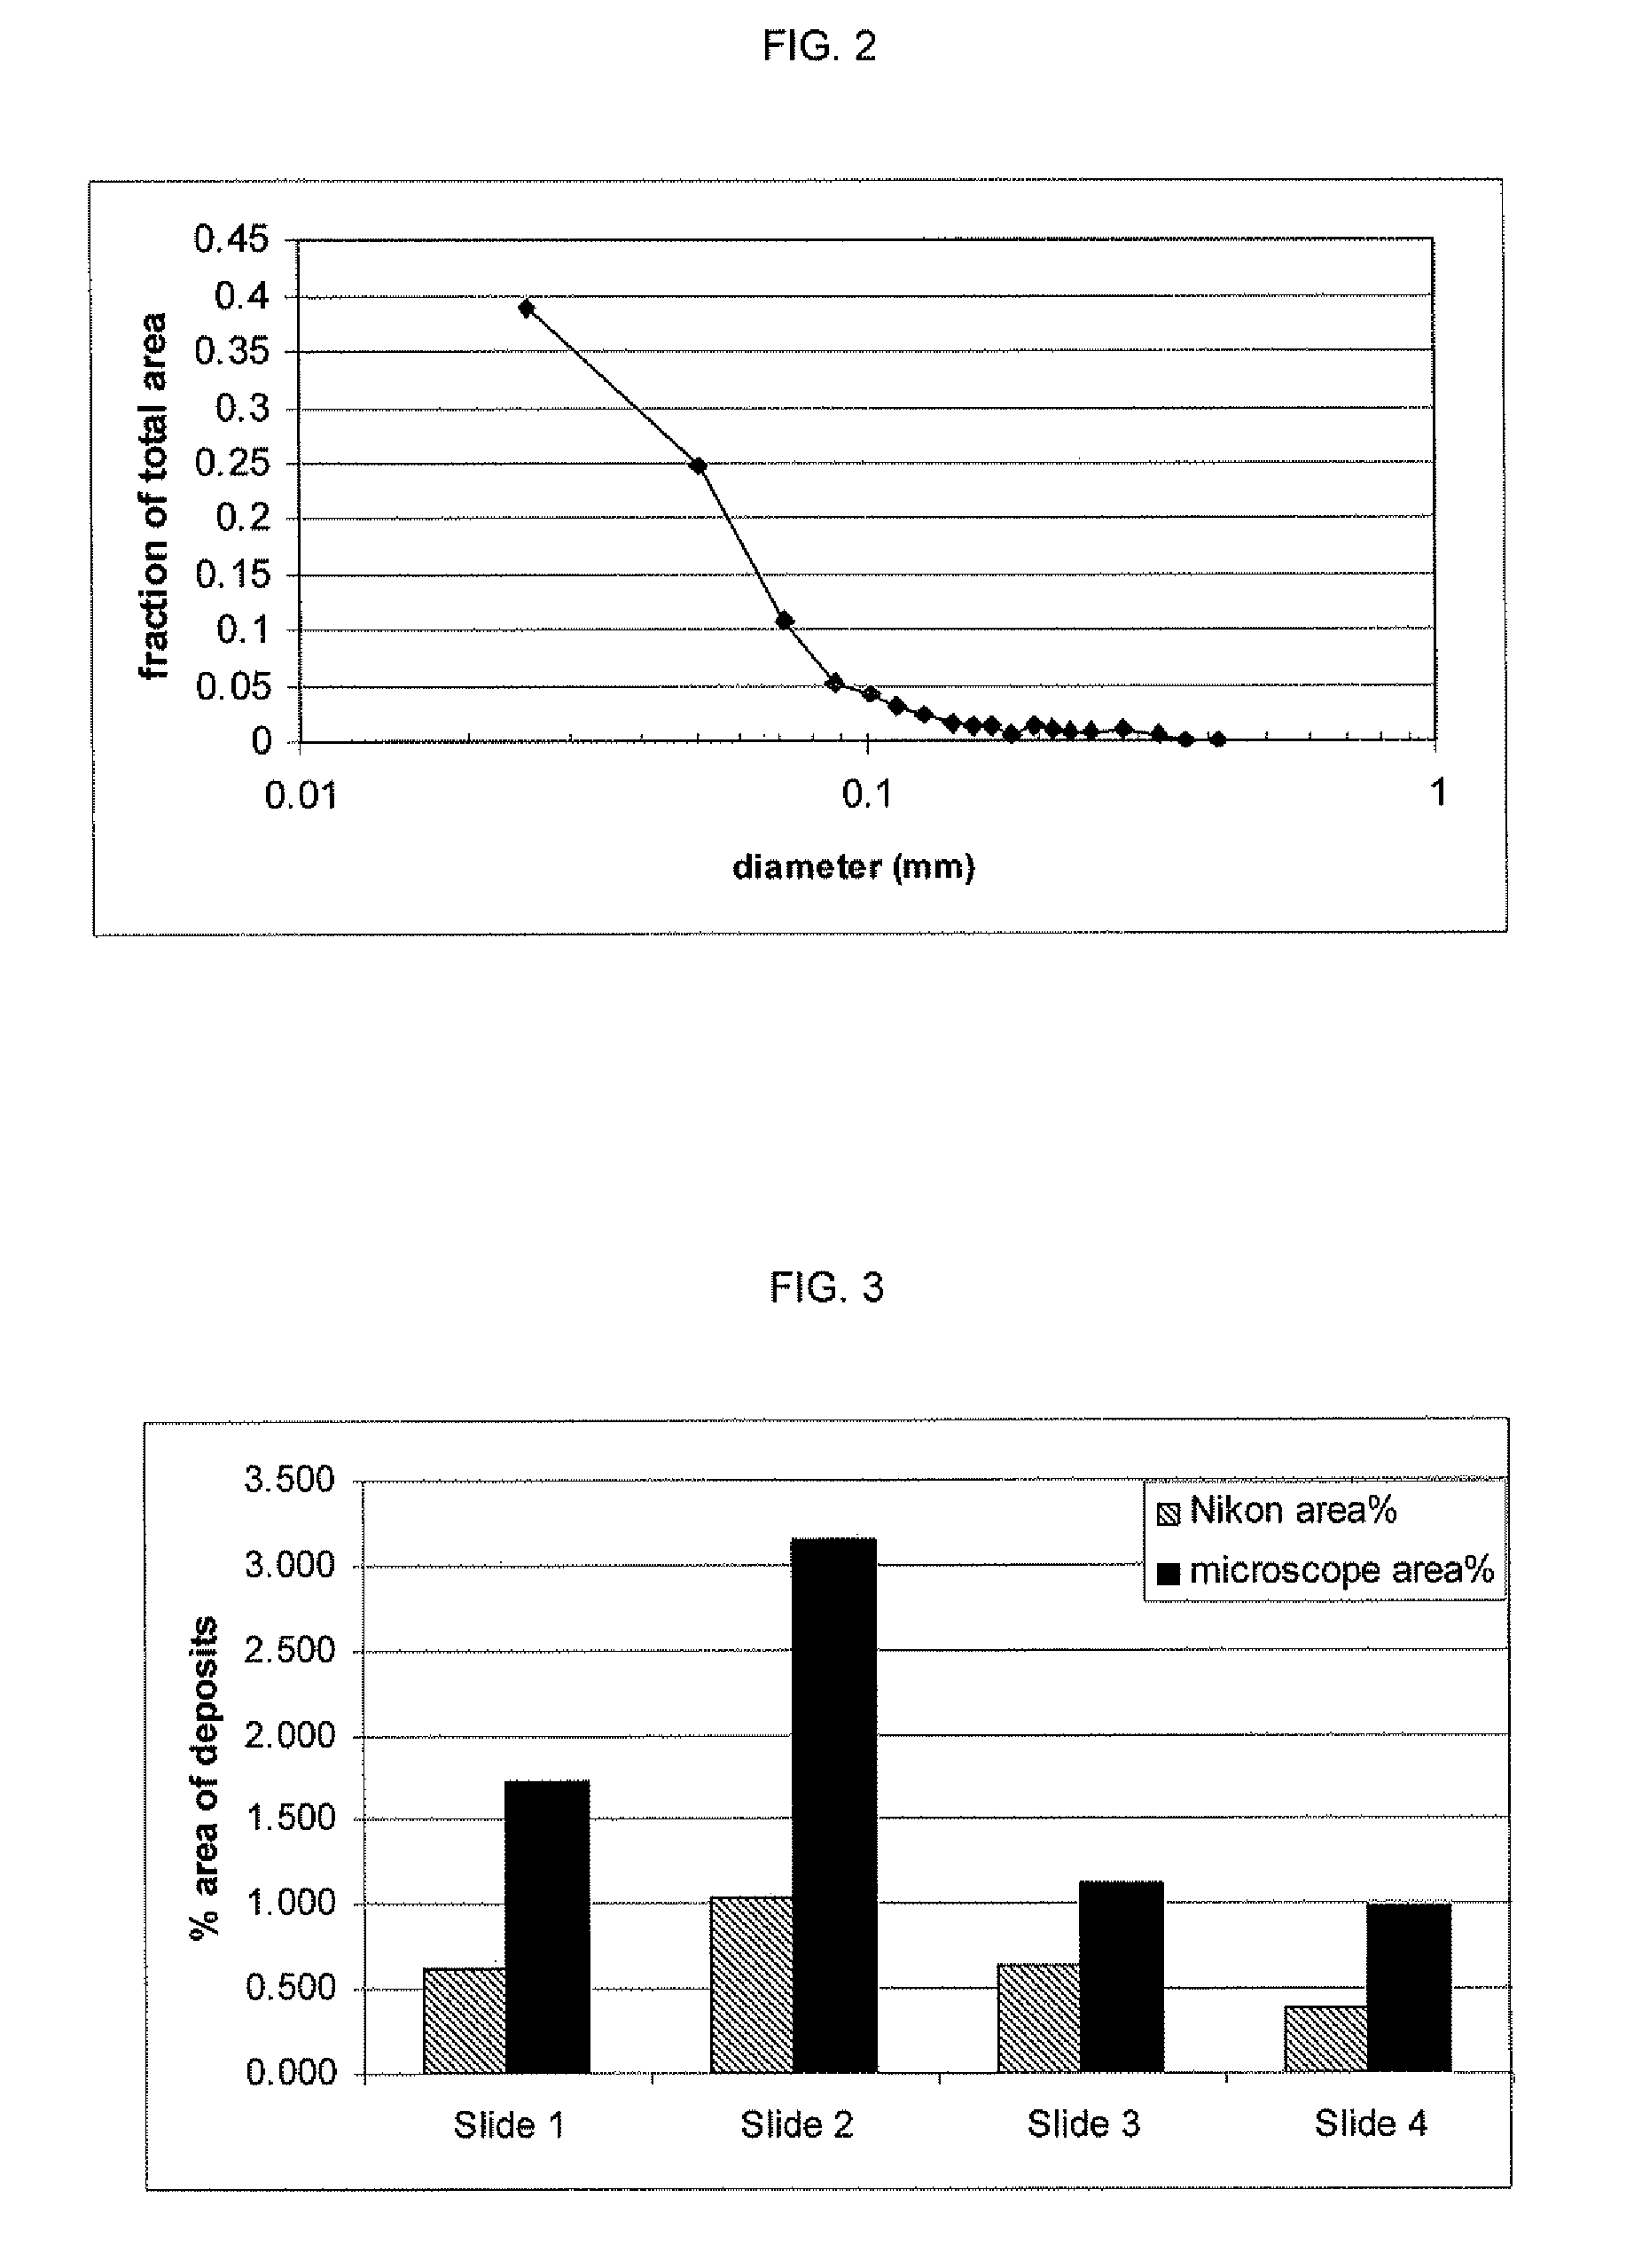
[0053]The 75% SOW / 25% bleached hardwood Kraft pulp data from Example 1 was analyzed for particle size distribution. A plot of the frequency distribution of the deposited particles versus particle size is presented in FIG. 2. In this example, it can be seen that a majority of the area of the deposit is due to microstickies, and particles as small as 20 μm were detected.
example 3
[0054]Example 1 was repeated with 100% SOW under four different conditions varying temperature and deposition time as noted in Table 2 (below). Images were generated with the Nikon CoolScan V ED scanner as noted in Example 1 and with a transmitted light microscope at 65× magnification. For the transmitted light microscope, sixteen images were obtained per slide. The images from all the slides were analyzed using the Verity IA software, and the results were averaged for each data set. A summary of this analysis is presented in FIG. 3. The microscope images detected a greater number of deposited particles of very small particle size that were not detected by the scanner. While the absolute values for the microscope images are greater than Nikon CoolScan V ED for a given data set, the overall trends between the various slides are consistent. This further demonstrates that the particulate contaminants in this pulp furnish consist of a significant amount of microstickies.
[0055]
TABLE 2Sli...
PUM
| Property | Measurement | Unit |
|---|---|---|
| diameter | aaaaa | aaaaa |
| size | aaaaa | aaaaa |
| size | aaaaa | aaaaa |
Abstract
Description
Claims
Application Information
 - R&D
- Intellectual Property
- Life Sciences
- Materials
- Tech Scout
- Unparalleled Data Quality
- Higher Quality Content
- 60% Fewer Hallucinations
Browse by: Latest US Patents, China's latest patents, Technical Efficacy Thesaurus, Application Domain, Technology Topic, Popular Technical Reports.
© 2025 PatSnap. All rights reserved.Legal|Privacy policy|Modern Slavery Act Transparency Statement|Sitemap|About US| Contact US: help@patsnap.com


