
Platform for chemical and biological sensing by surface-enhanced Raman spectroscopy

a raman spectroscopy and surface-enhanced technology, applied in the direction of spectrometry/spectrophotometry/monochromators, instruments, optical radiation measurement, etc., can solve the problems of sers-active substrates not being robust enough to ensure adequate shelf life, etc., to facilitate surface enhanced raman spectroscopy and facilitate the formation of ‘hot spots'

Inactive Publication Date: 2011-03-01
RGT UNIV OF CALIFORNIA
View PDF6 Cites 35 Cited by
  • Summary
  • Abstract
  • Description
  • Claims
  • Application Information

AI Technical Summary

Benefits of technology

The patent describes methods and compositions for analyzing samples using a special substrate that helps with surface enhanced Raman spectroscopy. This substrate has "hot spots" made of metal / analyte / metal that can be used to detect the presence or absence of a specific analyte. The patent also describes methods for making these substrates. The technical effect of this invention is that it provides a more effective and accurate way to analyze samples for various applications.

Problems solved by technology

Two problems have prevented SERS, and especially ‘hot spot’ SERS, from becoming a powerful and routine analysis or medical diagnostic technology for detecting, for example, chemical or biological hazards, environmental toxins, or evidence of pathogens in body fluids.
First, SERS-active substrates have, in general, been highly technical preparations that make it difficult to achieve repeatability, dependability and stability so as to ensure reproducible results sample-to-sample.
Further, SERS-active substrates are not sufficiently robust to ensure adequate “shelf-life” and they are not amenable to easy routine use protocols to allow the analysis to be automated or to be carried out by technicians.
Second, the metals most often used as SERS substrates, gold and silver, are highly chemically-unspecific, hampering the ability of the technique to routinely exhibit specificity towards a target analyte in the presence of the many hundreds, or even thousands of background substances one encounters in body fluids or in the environment.

Method used


Image

  • Platform for chemical and biological sensing by surface-enhanced Raman spectroscopy
  • Platform for chemical and biological sensing by surface-enhanced Raman spectroscopy
  • Platform for chemical and biological sensing by surface-enhanced Raman spectroscopy

Examples


example 1

Making a Silver / Porous Aluminum Oxide Substrate

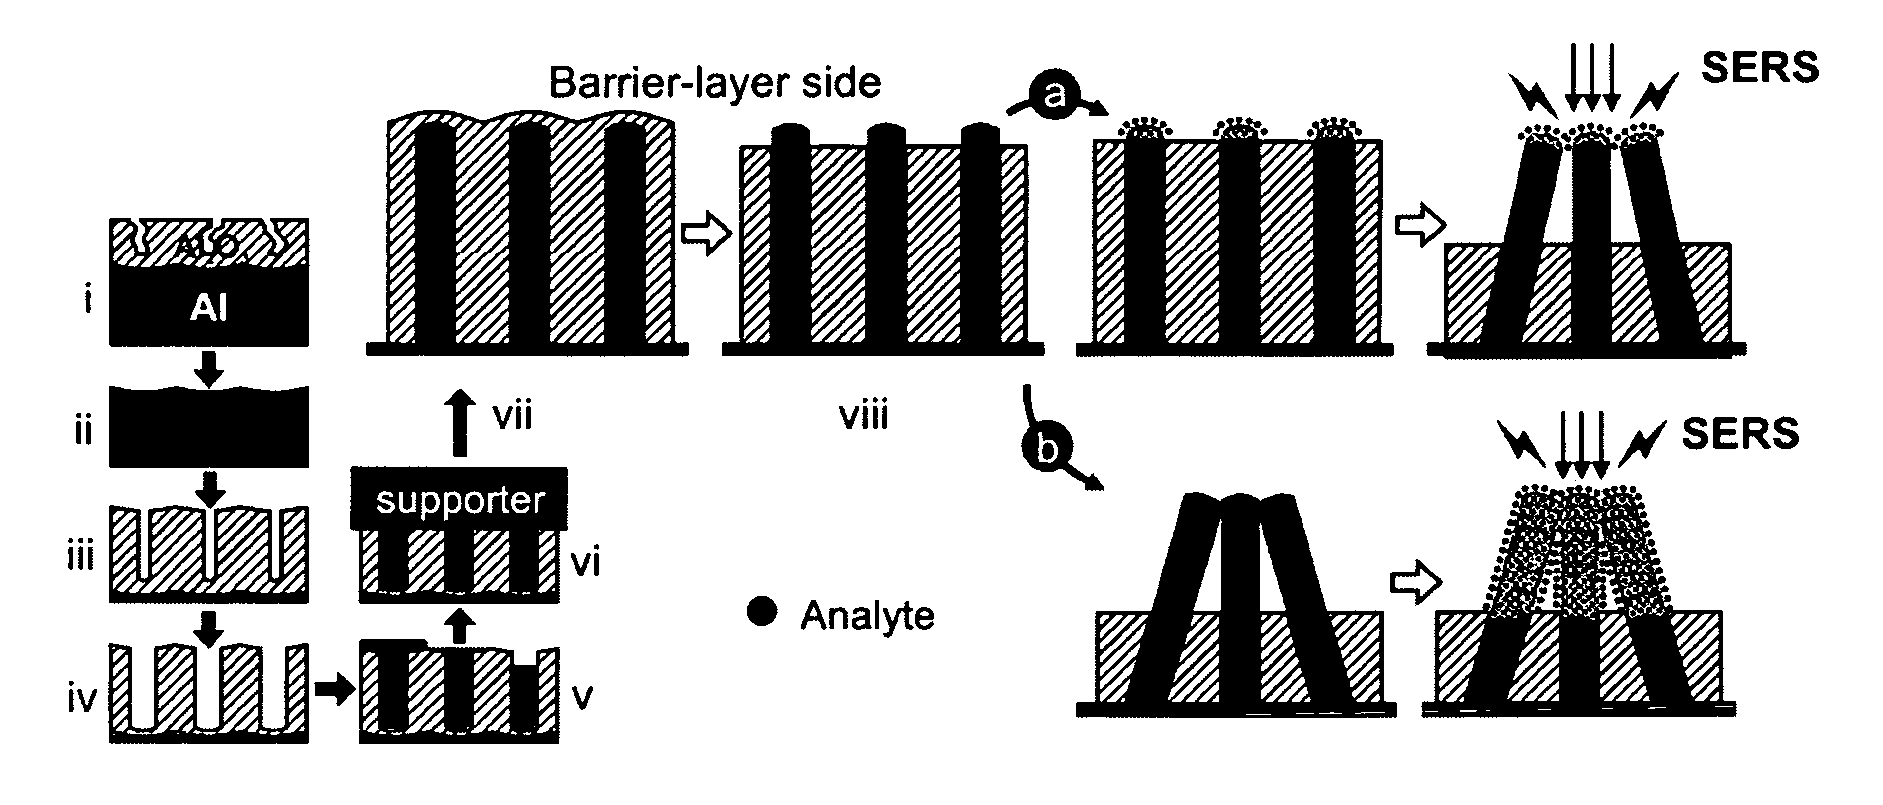
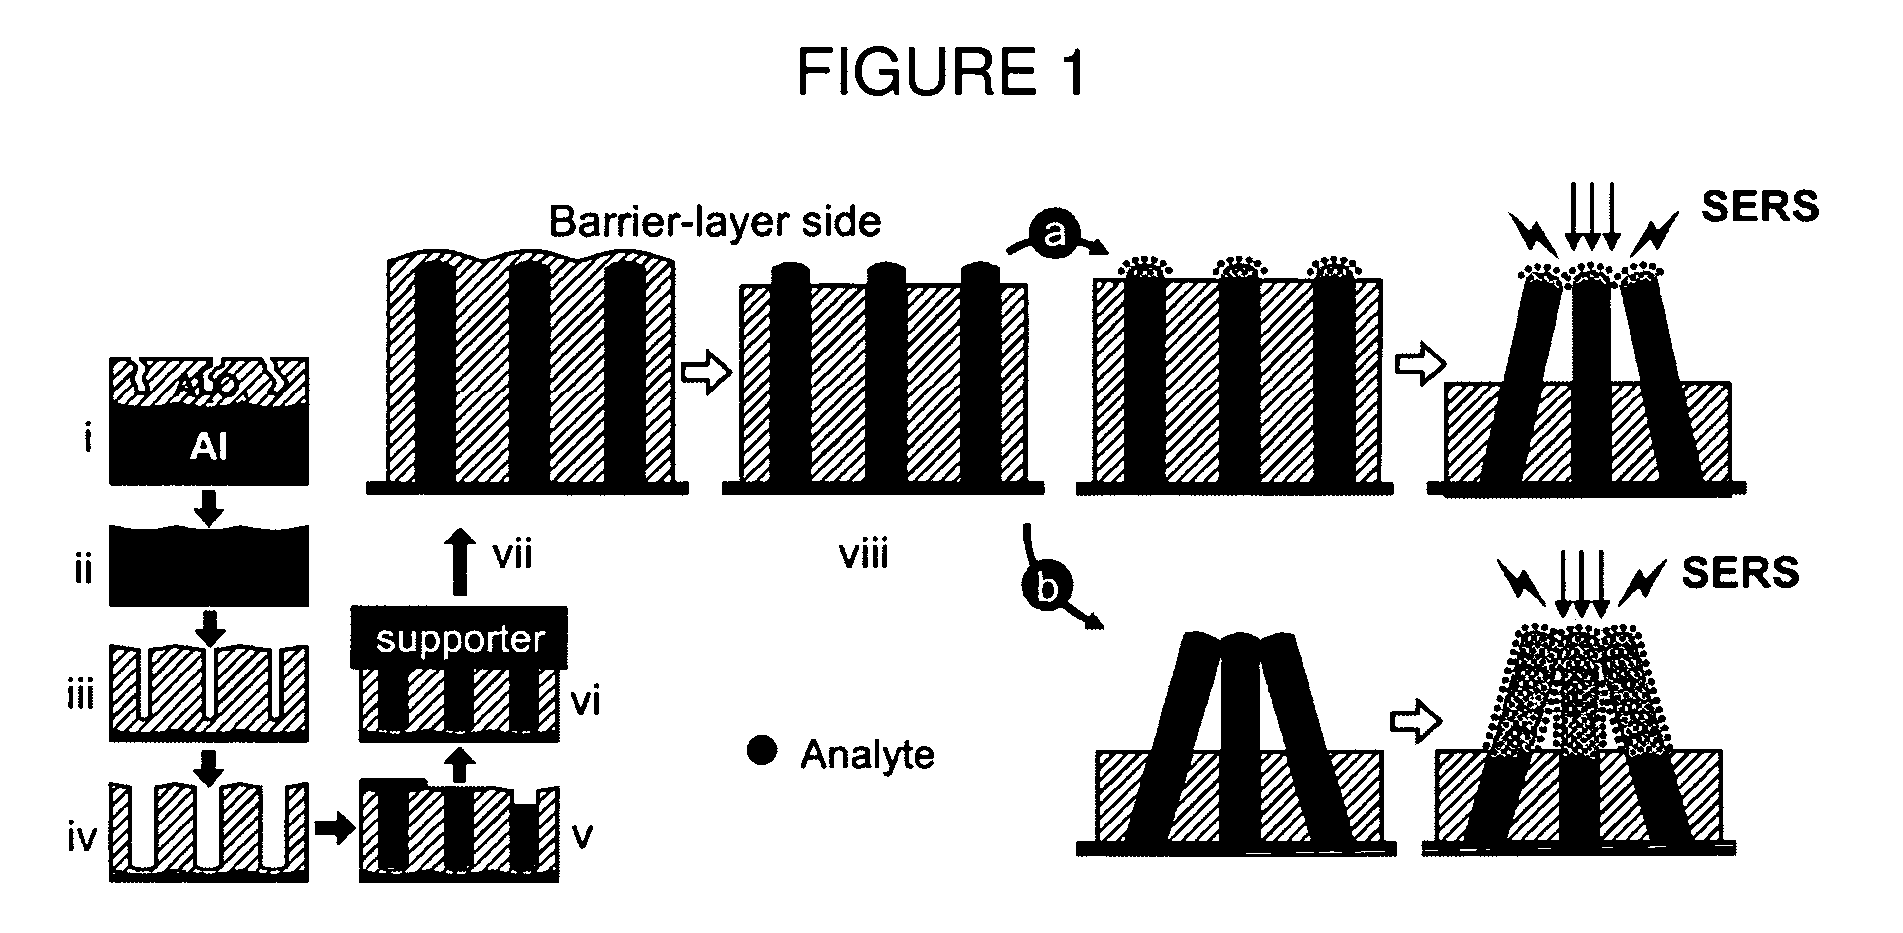
[0074]Certain embodiments of the present invention are related to a sensing platform for performing surface-enhanced Raman spectroscopy using arrays of metallic nanowires. FIG. 1 illustrates an exemplary method used for the preparation of silver nanowire embedded in porous aluminum oxide (Ag-PAO) and the manner in which it was treated so as to render it a SERS-active substrate. PAO was electrochemically fabricated on high purity (99.99%) aluminum sheet in 0.3 M oxalic acid using Masuda's two-step anodization process (FIG. 1, panels (i) through (iii), Masuda, H.; Fukuda, K. Science 1995, 268, 1466-1468.) The anodization was carried out at 40 V D.C. at 15-17° C. A one-hour second anodization step resulted in an anodic alumina template with nano-channel depth of about 5 μm. To reduce the thickness of the barrier layer facilitating Ag deposition, a third anodization was carried out in 0.2 M phosphoric acid for 10 min under the same conditio...

example 2

Add Analyte then Etch Analysis vs. Etch then Add Analyte Analysis

[0075]In order to produce a clean and uniformly Ag-filled surface for SERS spectroscopy, the Ag-filled PAO (Ag-PAO) template was epoxy-glued to a silicon wafer oxide-side down and the aluminum on the backside of Ag-PAO was removed by etching in saturated aqueous HgCl2 for 1 h (FIG. 1, panels (vi) to (vii). The alumina matrix of the resulting Ag-PAO templates was then partially etched in 0.1 M aqueous NaOH for 10 min to expose the tips of Ag nanowires (FIG. 1, panel (viii)). The templates were then dipped in 1 mM an ethanolic benzenethiol (BT) solution for 10 min. The foregoing describes what we will refer to as the add-analyte-then-etch method (FIG. 1, scheme (a)). The BT-modified Ag-PAO templates were then immersed in 0.1 M NaOH solution for variable lengths of time from 30 to 450 s in 30 s intervals. Before each Raman measurement, the template was taken out of the etchant and washed with distilled water and dried und...

example 3

Observing SERS while Etching

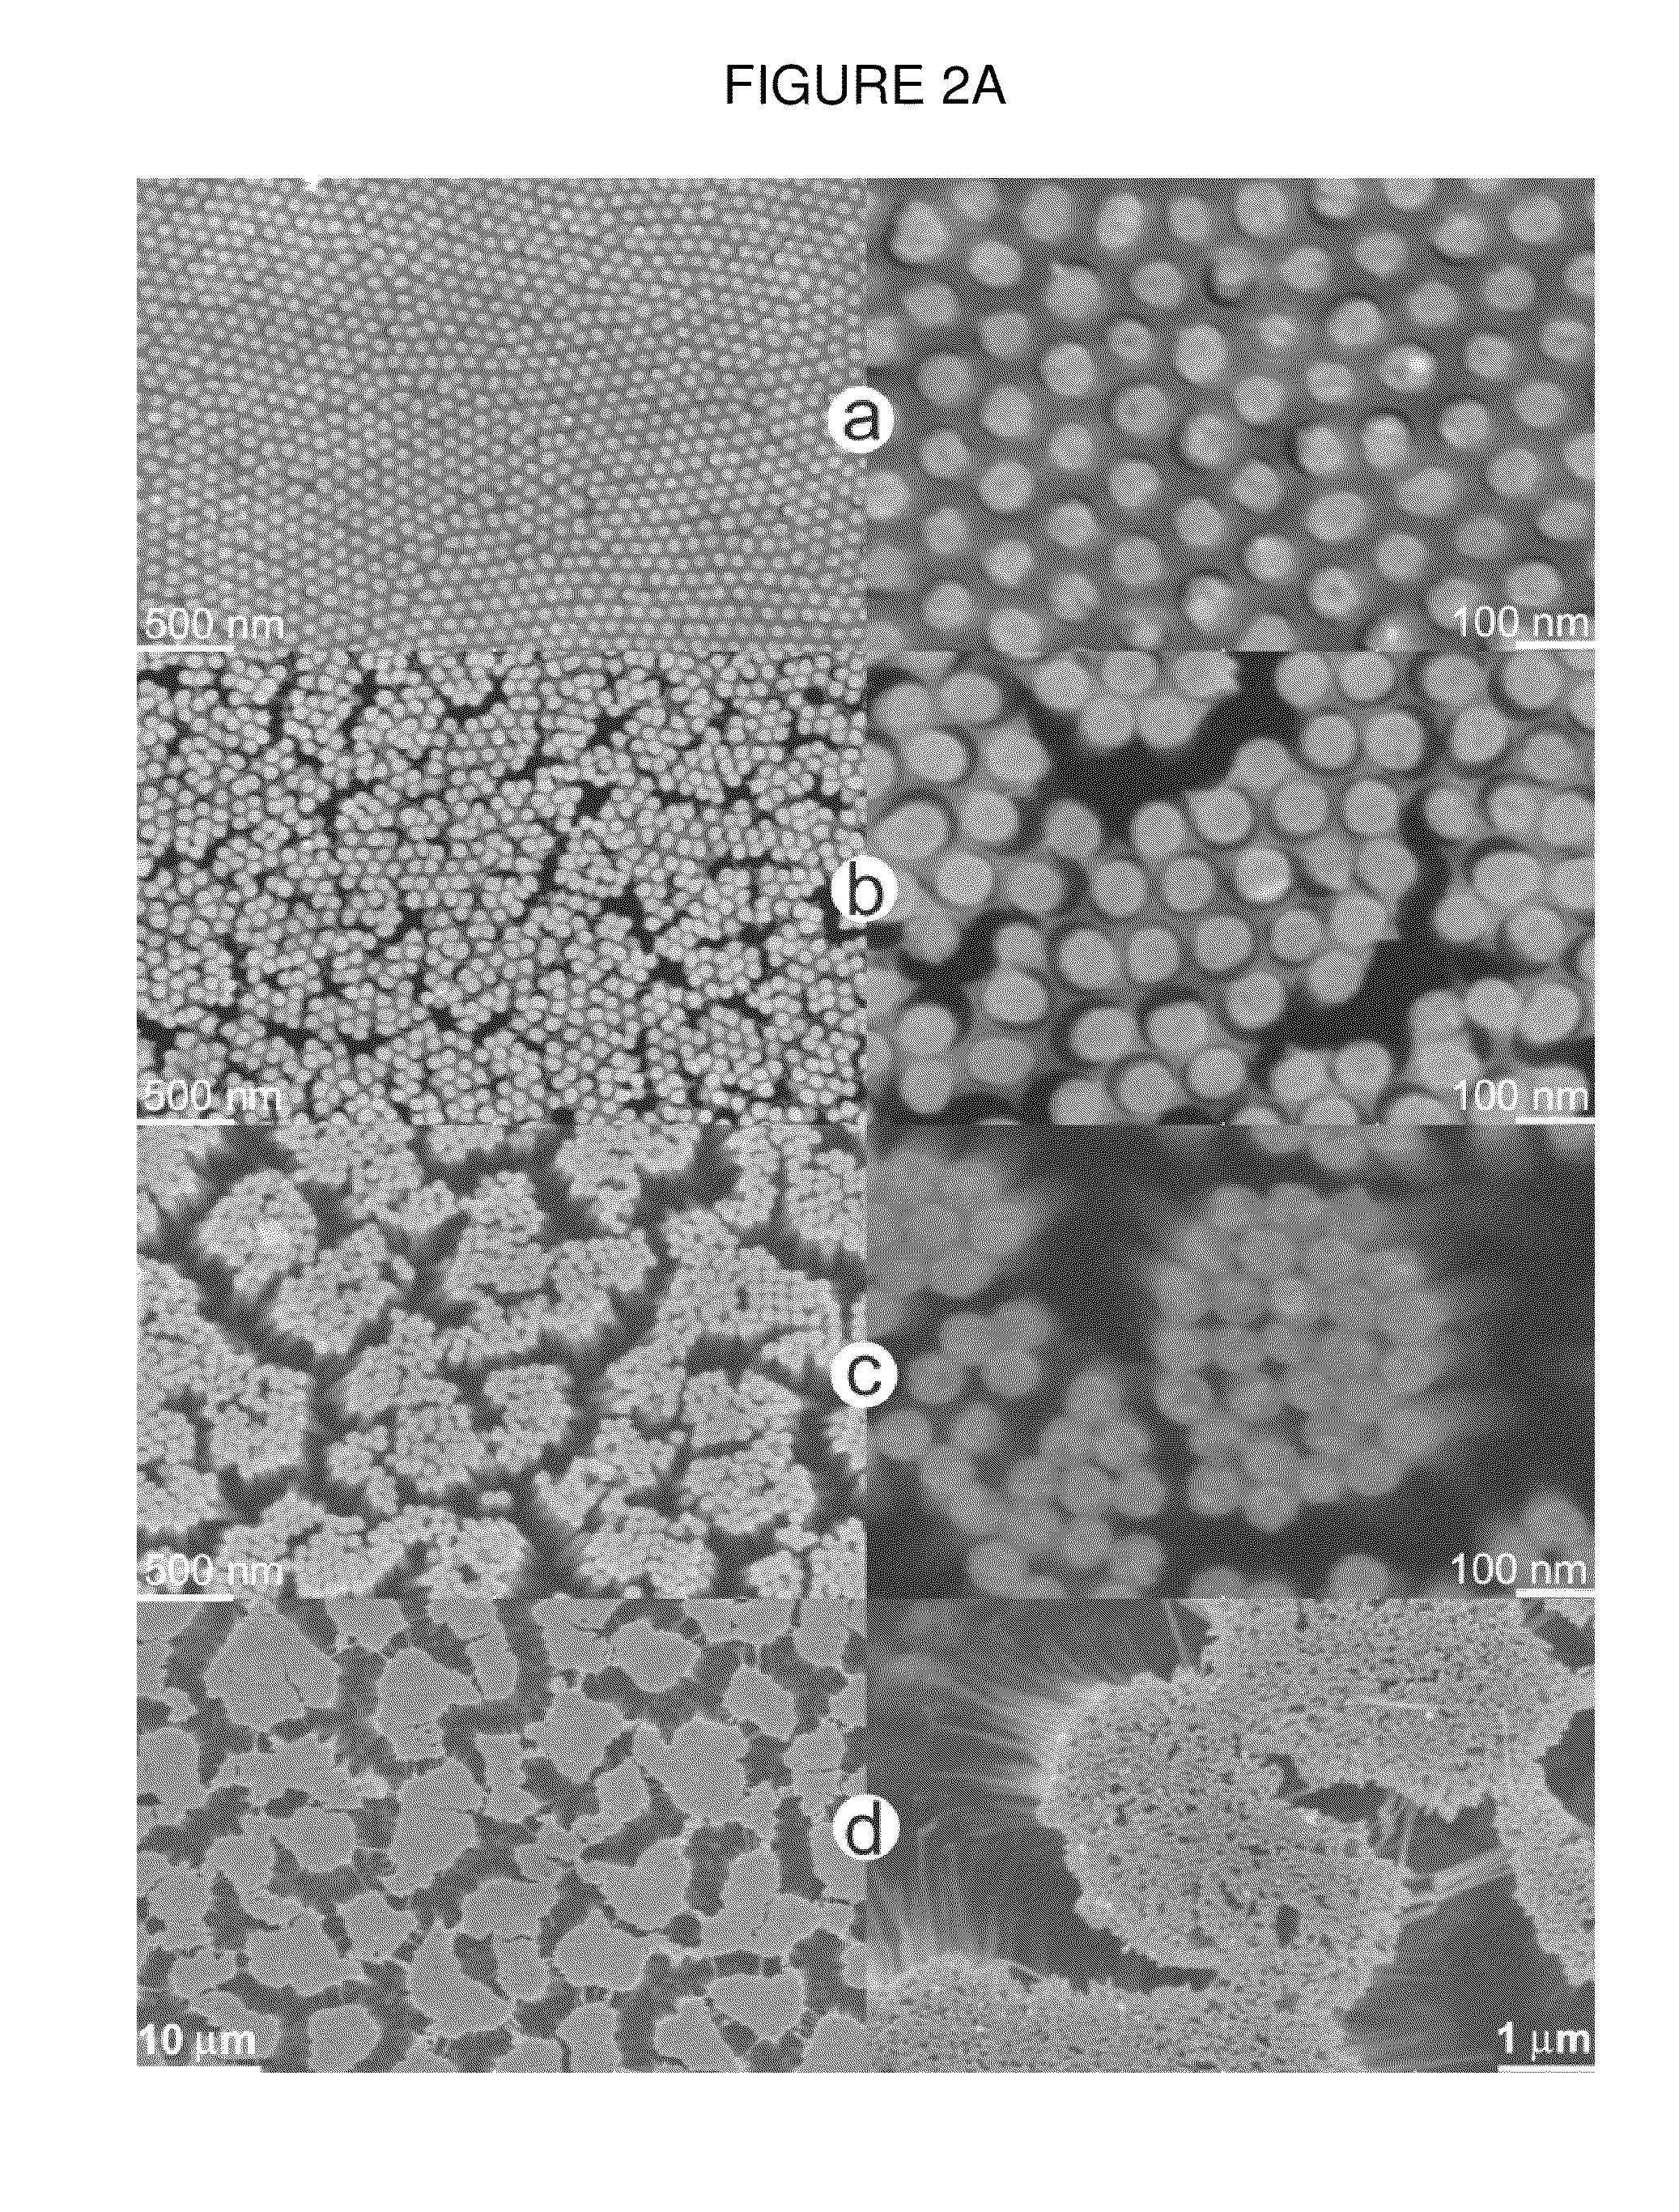
[0083]Another approach to etching and analyte analysis is illustrated in FIGS. 4-6. The tips of the nanowires of Ag-filled PAO template are functionalized with diaminoazobenzene (DAAB, shown at left in FIG. 4, panel (a)), which serves as the analyte in for purposes of this example, at the open end of the pores. The template is etched continuously in phosphoric acid while the SERS spectrum is recorded. FIG. 4, panel (a) shows a schematic of the method used, where the substrate is shown open-pore side up, with 1-2 mm of nanowires exposed. These exposed nanowire tips are functionalized with DAAB analyte. The substrate is then immersed in 7% phosphoric acid and SERS spectra are taken while etching occurs. FIG. 4, panel (b) shows a representation of the nanowires' conformation as etching continues. Step (I) of panel (b) shows that as etching begins, the nanowires remain vertical and widely separated. As etching continues the nanowires begin to spacially conden...


PUM


Abstract

Methods of analysis, and compositions relating to such, to determine the presence or absence of an analyte in a sample utilizing a composite substrate which facilitates surface enhanced Raman spectroscopy through the use of ‘hot spots’ of the form ‘metal / analyte / metal’ are presented. Additionally, substrates which contain ‘hot spots’ of the form ‘metal / analyte / metal’ and substrates which facilitate the formation of ‘hot spots’ of the form ‘metal / analyte / metal’ are presented as well as methods for making these substrates.

Description

CROSS REFERENCE TO RELATED APPLICATIONS[0001]This application claims the benefit under 35 U.S.C. §119(e) of Prior U.S. provisional application Ser. No. 60 / 897,210 filed Jan. 23, 2007, the disclosure of which application is herein incorporated by reference.INTRODUCTION[0002]Surface-Enhanced Raman Spectroscopy (SERS) is an analytical technique based on an effect discovered in the 1970's. Briefly, SERS is a highly enhanced form of Raman spectroscopy, an optical analysis technique that can provide molecular identification and quantification by recording a spectrum that displays characteristic vibrational fingerprints of molecules or constituent parts of molecules. SERS is enabled when the molecules whose identity one wishes to determine (the analyte) reside in close proximity to a nanostructured metal surface (the SERS-active substrate or surface), which provides a significant increase in the intensity of the Raman spectrum over standard Raman spectroscopy. When the analyte resides in c...

Claims


Application Information

Patent Timeline
Patent Type & Authority Patents(United States)
IPC IPC(8): G01J3/44
CPCG01N21/658Y10T428/24998
Inventor MOSKOVITS, MARTINLEE, SEUNG JOONPAVEL, IOANA
Owner RGT UNIV OF CALIFORNIA
Learn More