Eureka AIR delivers breakthrough ideas for toughest innovation challenges, trusted by R&D personnel around the world.

System and method for curve fitting using randomized techniques

a curve fitting and random technique technology, applied in the field of data processing, can solve the problems of lse tending to generate the wrong line, erroneous data into the data set, and noise in the measured signal complicating the analysis of the resulting data, so as to improve the performance of the method

Inactive Publication Date: 2005-04-19
NATIONAL INSTRUMENTS
View PDF6 Cites 78 Cited by
  • Summary
  • Abstract
  • Description
  • Claims
  • Application Information

AI Technical Summary

Benefits of technology

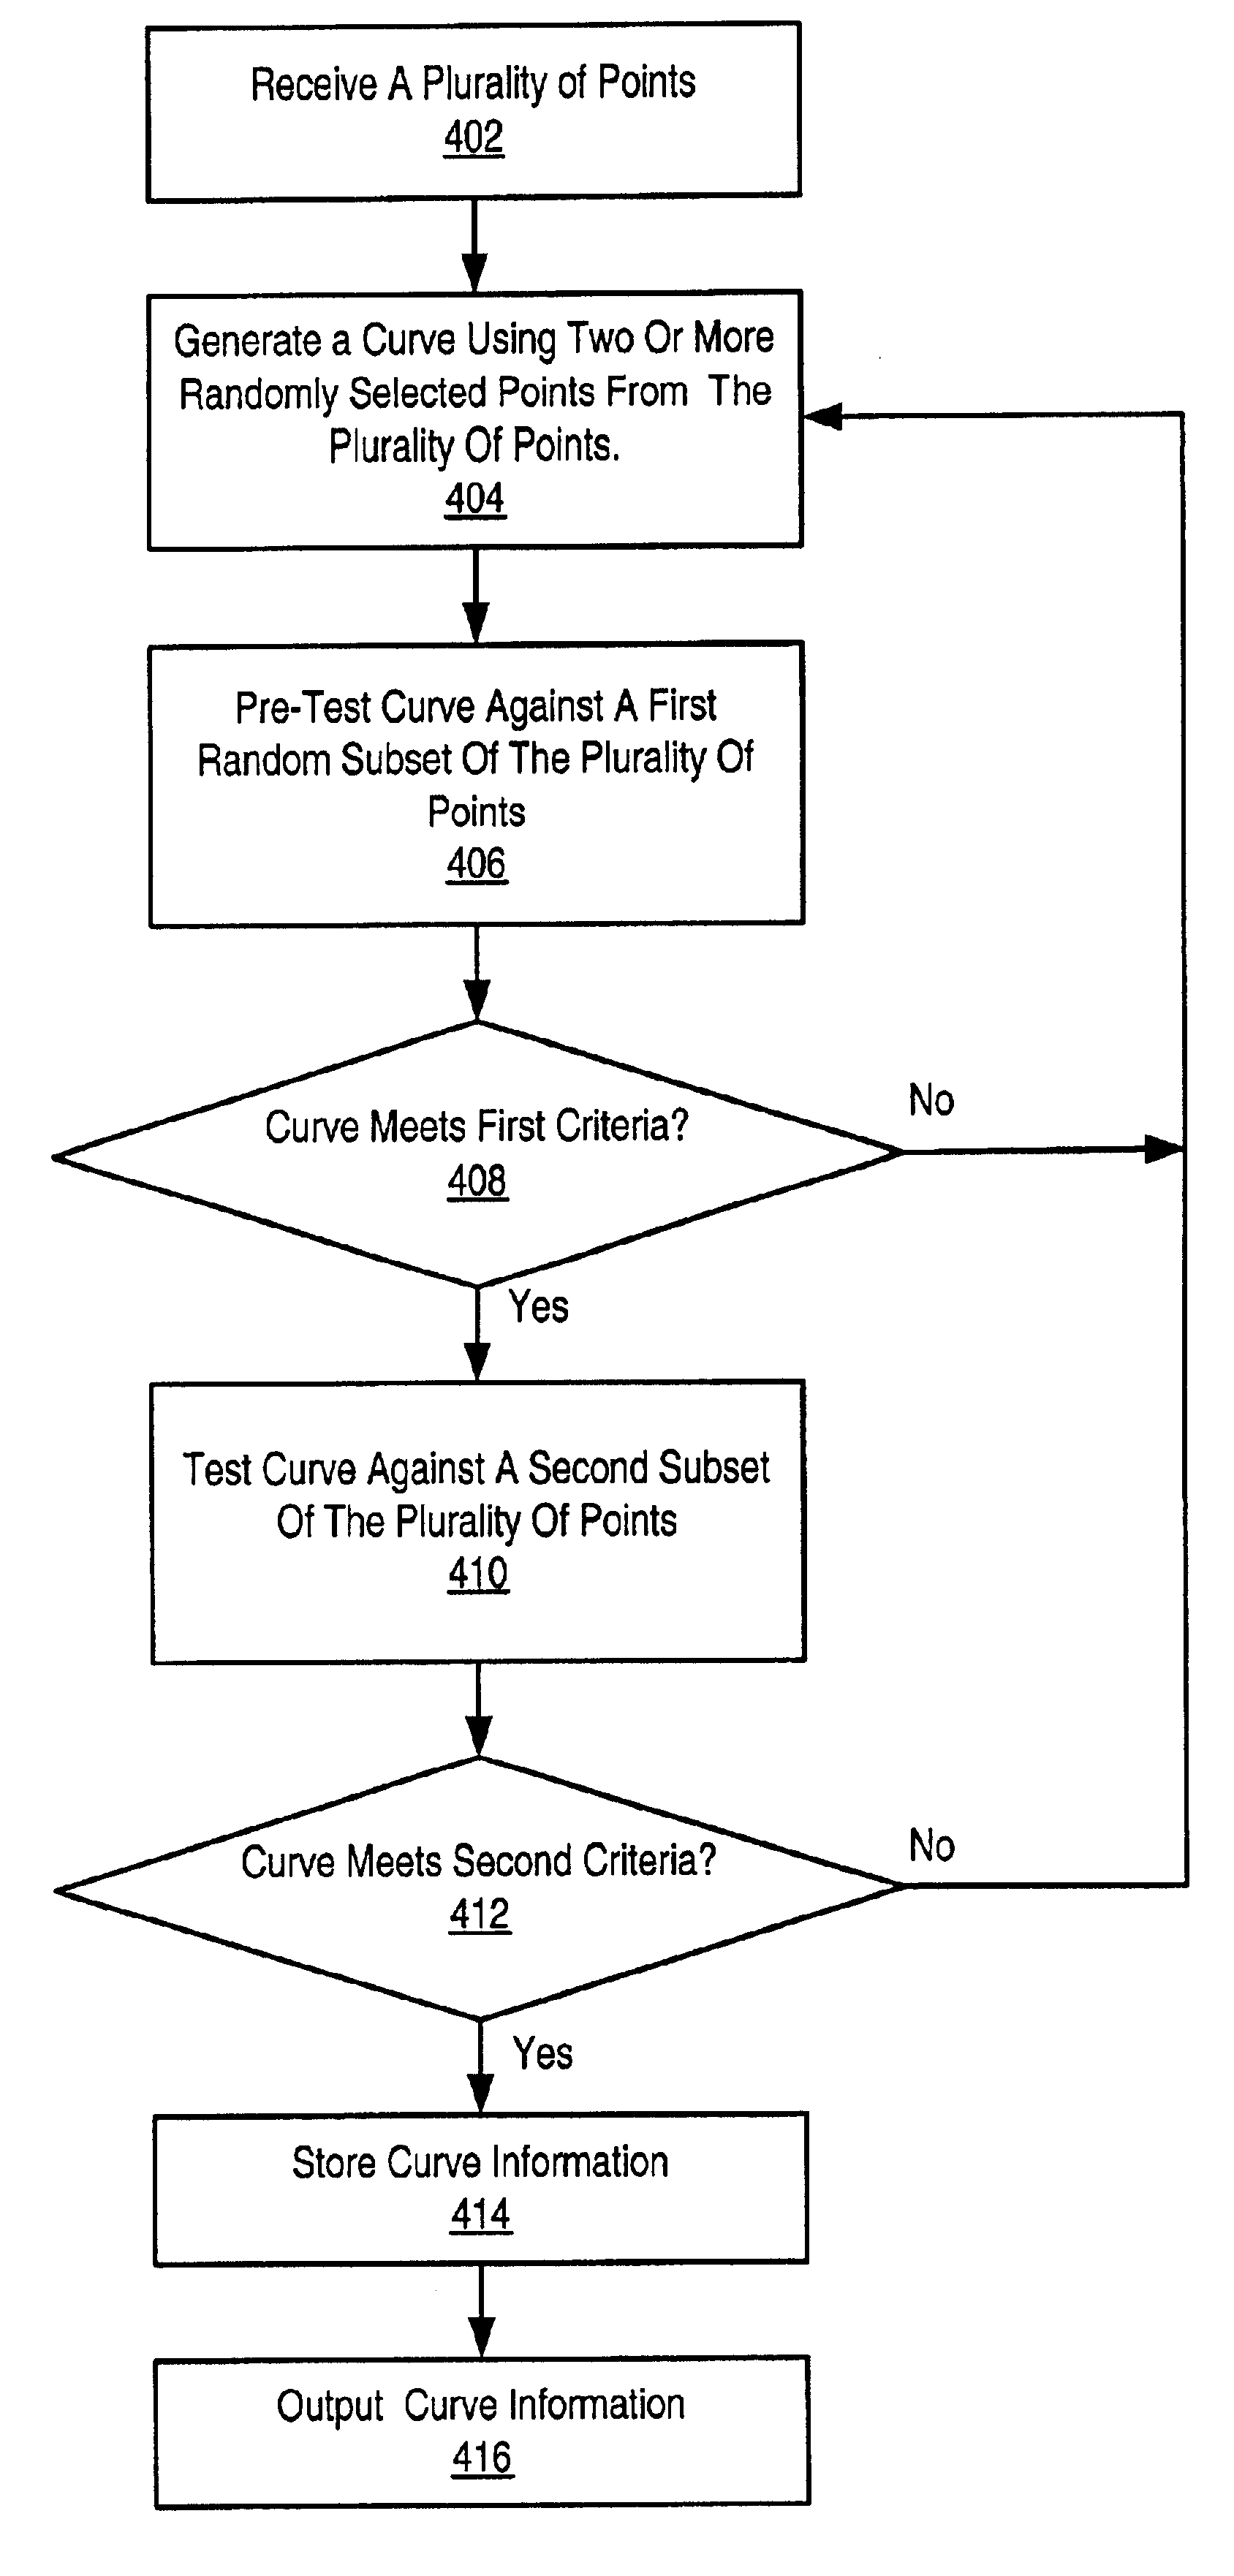
[0012]In one embodiment, the method may also include pre-testing the curve against a second subset of the plurality of data points, preferably smaller than the first subset, to produce second test results, and if the second test results meet second criteria, then performing the above testing and outputting information. By pre-testing each generated curve against a smaller subset before testing against the larger subset, bad curves may be discarded early in the process, improving performance. In one embodiment, pre-testing the curve against the second subset may include determining a number of the second subset of the plurality of data points which are within the specified radius of the curve. The second test results meeting the second criteria may include the number of the second subset of the plurality of data points which are within the specified radius of the curve meeting or exceeding a second threshold value or a specified fraction of the second subset.
[0022]A subset Pm of P may then be selected, where Pm comprises M data points, and tested against the generated curve. In the preferred embodiment, the subset Pm of P may be selected randomly. As described above, in an embodiment where the set P has been randomized and a random start position selected, the selection of random points from P may be made simply by traversing the list P sequentially, maintaining a current position in the list. This technique substantially increases the performance of the method. A distance from each point of Pm to the line may then be determined, producing a subset of Pm, where Pj comprises J data points in Pm whose distance from the line is less than or equal to the specified radius. For example, in the edge detection application, the number of pixels in the subset (Pm) whose distance from the curve is less than or equal to the specified pixel radius may be determined. In one embodiment, the resulting subset Pj may be recorded.
[0034]A new line Li+1, may then be fit to Ki+1, and a corresponding error, erri may be calculated for the fit. The iteration variable i may then be incremented, such that Li+1, and Ki+1 become the new Li and Ki, respectively. In a preferred embodiment, the fit of the new line Li+1, to Ki+1, may be performed as an incremental fit, wherein information from the previous iteration's fit is used to avoid calculating the new fit from scratch. This technique improves the performance of the method substantially. For each iteration that removes points or pixels, the numerical components in the line fit corresponding to those points or pixels are removed and the error of the new line fit is re-computed. This reduces the computation requirements of later fits to a trivial amount.

Problems solved by technology

In most real world measurement systems the presence of noise in the measured signal complicates the analysis of the resulting data.
Possible sources of noise include the environment in which the measurement is made, the sensors or actuators which produce the signal, and the data acquisition or measurement equipment which receives the signal from the sensor / actuator, among others.
Such noise may introduce erroneous data into the data set, producing “outlying” data points, also called “outliers”, which may lie outside the ideal range of the data.
However, when the data are not well behaved, i.e., when the data set contains multiple clusters of data points, LSE tends to generate the wrong line.
For more extreme situations more complicated methods exist but tend to be computationally very complex.
Approaches such as linear by parts principal components and non-linear optimal fitting rely on clustering, which is computationally very expensive and usually is an inadequate approach for many applications.
Although this procedure is quite robust, it is computationally intensive, as well as memory intensive if an accurate solution is required.
In addition to being calculationally expensive, many of these strategies suffer from convergence problems, which makes them unsuitable for many kinds of applications.
In many applications, such as image processing, the curve fitting must be performed in or near real time, making the computationally expensive methods described above unfeasible.

Method used


Image

  • System and method for curve fitting using randomized techniques
  • System and method for curve fitting using randomized techniques
  • System and method for curve fitting using randomized techniques

Examples


Embodiment Construction

FIG. 1—Computer System

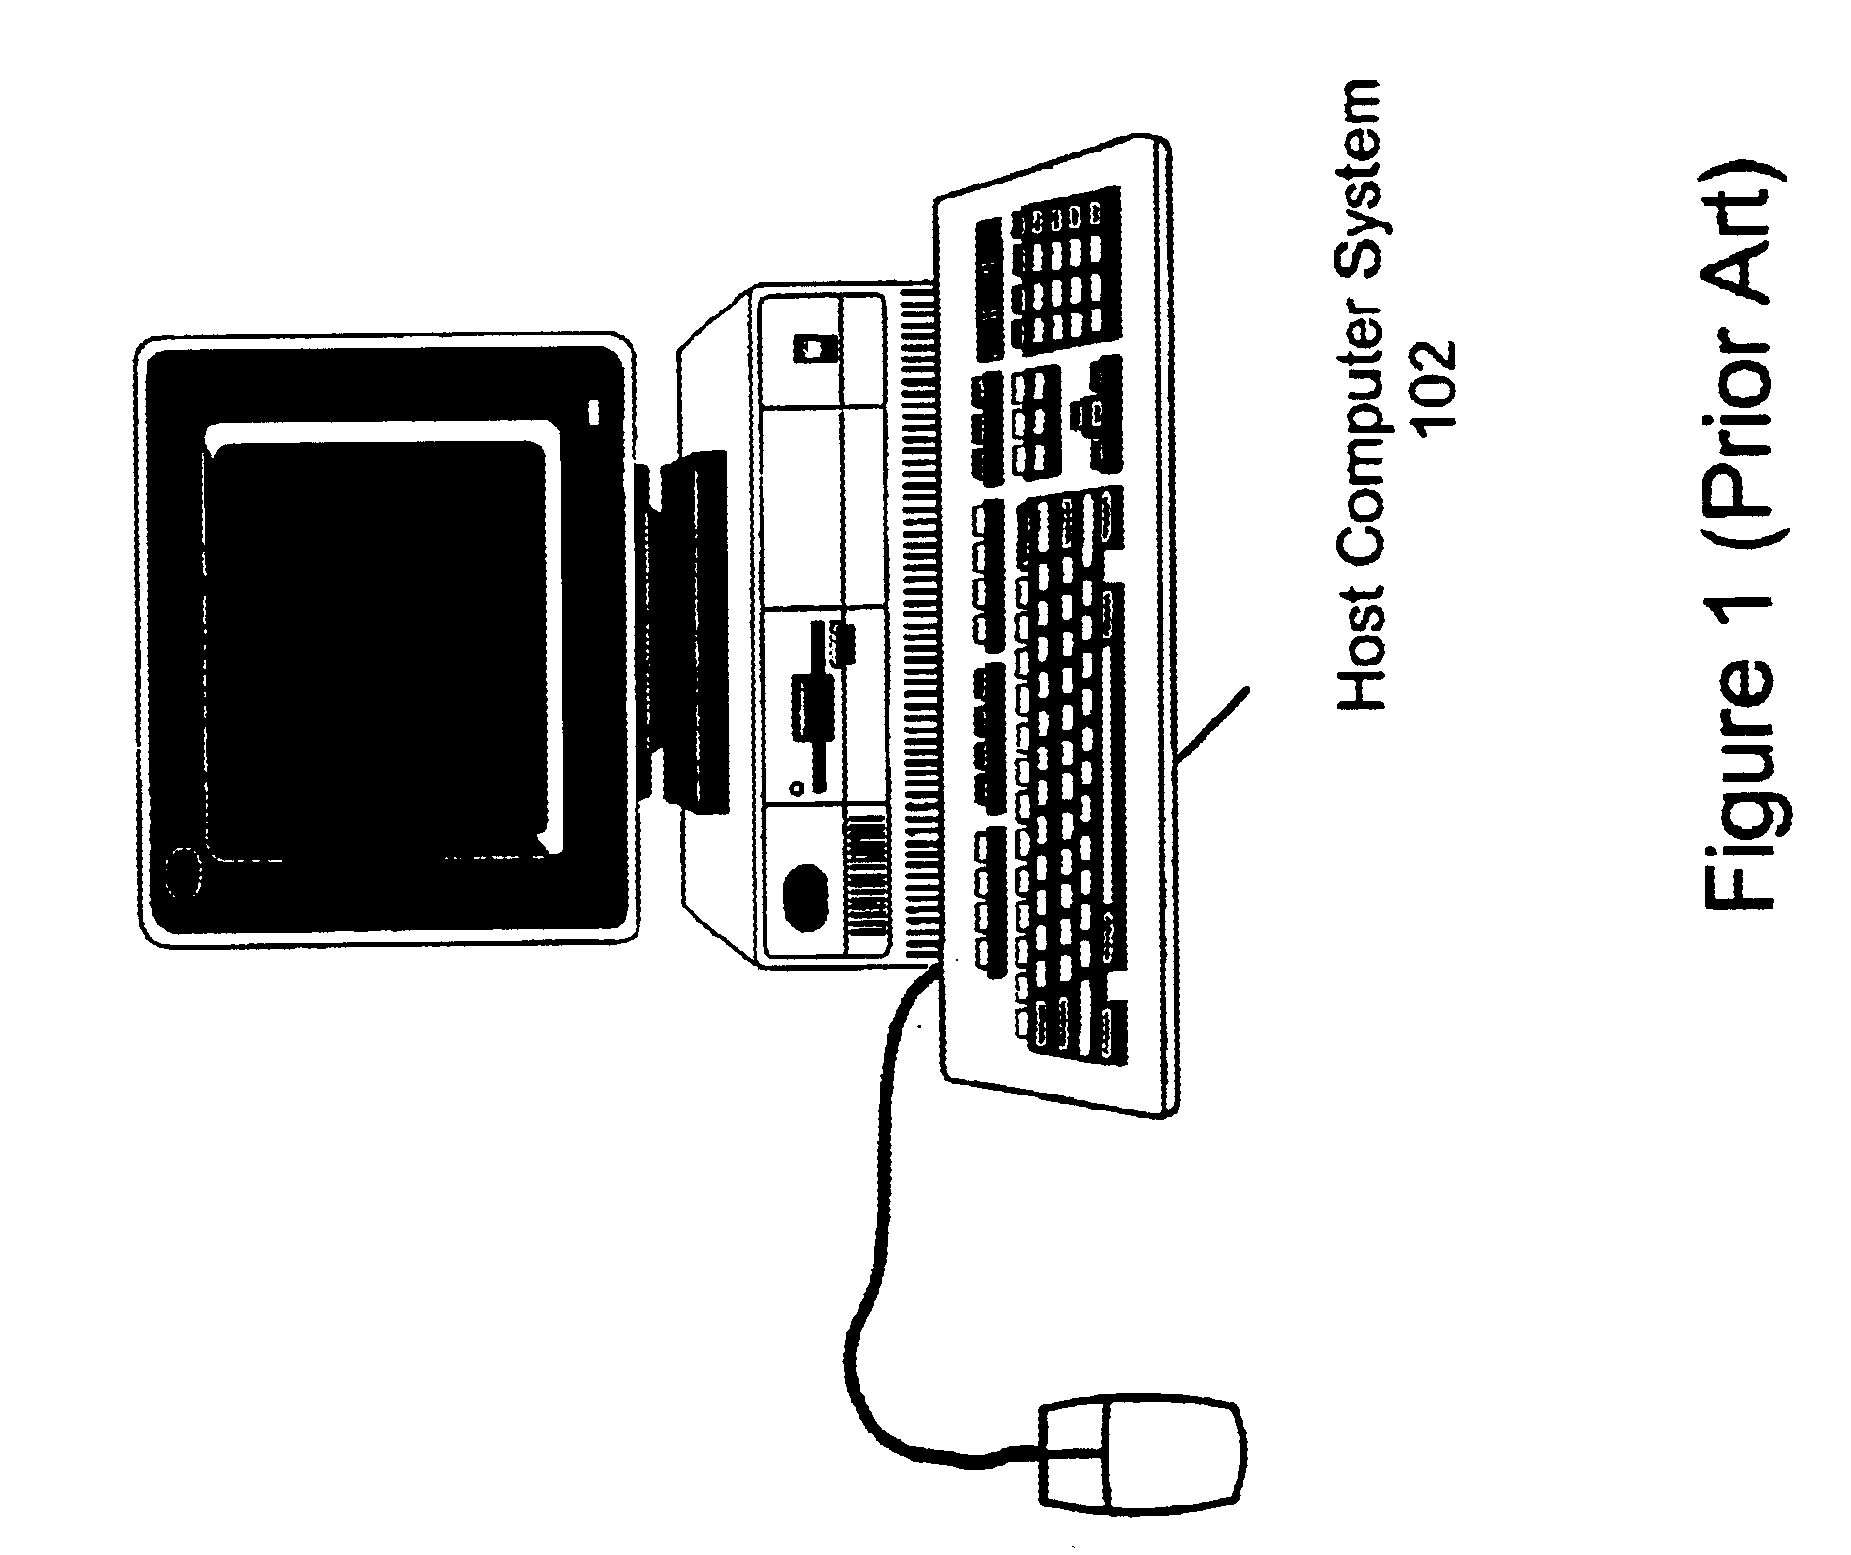
[0053]FIG. 1 illustrates an exemplary computer system suitable for implementing various embodiments of the invention. The computer system 102 may store and / or execute a software program which performs the method described in FIG. 3A-FIG. 7 below. In one embodiment, the computer system 102 may include a display device, such as a monitor, as well as a chassis and one or more I / O devices, such as a keyboard and / or mouse. However, the computer system may take any of various forms, such as a personal computer, or any type of device which includes a processor that executes instructions from a memory medium, or which includes programmable logic that has been configured to perform the methods described in FIGS. 3A and 3B. Exemplary computer systems include a personal computer, mainframe computer, a personal computing device (PDA), television, embedded device, and other systems. Thus, as used herein, the term computer system is intended to encompass any of various devic...


PUM


Abstract

A system and method for performing a curve fit on a plurality of data points. In an initial phase, a subset Pmax of the plurality of points which represents an optimal curve is determined. This phase is based on a statistical model which dictates that after trying at most Nmin random curves, each connecting a randomly selected two or more points from the input set, one of the curves will pass within a specified radius of the subset Pmax of the input points. The subset Pmax may then be used in the second phase of the method, where a refined curve fit is made by iteratively culling outliers from the subset Pmax with respect to a succession of optimal curves fit to the modified subset Pmax at each iteration. The refined curve fit generates a refined curve, which may be output along with a final culled subset Kfinal of Pmax.

Description

FIELD OF THE INVENTION[0001]The present invention relates to the field of data processing, and more particularly to curve fitting using randomized or statistical techniques.DESCRIPTION OF THE RELATED ART[0002]Many scientific and engineering tasks involve fitting a curve or line to data in order to characterize the data. Examples of such data include temperature data as produced by a thermocouple or thermometer, pressure data produced by a pressure sensor, and voltage or current data, among others. Line or curve fitting of data is also a common approach in the field of image processing and analysis, for example, in edge detection. In most real world measurement systems the presence of noise in the measured signal complicates the analysis of the resulting data. Possible sources of noise include the environment in which the measurement is made, the sensors or actuators which produce the signal, and the data acquisition or measurement equipment which receives the signal from the sensor / ...

Claims


Application Information

Patent Timeline
IPC IPC(8): G06F17/17
CPCG06K9/6204G06F17/17G06V10/752
Inventor SCHMIDT, DARRENRAJAGOPAL, RAMWENZEL, LOTHARNAIR, DINESH
Owner NATIONAL INSTRUMENTS
Why Eureka
Eureka Blog
Learn More