
Systems and methods for performing analysis of a multi-tone signal

Inactive Publication Date: 2005-03-29
AGILENT TECH INC
View PDF3 Cites 6 Cited by
  • Summary
  • Abstract
  • Description
  • Claims
  • Application Information

AI Technical Summary

Benefits of technology

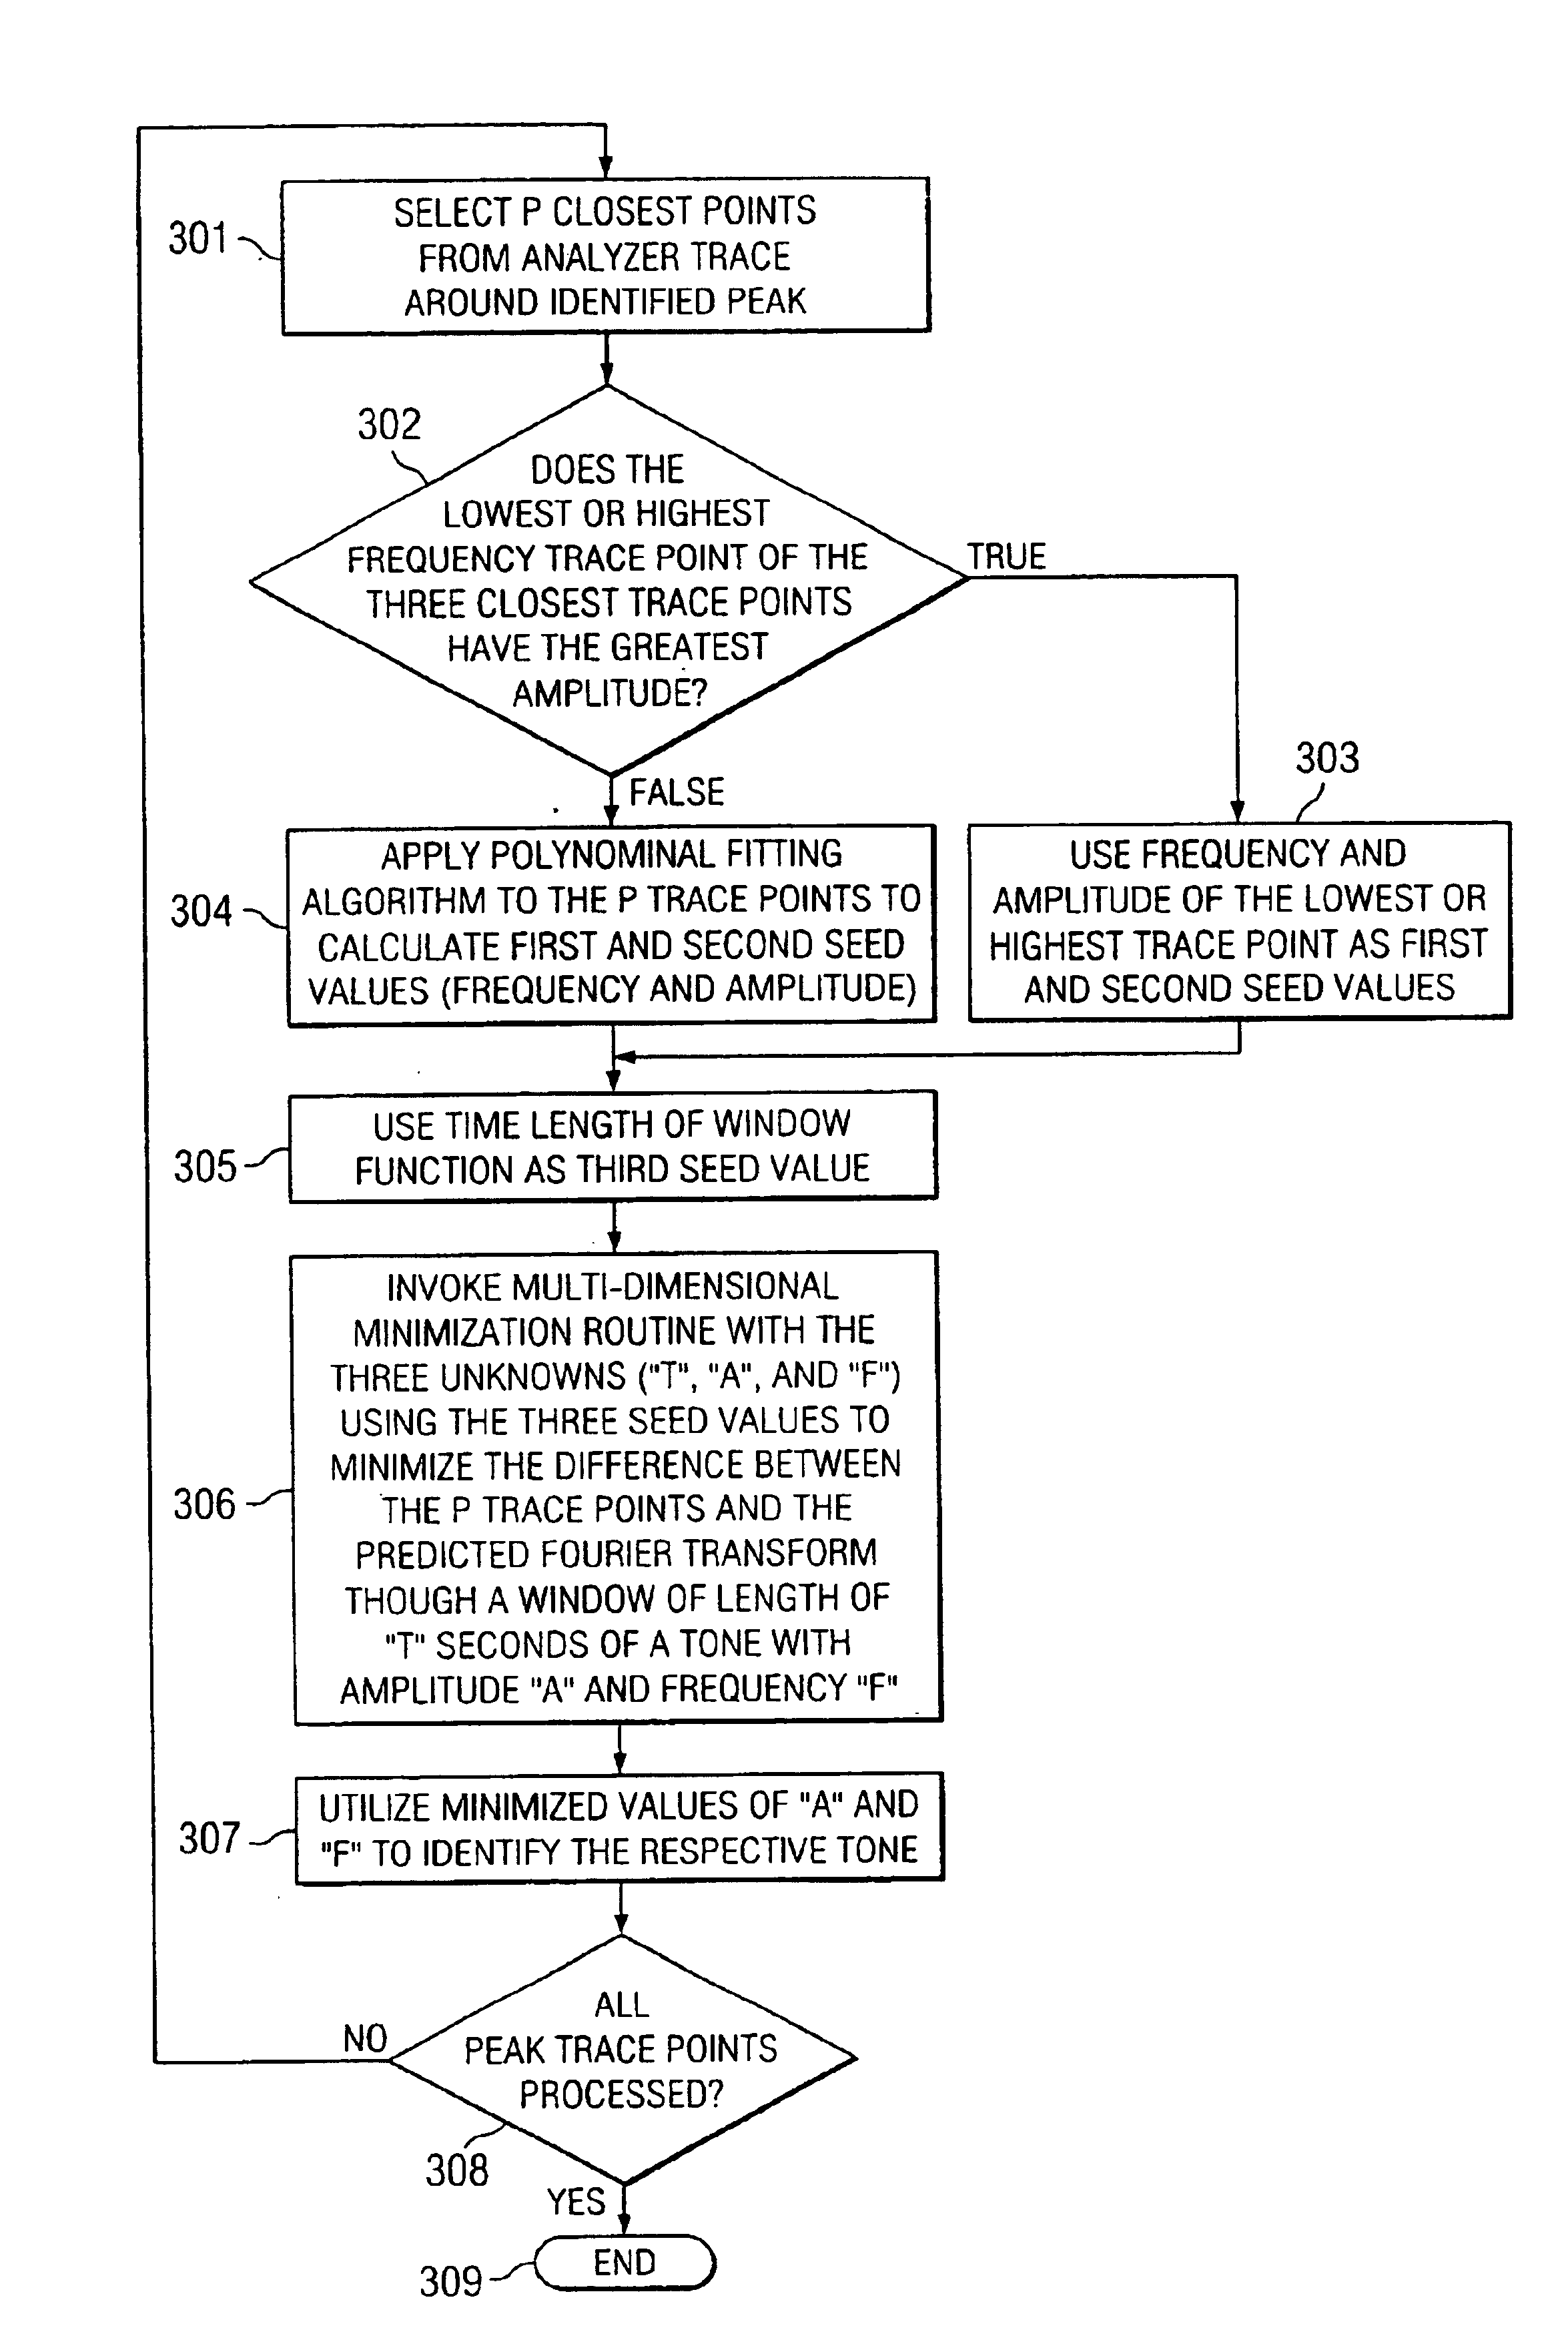
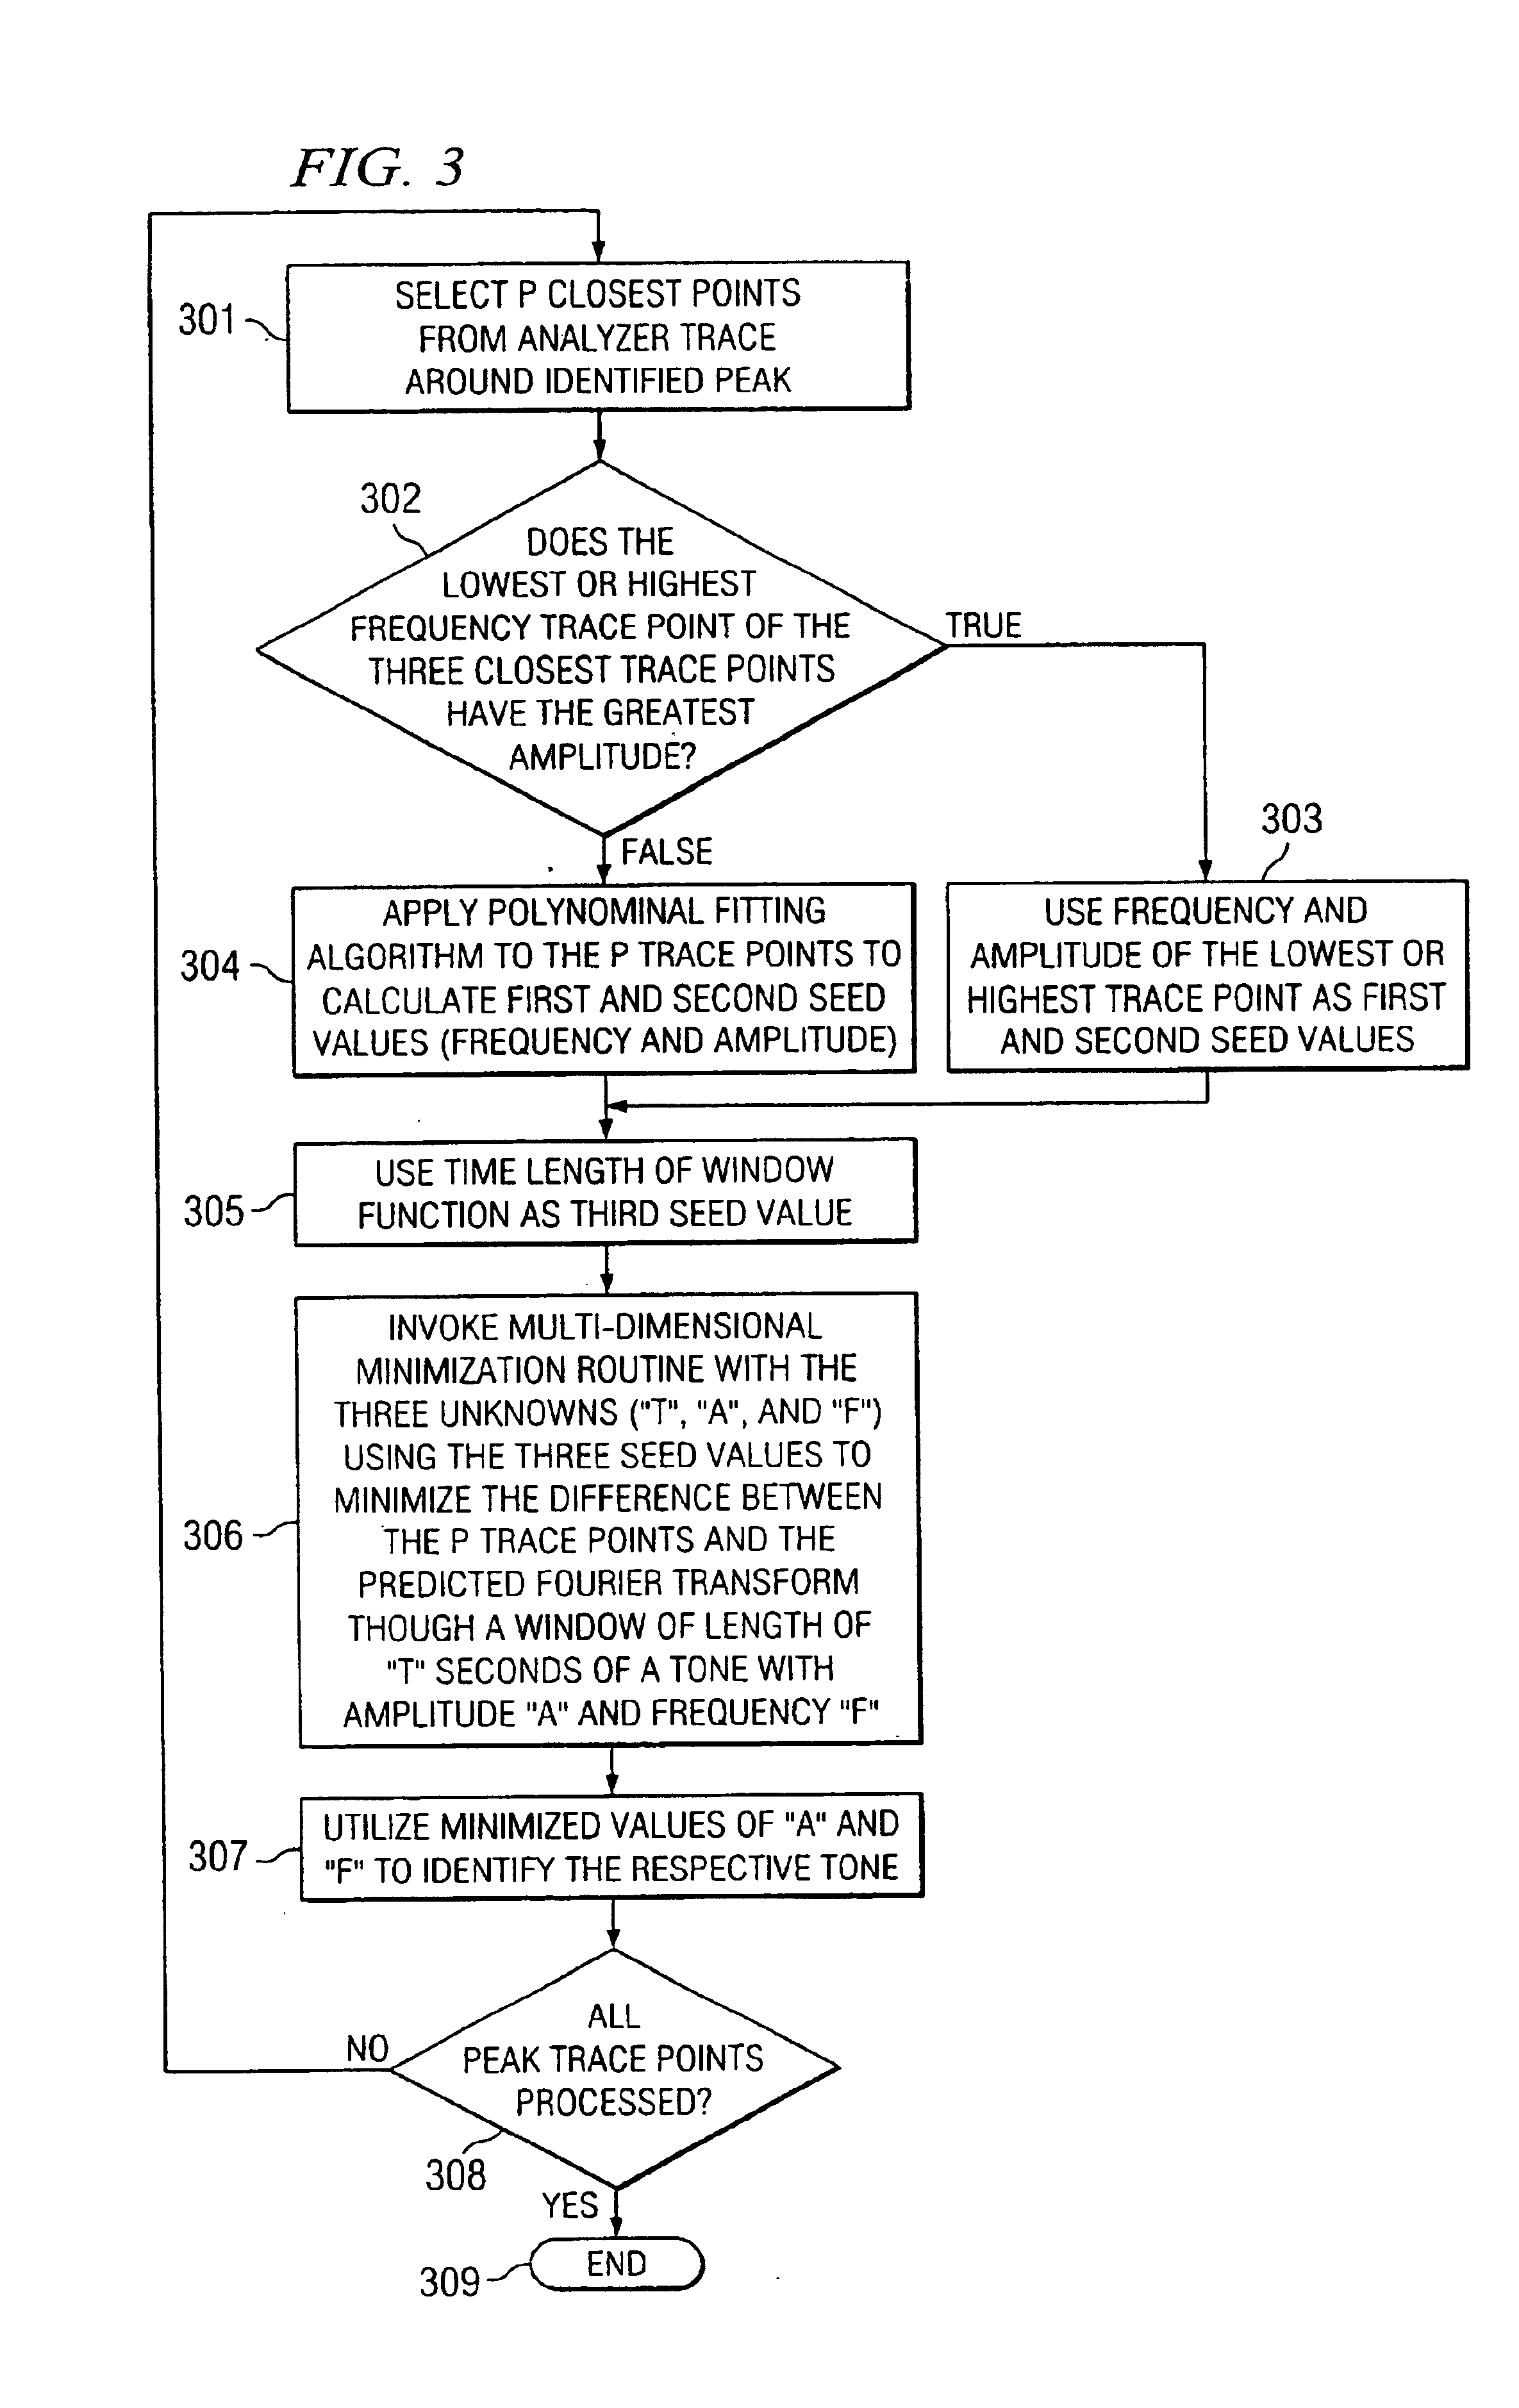
Representative embodiments are directed to systems and methods for processing analyzer trace data of a multi-tone signal to more accurately estimate the frequencies and amplitudes of the tones of the multi-tone signal. Representative embodiments begin with an identification of peak trace points from trace data generated through a standard Hanning (or other raised-cosine) window. The identified peak points are then subjected to data processing to generate the more accurate estimates of the frequencies and amplitudes of the tones of the multitone signal. Specifically, the identified peak points are used to generate seed values for an error minimization algorithm. The error minimization algorithm minimizes the sum of differences between a plurality of trace points surrounding a tone of the multi-tone signal and the predicted Fourier transform through a raised-cosine window length of “T” seconds of a theoretical tone of amplitude “A” with frequency “F.” After the minimization algorithm has minimized the error function, the resulting minimized values of “A” and “F” are used to identify the amplitude and frequency of the respective tone of the multi-tone signal. The minimization algorithm is performed for each tone of the multi-tone signal.

Problems solved by technology

Accordingly, a simple marker measurement is unsuitable for measuring multi-tone signals.
The measurement of any single-tone that does not lie exactly at the analyzer center frequency and the measurement of tone(s) produced by equipment that is not locked to the same frequency as the analyzer present similar complications.
Moreover, the measurement of the accurate amplitude and frequency of each tone of a multi-tone signal where the exact frequencies of the tones are unknown beforehand is quite complicated.
However, the accuracy of the gathered frequency information is limited by the frequency resolution between the analyzer trace points.
Moreover, noise effects may also cause the trace point with the peak amplitude to not be the trace point that is closest to the actual peak point.
Thus, the Flattop Fourier window causes frequency measurement to be quite difficult.
However, this may cause the test time to increase and may cause the measurement to become impractical.
However, this requires multiple sweeps.
This factor may dramatically increase the acquisition time of the analyzer.
However, amplitude accuracy may be lost.
Clearly, this amount of potential deviation is unsuitable if accurate amplitude measurements are necessary for a particular application.

Method used


Image

  • Systems and methods for performing analysis of a multi-tone signal
  • Systems and methods for performing analysis of a multi-tone signal
  • Systems and methods for performing analysis of a multi-tone signal

Examples


Embodiment Construction

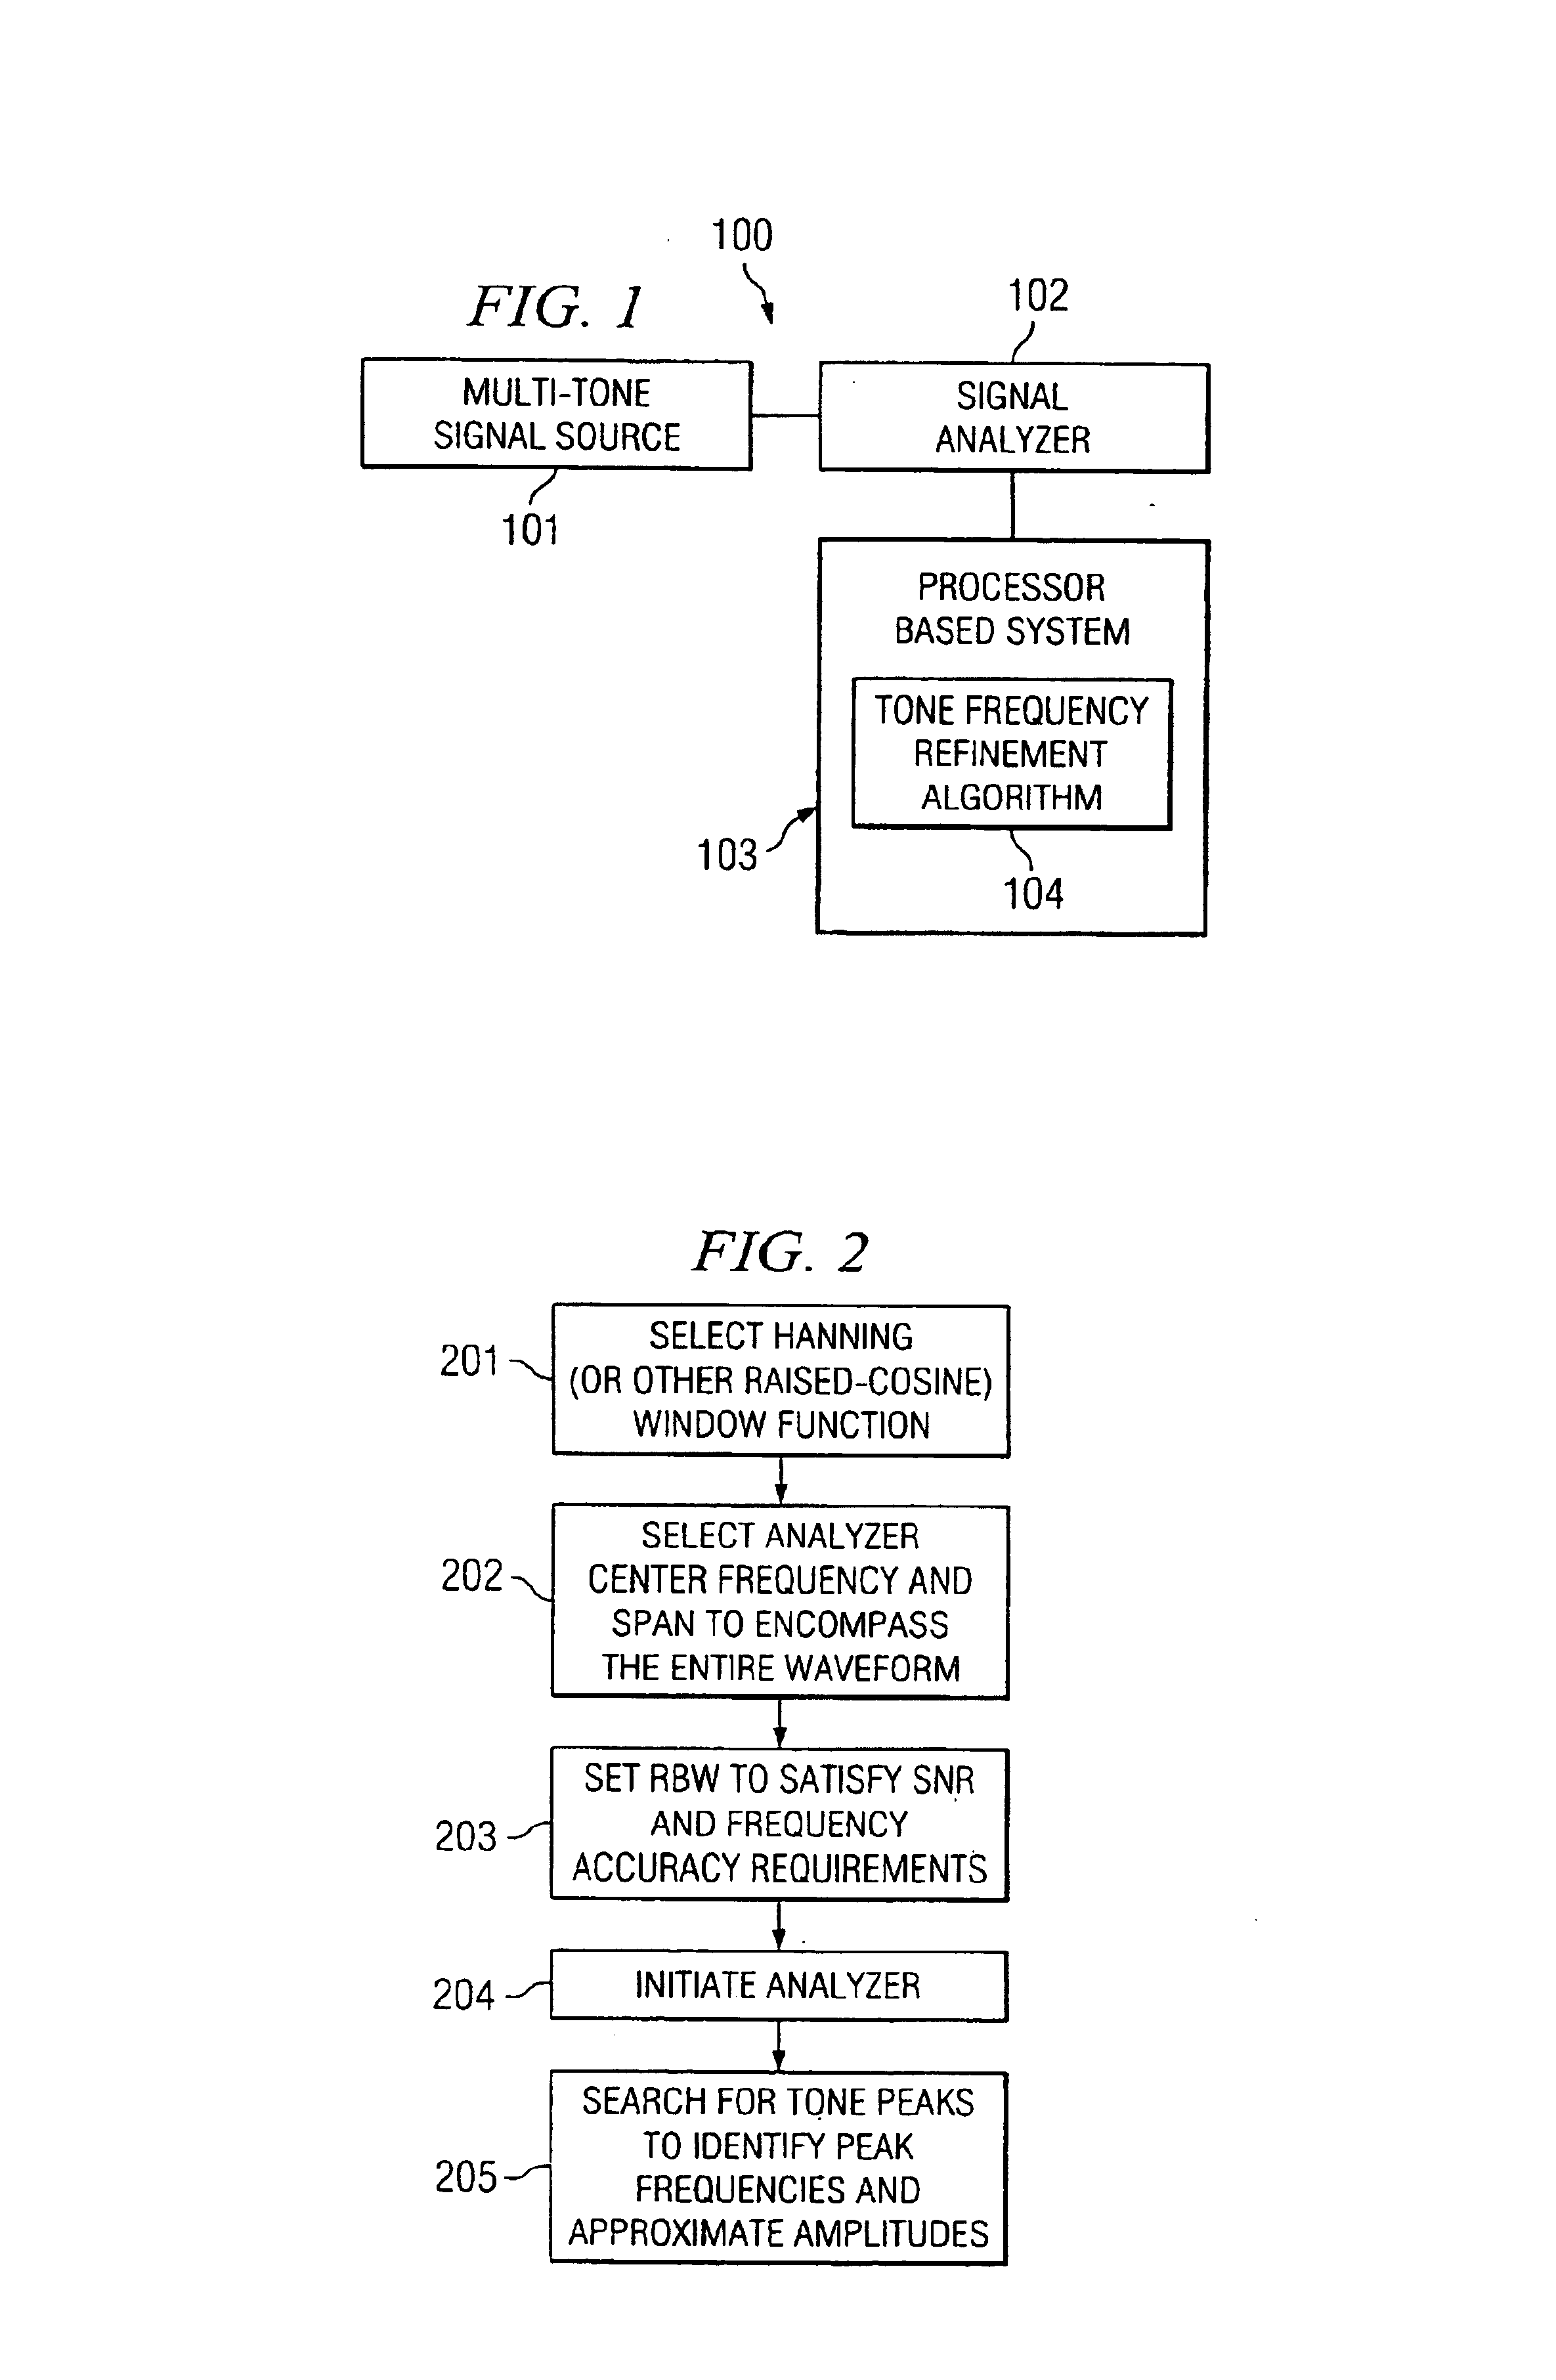
Referring now to the drawings, FIG. 1 depicts system 100 for analyzing a multi-tone signal according to representative embodiments. System 100 includes multi-tone signal source 101 and signal analyzer 102. Signal analyzer 102 maybe implemented utilizing any number of commercially available signal analyzers such as Agilent Technologies, Inc.'s 89400 and 89600 series VSAs. Signal analyzer 102 may be communicatively coupled to processor-based system 103 (e.g., a personal computer). Processor based system 103 may comprise executable instructions stored on a suitable computer readable medium to define tone refinement algorithm 104 that is described in greater detail below. By receiving data associated with the trace generated by signal analyzer 102, tone refinement algorithm 104 may process the data to provide accurate amplitudes and frequencies of signal peaks in a multi-tone signal with a relatively low amount of complexity. Although tone refinement algorithm 104 is shown as being impl...


PUM


Abstract

Representative embodiments are directed to systems and methods for processing analyzer trace data of a multi-tone signal to more accurately estimate the frequencies and amplitudes of the tones of the multi-tone signal. Specifically, trace data may be processed to determine peak trace points. For each identified peak point, an error minimization algorithm minimizes the sum of differences between a plurality of trace points surrounding the respective peak point and the predicted Fourier transform through a raised-cosine window of a theoretical tone. The result of the minimization algorithm identifies the amplitude and frequency of a tone of the multi-tone signal with appreciable degree of accuracy.

Description

TECHNICAL FIELDThe present invention is related to frequency analysis of a signal and, more particularly, to identification of the frequencies and amplitudes of tones in a multi-tone signal.BACKGROUNDA number of devices are commercially available that analyze signals to facilitate the design, manufacturing, and calibration of electronic and communication devices and systems. Examples of signal analyzers include the Agilent Technologies, Inc.'s 89400 and 89600 series vector signal analyzers (VSA). When analyzing signals on a signal analyzer, the measured signal is typically presented in the form of a trace representing the frequency domain output of a Fourier transform calculated from samples of the measured signal. The trace consists of the individual points in the frequency domain. In general, an odd number of points are used so that the center point will lie exactly at the center frequency of the frequency span.For simple single-tone measurements, if the exact tone frequency is kn...

Claims


Application Information

Patent Timeline
IPC IPC(8): G01R23/00G06F19/00G06K9/00
CPCG06K9/0053G06F18/00G06F2218/10
Inventor ROSCOE, ANDREW J.
Owner AGILENT TECH INC
Learn More