
Time-of-flight mass spectrometer

a mass spectrometer and time-of-flight technology, applied in energy spectrometers, dynamic spectrometers, particle separator tube details, etc., can solve the problem of insufficient intensity of signal corresponding to low-concentration components of sample samples, inability to determine whether the situation has been caused, and insufficient sensitivity. the effect of dynamic rang

Active Publication Date: 2021-01-14
SHIMADZU CORP
View PDF0 Cites 4 Cited by
  • Summary
  • Abstract
  • Description
  • Claims
  • Application Information

AI Technical Summary

Benefits of technology

This patent relates to a method for using a detector called a microchannel plate in a Positive Displacement Time-of-Flight Mass Spectrometry (TOFMS) system. The detector can automatically determine the best voltage based on its response characteristics, without being affected by external factors like the sample or the device. This ensures consistent sensitivity and a wide dynamic range in measuring. It also allows for early identification of potential detector issues. Overall, this method improves the accuracy and reliability of measurements using the microchannel plate in TOFMS.

Problems solved by technology

Conversely, if the gain is too high, a signal which originates from noise or other factors that are not pulse signals will be incorrectly counted.
Therefore, if the gain of the detector is too low, the intensity of the signal corresponding to a low-concentration component of the sample cannot be sufficiently obtained due to the low detection sensitivity.
However, unlike the ion count value in the pulse-counting detector, the peak-intensity value does not always reflect the exact number of ions incident on the detector.
The same also applies in the case of a decrease in the number of ions reaching the detector due to a bad condition of a device other than the detector.
Therefore, when the peak-intensity value on the mass spectrum has decreased and the detector voltage must be increased to maintain a constant peak-intensity value, it is difficult for the user to determine whether the situation has been caused by the detector itself or other factors.

Method used


Image

  • Time-of-flight mass spectrometer
  • Time-of-flight mass spectrometer
  • Time-of-flight mass spectrometer

Examples


first modified example

[First Modified Example] Processing which Uses Number of Centroid Peaks

[0065]A profile spectrum has a continuous waveform in the temporal direction (or in the direction of the mass-to-charge ratio if the time axis is converted into the mass-to-charge-ratio axis). The mass spectrum creator 22 performs a centroid conversion of each peak detected in the profile spectrum to obtain a linear centroid peak. As is commonly known, the mass-to-charge ratio of a centroid peak is the position of the center of gravity of the original peak waveform. The height of the centroid peak is normally the area or height of the original peak waveform, although the height of the centroid peak is not important in the present case. Provided that each peak observed on a profile spectrum corresponds to an individual ion as described earlier, the number of centroid peaks equals the number of ions. Accordingly, each centroid peak is hereby assumed to be a pulse signal corresponding to an individual ion, and the d...

second modified example

[Second Modified Example] Processing which Uses Total of Intensities of Centroid Peaks

[0067]As opposed to the first modified example which does not use the intensity values of the centroid peaks for the determination of the detector voltage, the second modified example uses the intensity values of the centroid peaks for the determination of the detector voltage.

[0068]If the magnitude of the signal intensity corresponding to an individual ion in the detector 15 is equal to or less than a certain value, the peak corresponding to the individual ion will be treated as a noise peak and excluded from the detection even when the peak actually exists. Therefore, no centroid peak will be created for an individual ion if the magnitude of the signal intensity for the ion is not higher than a certain value. Accordingly, if a total ion chromatogram (TIC) is created by totaling the intensities of all centroid peaks within a predetermined time-of-flight range (or mass-to-charge-ratio range) which ...

third modified example

[Third Modified Example] Processing which Uses Total of Intensities of Peaks on Profile Spectrum

[0069]In the second modified example, the centroid TIC is used for the determination of the detector voltage. It is also possible to total the peak-top intensities of the peaks on the profile spectrum before the centroid conversion, in place of the intensities of the centroid peaks, to create a TIC to be used for the determination of the detector voltage.

[0070]That is to say, the detector voltage determiner 25 creates a TIC by totaling the peak-top signal intensities of all peaks detected within a predetermined time-of-flight range (or mass-to-charge-ratio range) which is supposed to correspond to the components in the standard sample in the profile spectrum, or the peak-top signal intensities of the peaks whose peak-top signal intensities are equal to or higher than a predetermined threshold. The relationship between this TIC and the detector voltage will also have an overall shape as sh...


PUM


Abstract

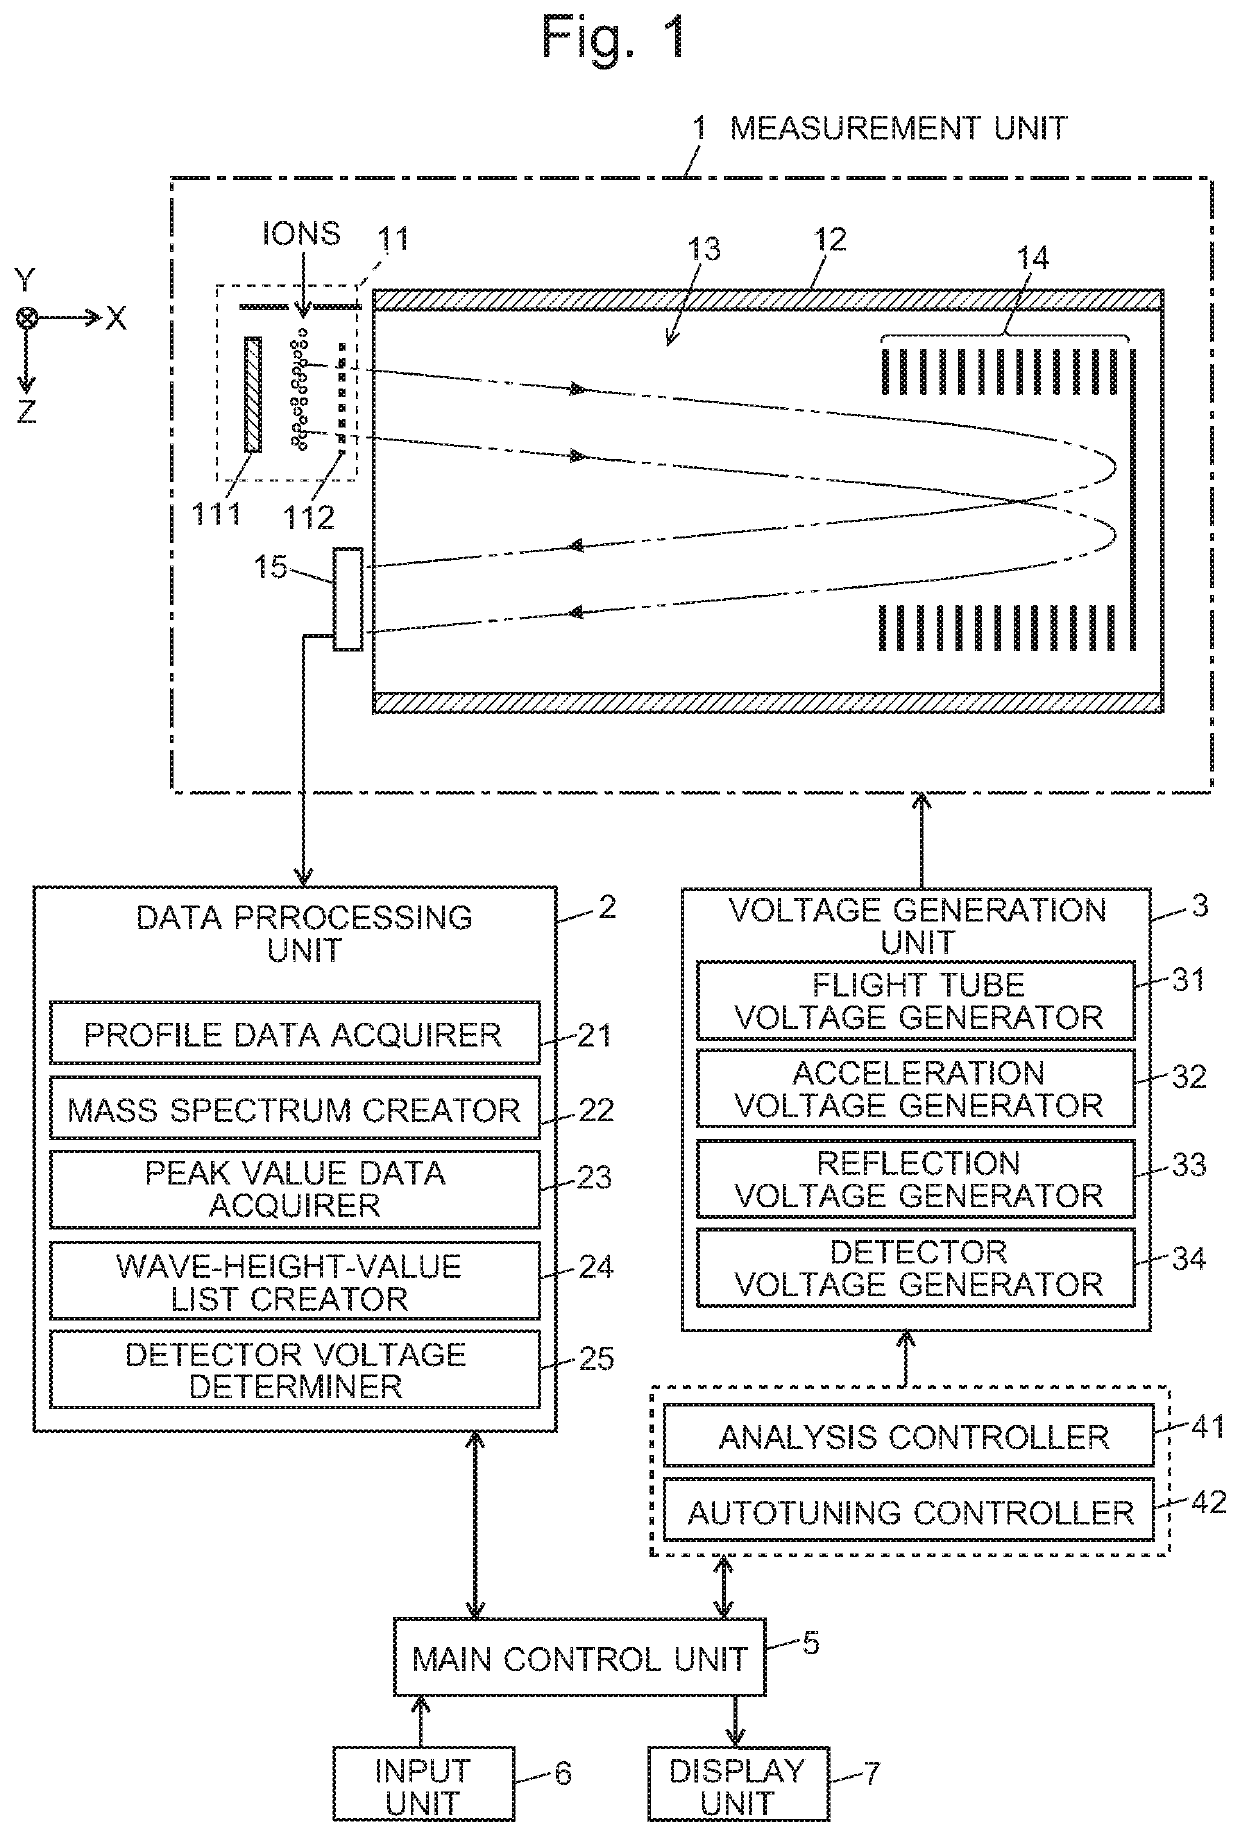
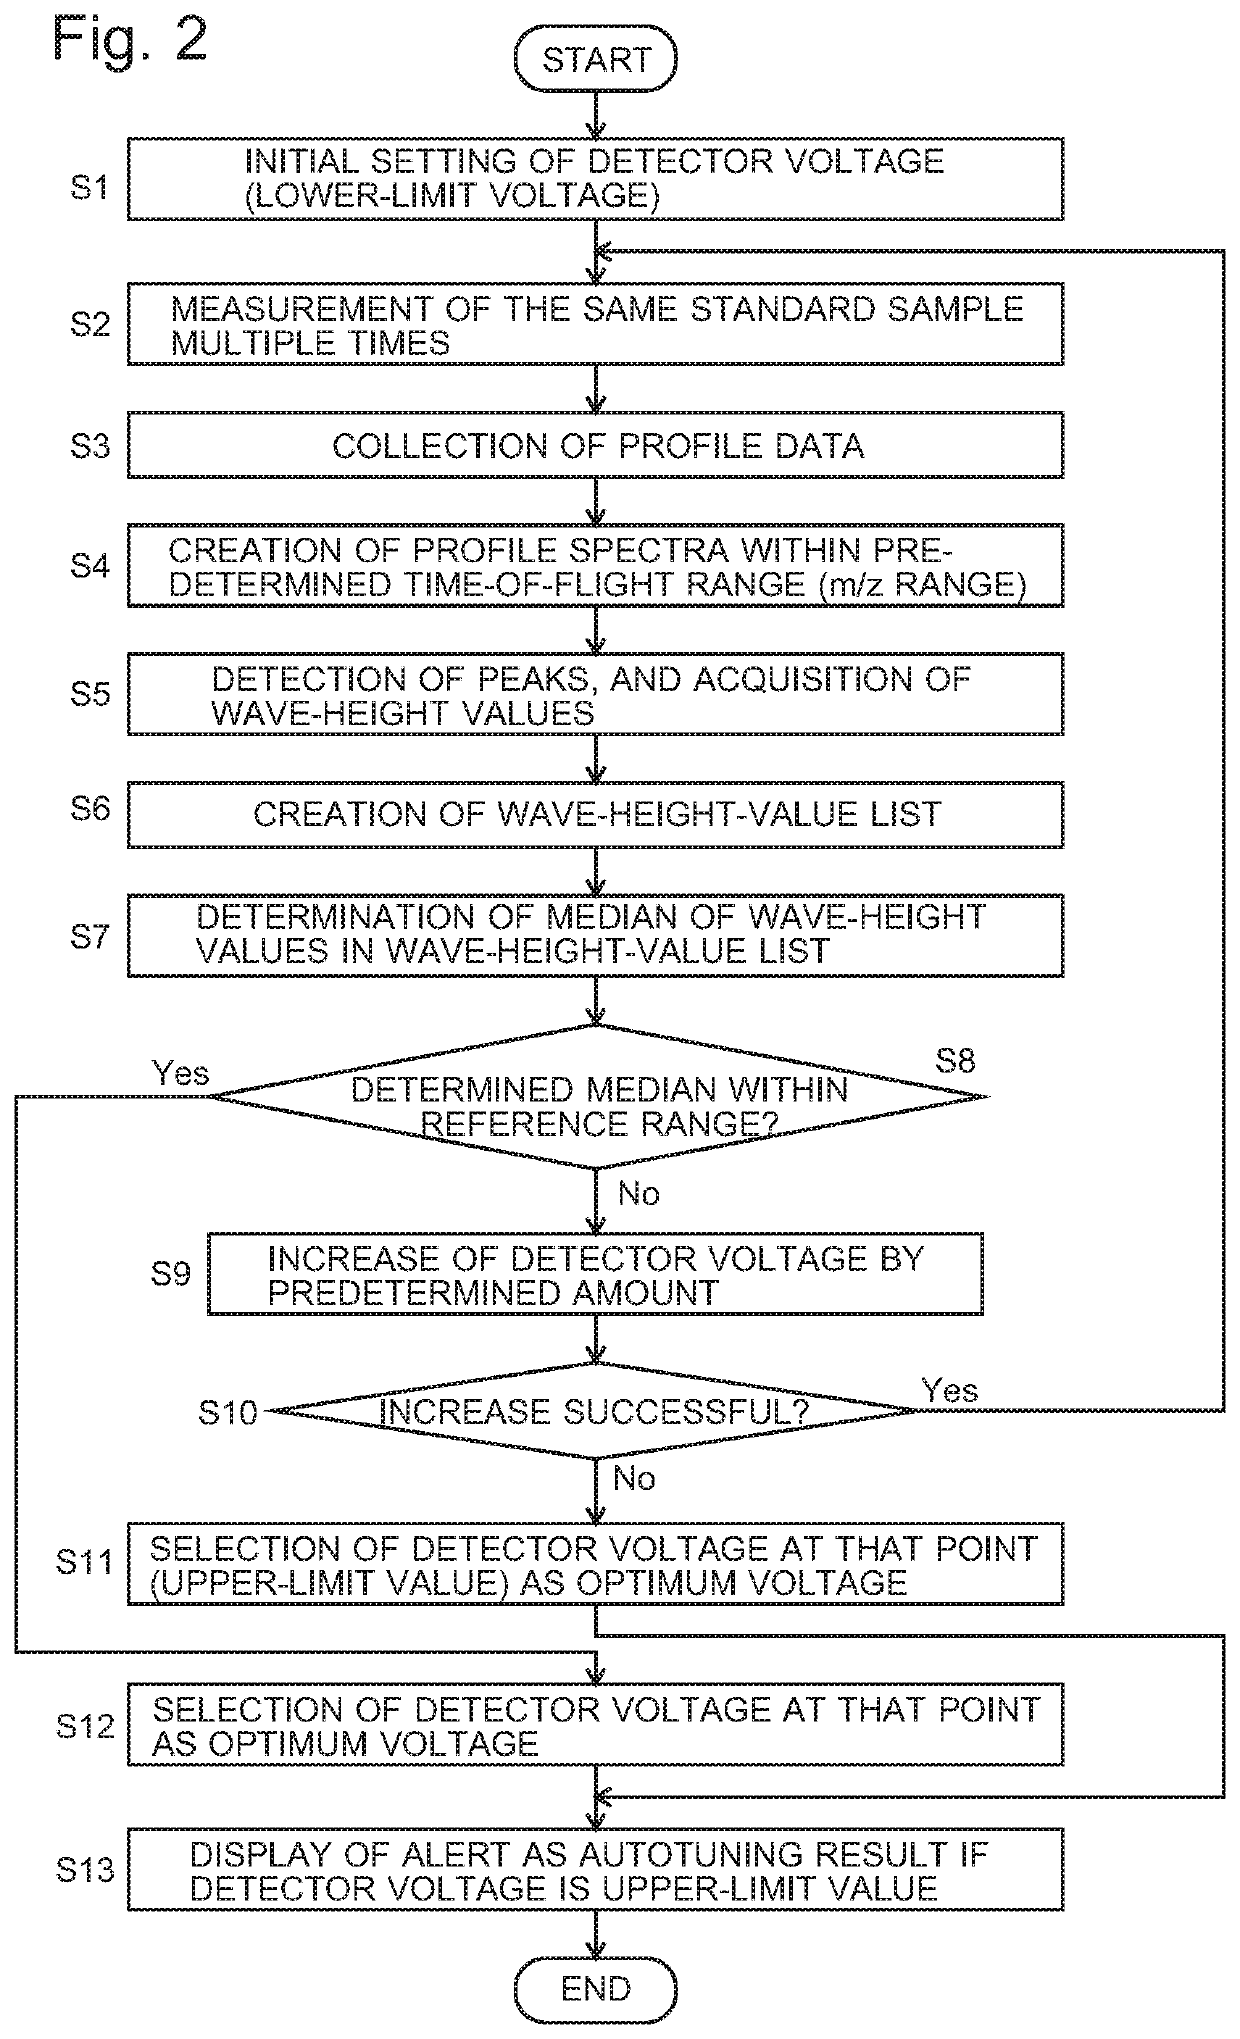
For an automatic adjustment of a detector voltage, a measurement of a standard sample is performed, in which a reflection voltage generator under the control of an autotuning controller applies, to a reflector, voltages which are different from those applied in a normal measurement and do not cause temporal conversion of ions. Ions having the same m / z simultaneously ejected from an ejector are dispersed in the temporal direction and reach a detector. Therefore, a plurality of low peaks corresponding to individual ions are observed on a profile spectrum. A peak-value data acquirer determines a wave-height value of each peak. A wave-height-value list creator creates a list of wave-height values. A detector voltage determiner searches for a detector voltage at which the median of the wave-height values in the wave-height-value list falls within a reference range.

Description

TECHNICAL FIELD[0001]The present invention relates to a time-of-flight mass spectrometer (which may be hereinafter called the “TOFMS”), and more specifically, to a TOFMS in which a DC-type detector configured to measure an average value or integrated value of an ion current is used as the detector.BACKGROUND ART[0002]In general, in a mass spectrometer, components in a sample are ionized in an ion source, and the generated ions are introduced into a mass separator, in which the ions are separated from each other according to their mass-to-charge ratios m / z, to be eventually detected with a detector. Commonly known detectors used in mass spectrometers can be roughly divided into a DC-type detector configured to measure an average value or integrated value of an ion current which flows due to the ions which have reached the detector, and a pulse-counting detector configured to count pulse signals which represent individual ions arriving at the detector (for example, see Patent Literatu...

Claims


Application Information

Patent Timeline
IPC IPC(8): H01J49/40H01J49/06
CPCH01J49/40H01J49/06H01J49/0027H01J49/025H01J49/446
Inventor OSHIRO, TOMOYUKIOKUMURA, DAISUKEMIYAZAKI, YUTAKOZAWA, HIROAKI
Owner SHIMADZU CORP
Learn More