Entropy field decomposition for image analysis

a technology of image analysis and entropy field, applied in the field of image analysis, can solve the problems of significant challenge, severely limit the utility of the method, and the reconstruction of brain networks from these signal fluctuations, and achieve the effect of designing plant phenotypes

Active Publication Date: 2018-10-04
RGT UNIV OF CALIFORNIA
View PDF0 Cites 2 Cited by
  • Summary
  • Abstract
  • Description
  • Claims
  • Application Information

AI Technical Summary

Benefits of technology

This patent describes two methods for analyzing radar data to detect severe weather events, specifically tornados. The first method measures various parameters, such as maximum reflectivity and tilt, to quantitatively measure changes in those factors that are important in tornado generation. This helps researchers better understand how tornados develop. The second method uses magnetic resonance imaging to non-invasively measure root structure, including depth and maximum angular extent. This allows for the analysis of plant phenotyping, which can help create drought-tolerant plants that can provide food security on a global scale. Overall, these methods provide a means for accurate and reliable detection of severe weather and plant phenotyping.

Problems solved by technology

The multiple time-resolved volumes of data acquired in these methods are from exceedingly complex and non-linear systems: the human brain and severe thunder storms.
The data consist of large volumes of densely sampled, relatively low signal-to-noise, voxels acquired at many time points, presenting a significant challenge due to the multitude of spatial and temporal scales and potential combinations of interactions.
However, the reconstruction of brain networks from these signal fluctuations poses a significant challenge because they are generally non-linear, non-Gaussian, and can overlap in both their spatial and temporal extent.
Thus, these rs-fMRI data present a unique and significant analysis challenge that has yet to be adequately solved, and thus severely limits the utility of the method.
Resting state fMRI data, on the other hand, has no such input, and thus there is a fundamental problem of defining the question to be asked of the data.
A variety of techniques have been devised to address this problem, however, the predominant approaches are based on the presupposition of the statistical properties of complex brain signal parameters, which are unprovable but facilitate the analysis.
These are just a few examples of the many physical systems of interest to scientists that are highly non-linear and non-Gaussian, and in which detecting, characterizing, and quantitating the observed patterns and relating them to the system dynamics poses a significant data analysis challenge.

Method used


Image

  • Entropy field decomposition for image analysis
  • Entropy field decomposition for image analysis
  • Entropy field decomposition for image analysis

Examples


example 1

2D Data

[0086]In “traditional” FMRI, a subject is presented with a well-defined input stimulus, such as a visual stimulation consisting of a rapidly flashing (e.g., 8 Hz) checkerboard that is presented for a short period (e.g., 10 sec), turned off for the same period, and this pattern of presentation is repeated several times, resulting in a so-called “block stimulus design.” This is an example of task-based FMRI, so-called because the input task (the stimulus) is known. While the relationship between the input stimulus and the FMRI signal is actually quite complicated, it is often quite close to the stimulus. Thus, simple correlation of the input stimulus (perhaps convolved with a neuronal response function) with the signal is a useful and established analysis method, as long as the signals are not spatially or temporally overlapping. If they are, traditional correlation analysis methods fail and most sophisticated techniques such as ICA have been employed, though are known to be in...

example 2

3D Non-Periodic, Overlapping Data

[0090]The second toy example is an idealization of the more practical situation faced in many scientific applications, including our own particular cases of FMRI and mobile Doppler radar data and consists of mixing different time varying signals inside several three-dimensional spatial domains. This is a model for the second “flavor” of FMRI is the acquisition data while the subject is not presented with any stimulus and is simply “resting”. This is called “resting state FMRI”, or rsFMRI, and the analysis of the detected spatio-temporal fluctuations presents a tremendous challenge because they are characterized by being non-linear, non-periodic, and spatially and temporally overlapping, and there is no known input stimulus with which to compare these fluctuations as they are thought to be due to “intrinsic” modes of brain activity. This example is also a reasonable idealized model for the problem faced in mobile Doppler radar data from severe thunder...

example 3

tate FMRI Data

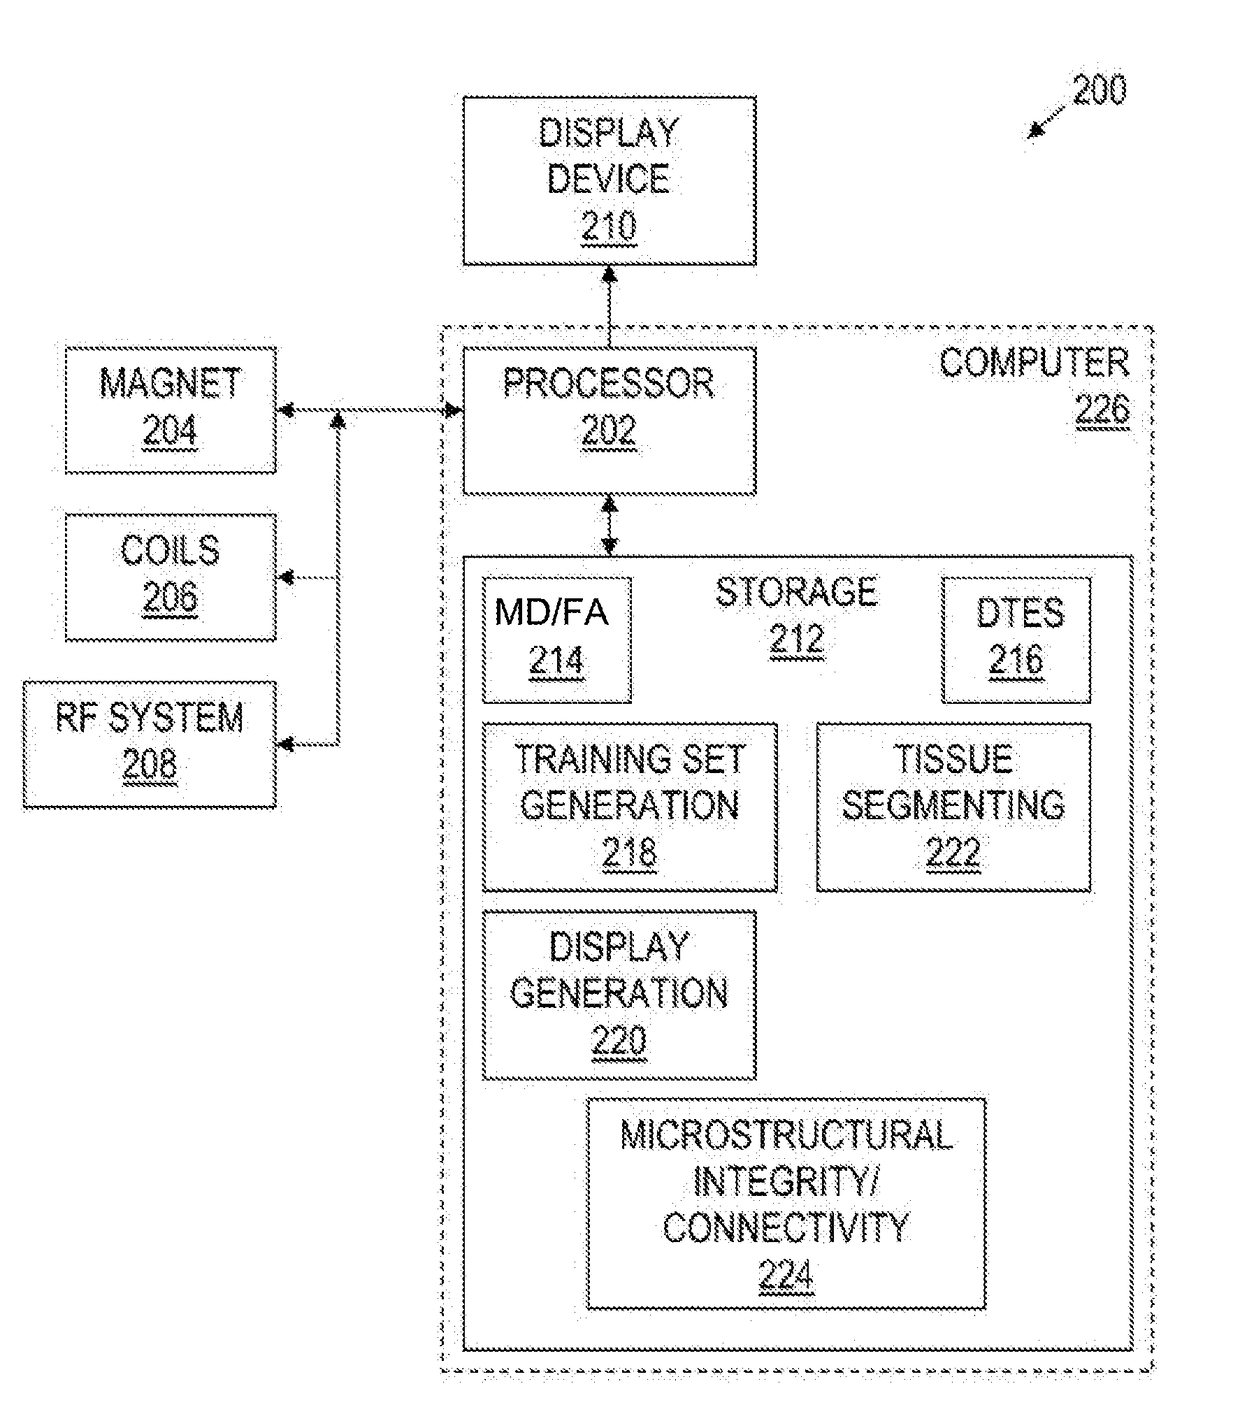
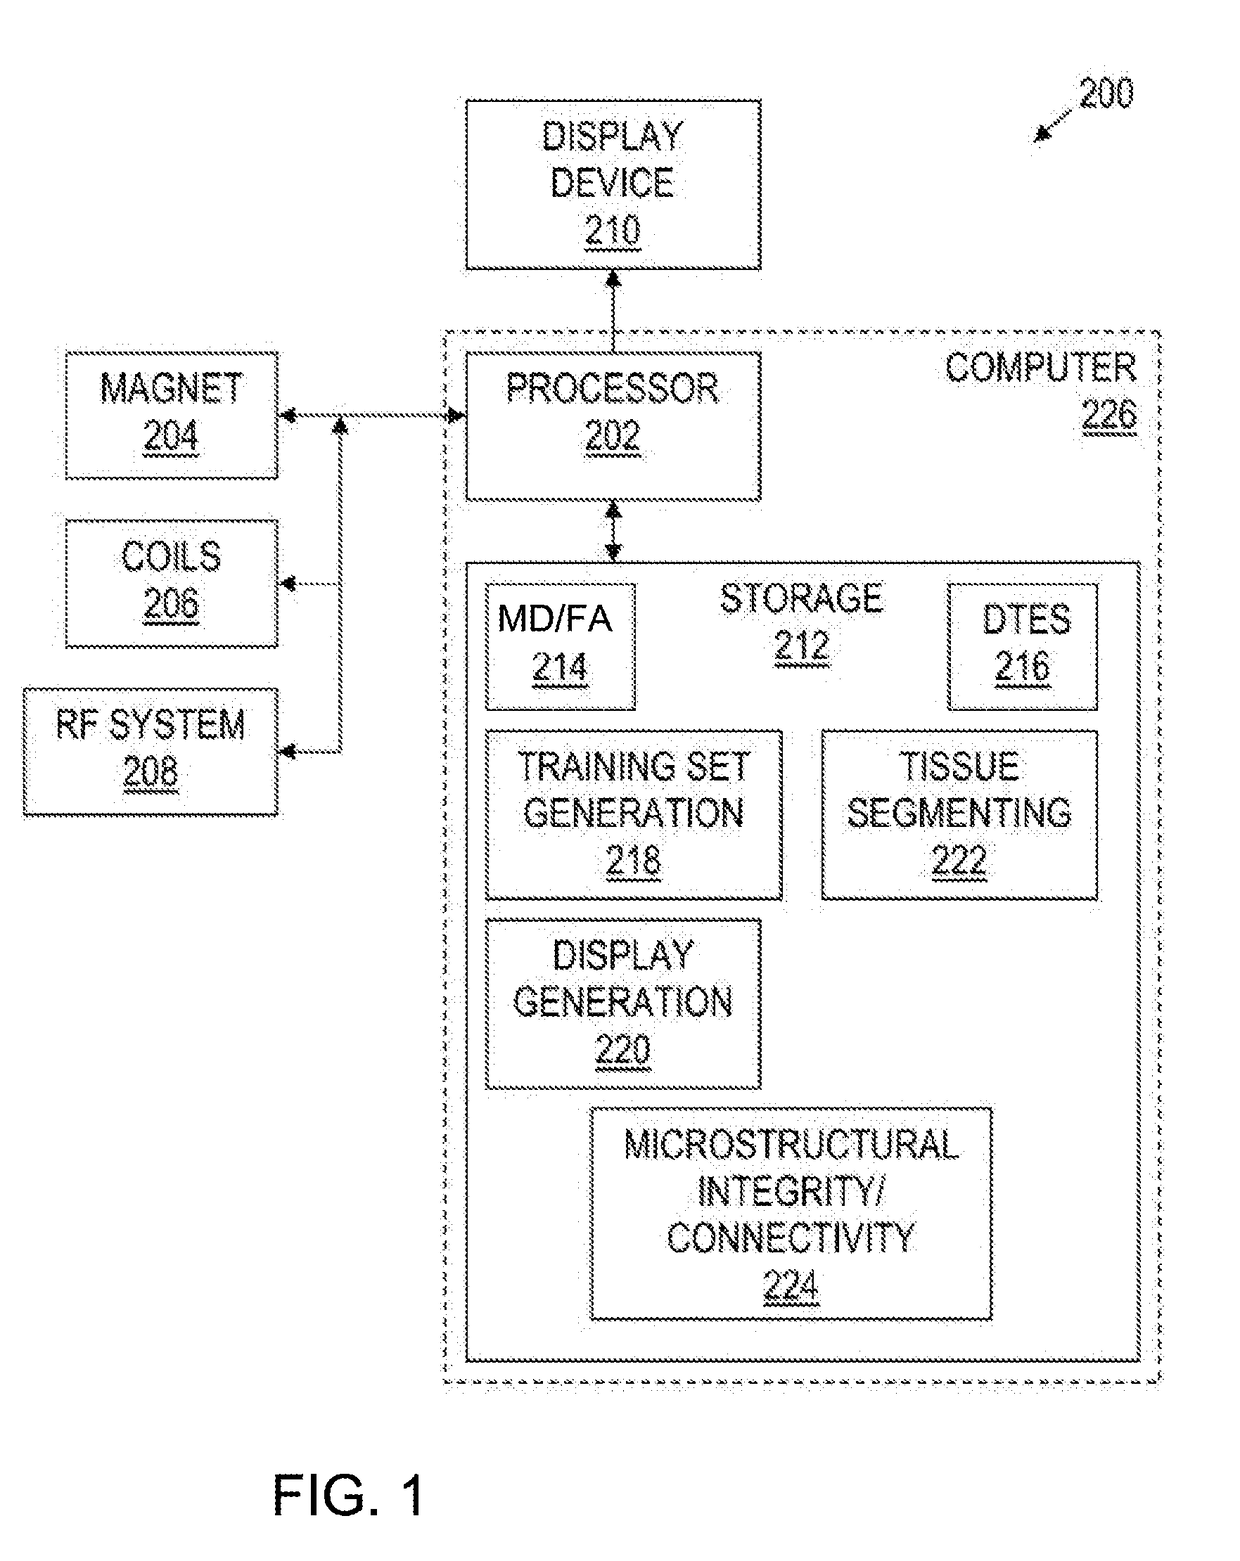
[0095]FIG. 1 provides a block diagram of an exemplary magnetic resonance (MR) imaging system 200 in accordance with various embodiments. The system 200 includes a main magnet 204 to polarize the sample / subject / patient; shim coils 206 for correcting inhomogeneities in the main magnetic field; gradient coils 206 to localize the MR signal; a radio frequency (RF) system 208 which excites the sample / subject / patient and detects the resulting MR signal; and one or more computers 226 to control the aforementioned system components.

[0096]A computer 226 of the imaging system 200 comprises a processor 202 and storage 212. Suitable processors include, for example, general-purpose processors, digital signal processors, and microcontrollers. Processor architectures generally include execution units (e.g., fixed point, floating point, integer, etc.), storage (e.g., registers, memory, etc.), instruction decoding, peripherals (e.g., interrupt controllers, timers, direct memory access c...


PUM


Abstract

A system and method for analysis of complex spatio-temporal data utilize complimentary general approaches to data analysis: information field theory (IFT), which reformulates Bayesian theory in terms of field theory in order to incorporate the important and often overlooked conditions that ensure continuity of underlying parameter spaces that are to be estimated from discrete data, and entropy spectrum pathways (ESP), which uses the principle of maximum entropy to incorporate prior information on the structure of the underlying space in order to estimate measures of connectivity.

Description

RELATED APPLICATIONS[0001]This application claims the benefit of U.S. Provisional Application No. 62 / 155,404, filed Apr. 30, 2015, which is incorporated herein by reference in its entirety.GOVERNMENT RIGHTS[0002]This invention was made with government support under Grant R01MH096100 awarded by the National Institutes of Health and Grant DBI-1147260 awarded by the National Science Foundation. The government has certain rights in the invention.FIELD OF THE INVENTION[0003]The invention relates to a method for analyzing images comprising spatio-temporal data and more specifically to a method for analysis of data generated using imaging techniques to detect and predict patterns within complex physical systems.BACKGROUND[0004]Humans obtain the vast majority of sensory input through their visual system. Significant effort has been made to artificially enhance this sense. The limitations of the human visual system have been greatly expanded through the development of novel instrumentation c...

Claims


Application Information

Patent Timeline
Patent Type & Authority Applications(United States)
IPC IPC(8): G06K9/62
CPCG06K9/6214G06K9/6271G06T7/0016G06T2207/10088G06T2207/30016G06T2207/10081G06T2207/20048A61B5/00A61B5/055G01R33/4806G01R33/5608G01R33/56341G06T7/0012G06T2207/10044G06V10/7715G06F2218/12G06F18/2135G06F18/24133
Inventor FRANK, LAWRENCE R.GALINSKY, VITALY L.
Owner RGT UNIV OF CALIFORNIA
Why Eureka
Try Eureka