
System-analyzing device, analysis-model generation method, system analysis method, and system-analyzing program

a system analysis and program technology, applied in the field of system analysis devices, analysismodel generation methods, system analysis methods, and system analysis programs, can solve problems such as system and peripheral damage, system abnormalities, and inability to detect abnormalities, and achieve high accuracy

Inactive Publication Date: 2017-04-13
NEC CORP
View PDF2 Cites 8 Cited by
  • Summary
  • Abstract
  • Description
  • Claims
  • Application Information

AI Technical Summary

Benefits of technology

The present invention allows for precise analysis of complex target systems that may have multiple data items with different characteristics. This can help to identify and address issues in the target system more effectively.

Problems solved by technology

The first method has a problem of such false detection that that the change of the state of a system caused by an internal or external factor such as temperature, a load on the system, or a set value is an abnormality in the system.
Further, the first method has a problem that when a threshold value is loosely set in order to avoid such false detection, it is impossible to detect an abnormality in a system to be primarily detected, such as a failure of a facility or an operation mistake, and a possibility arises that the system and the peripheral thereof are seriously damaged.
The multicollinearity is a phenomenon in which an incomputability problem or poor accuracy is caused when explanatory variables contain a plurality of data items linked to each other in regression analysis.

Method used


Image

  • System-analyzing device, analysis-model generation method, system analysis method, and system-analyzing program
  • System-analyzing device, analysis-model generation method, system analysis method, and system-analyzing program
  • System-analyzing device, analysis-model generation method, system analysis method, and system-analyzing program

Examples


exemplary embodiment 1

[0050]Exemplary embodiments of the present invention will be described below with reference to the drawings. Each exemplary embodiment will be described below by taking, as an example, the case of applying a system-analyzing device of the present invention to detection of an abnormality of a power plant system.

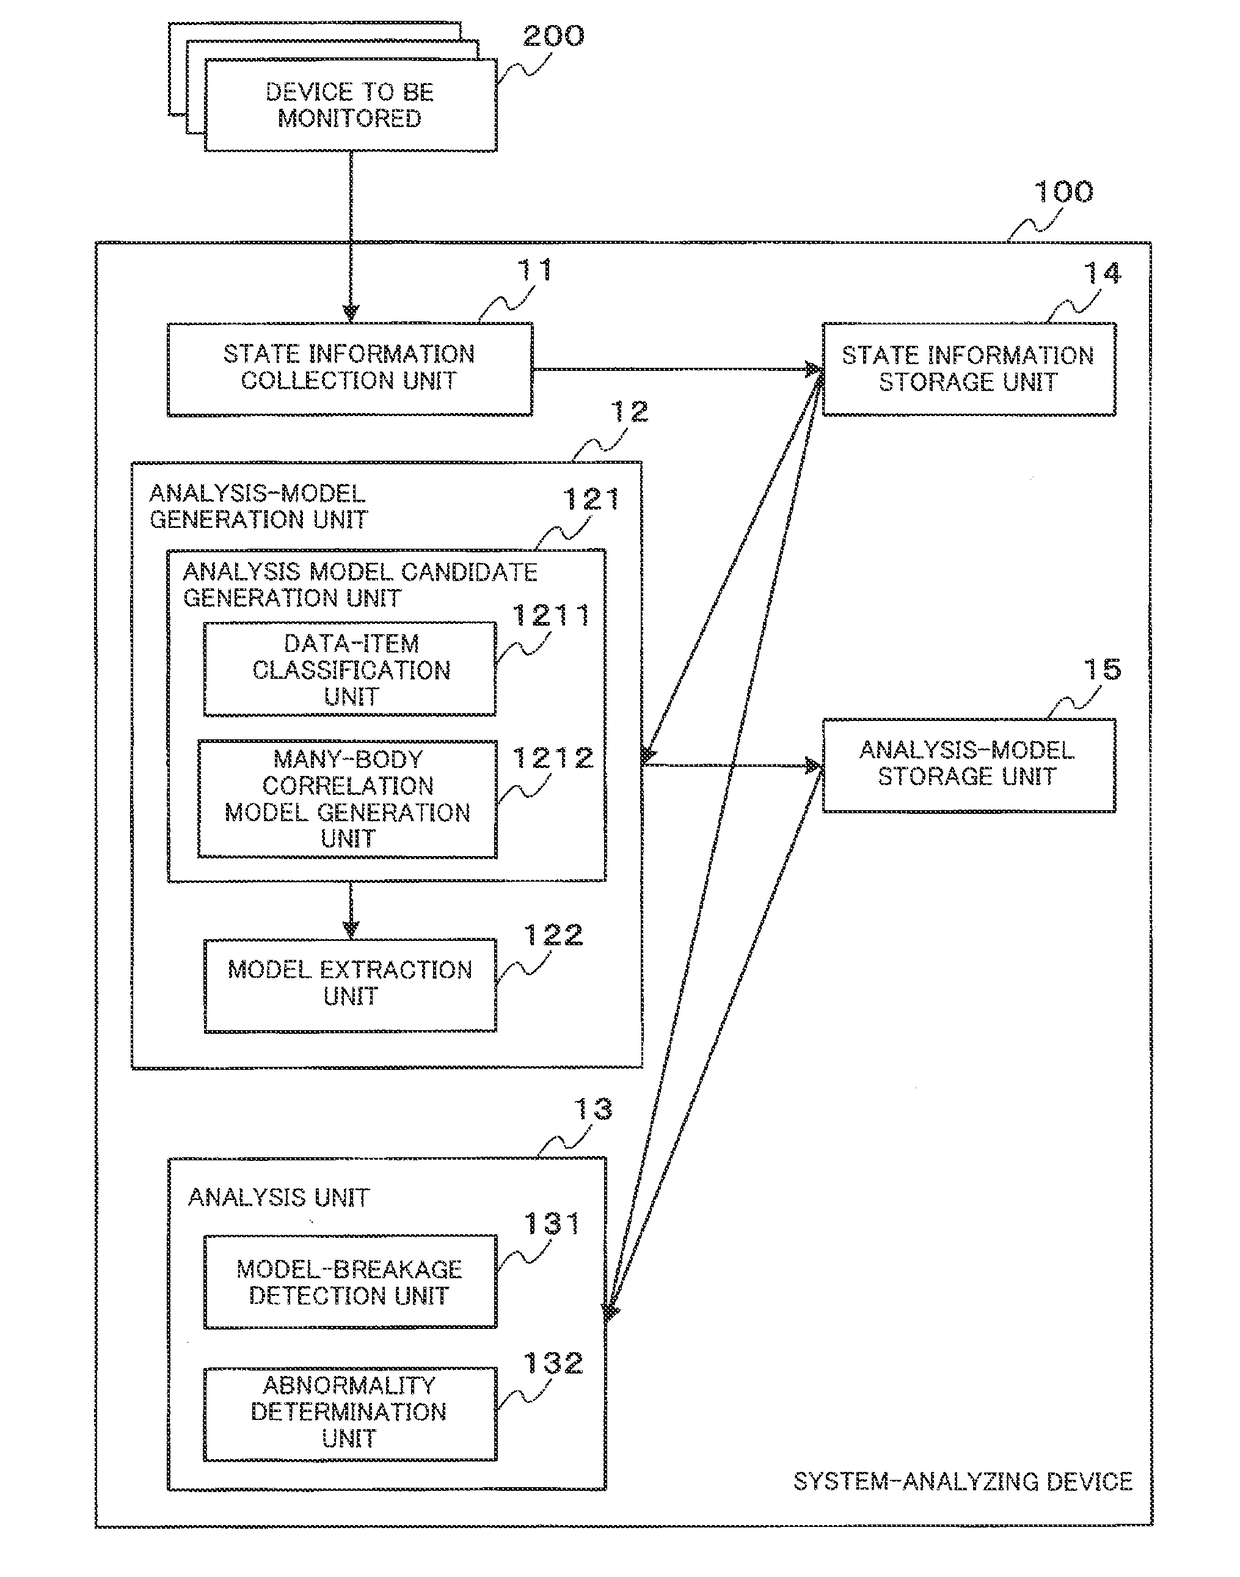
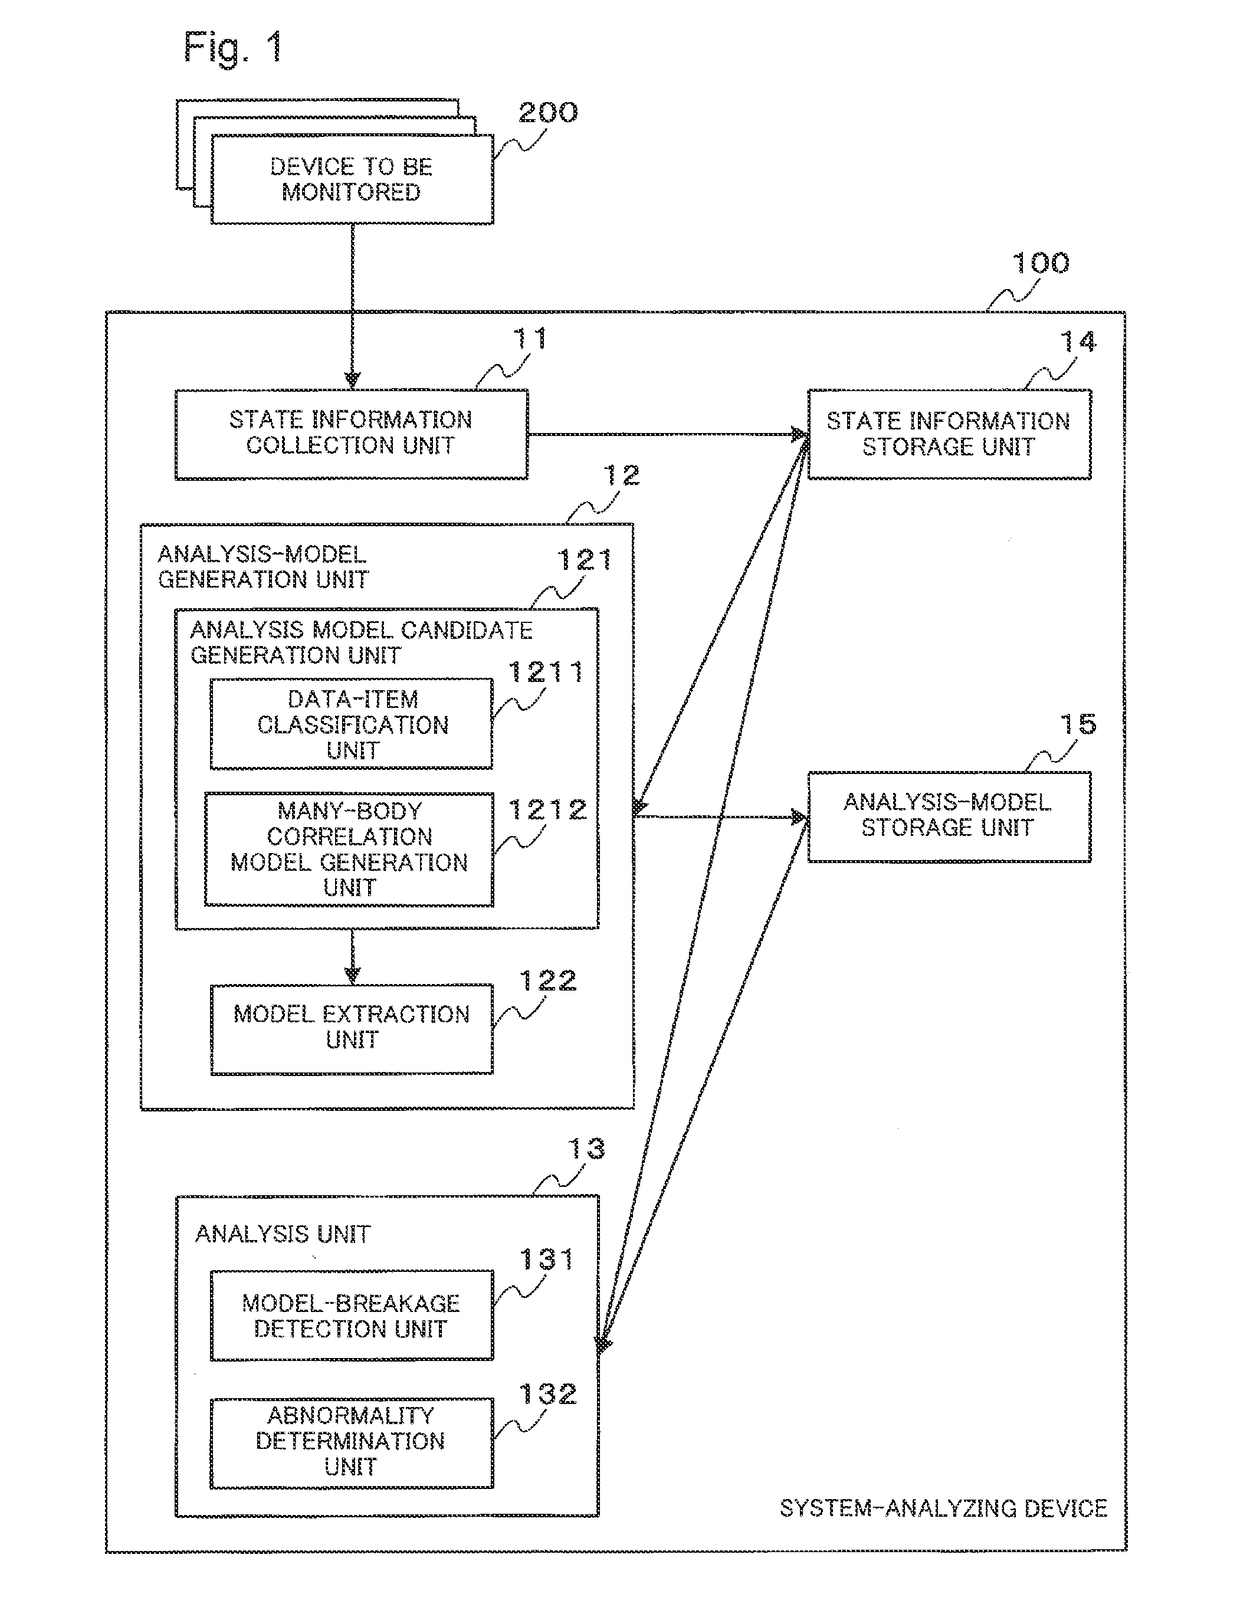
[0051]FIG. 1 is a block diagram illustrating a configuration example of a system-analyzing device 100 of a first exemplary embodiment. As illustrated in FIG. 1, the system-analyzing device 100 of this exemplary embodiment is connected to a system to be monitored, including at least one device 200 to be monitored. The device 200 to be monitored is an apparatus or a subsystem as a component included in the power plant system, and is, for example, a turbine, a feed water heater, or a condenser. The device 200 to be monitored also includes an element, such as piping or a signal line, which connects devices. In this exemplary embodiment, it is assumed that the system to be monitore...

exemplary embodiment 2

[0160]Next, a second exemplary embodiment of the present invention will be described. This exemplary embodiment is the same as the first exemplary embodiment except a method for choosing a representative data item. Therefore, the same portions as those in the first exemplary embodiment are denoted by the same reference signs, and the descriptions thereof are omitted.

[0161]In this exemplary embodiment, a data item of which the value earliest changes on a time-series basis in each data item group, i.e., a data item in which a change point appears earliest is chosen as a representative data item. When a plurality of representative data items are chosen, the representative data items may be chosen in descending order of the earliness of the appearance of the change point of information.

[0162]First, a many-body correlation model generation unit 1212 of this exemplary embodiment randomly selects one of data items contained in a data item group classified by a data-item classification unit...

exemplary embodiment 3

[0167]Next, a third exemplary embodiment of the present invention will be described. This exemplary embodiment is different from each of the exemplary embodiments described above in that not only a many-body correlation model but also a cross-correlation model is used as a correlation model for an analysis model. The following description is presented by taking, as an example, a case in which the function of using the cross-correlation model as the analysis model is added to the configuration of the first exemplary embodiment. However, the function may be added to the second exemplary embodiment. In the following description, the same portions as those in the first exemplary embodiment are denoted by the same reference signs, and the descriptions thereof are omitted.

[0168]FIG. 11 is a block diagram illustrating a configuration example of a system-analyzing device 300 of this exemplary embodiment. The system-analyzing device 300 illustrated in FIG. 11 is different in comparison with ...


PUM


Abstract

This system-analyzing device has an analysis-model generation unit, and said analysis-model generation unit includes a data-point categorization unit, a many-body-correlation-model generation unit, and a model extraction unit. The data-point categorization unit categorizes a plurality of types of data points for a target system into one or more groups on the basis of how good a regression equation containing a given two of said data points is, and for each of said groups, the many-body-correlation-model generation unit selects a representative data point and generates a many-body-correlation model that includes at least the following: a regression equation containing the representative data point and one of two sets of data points from the group in question; and the allowable prediction-error range for said regression equation. The model extraction unit extracts one or more of the generated many-body-correlation models on the basis of how good each regression equation is.

Description

CROSS-REFERENCE TO RELATED APPLICATION[0001]This application is a national stage application of International Application No. PCT / JP2014 / 005336 entitled “SYSTEM-ANALYZING DEVICE, ANALYSIS-MODEL GENERATION METHOD, SYSTEM ANALYSIS METHOD, AND SYSTEM-ANALYZING PROGRAM,” filed on Oct. 21, 2014, which claims the benefit of the priority of Japanese Patent Application No. 2014-065120 filed on Mar. 27, 2014, the disclosures of each of which are hereby incorporated by reference in their entirety.TECHNICAL FIELD[0002]The present invention relates to a system-analyzing device, an analysis-model generation method, a system analysis method, and a system-analyzing program, by which the state of a system is analyzed.BACKGROUND ART[0003]For the purpose of safely and efficiently managing systems, processing for analyzing the states of the systems based on sensor values obtained from components of the systems is carried out.[0004]The systems are unities or mechanisms configured by elements influencin...

Claims


Application Information

Patent Timeline
IPC IPC(8): G06F17/50
CPCG06F17/5009G05B17/02G05B23/0221G05B23/0243G05B2219/31357Y02P90/02G06F30/20
Inventor NATSUMEDA, MASANAO
Owner NEC CORP
Learn More