Endoscope system
- Summary
- Abstract
- Description
- Claims
- Application Information
AI Technical Summary
Benefits of technology
Problems solved by technology
Method used
Image
Examples
example 1
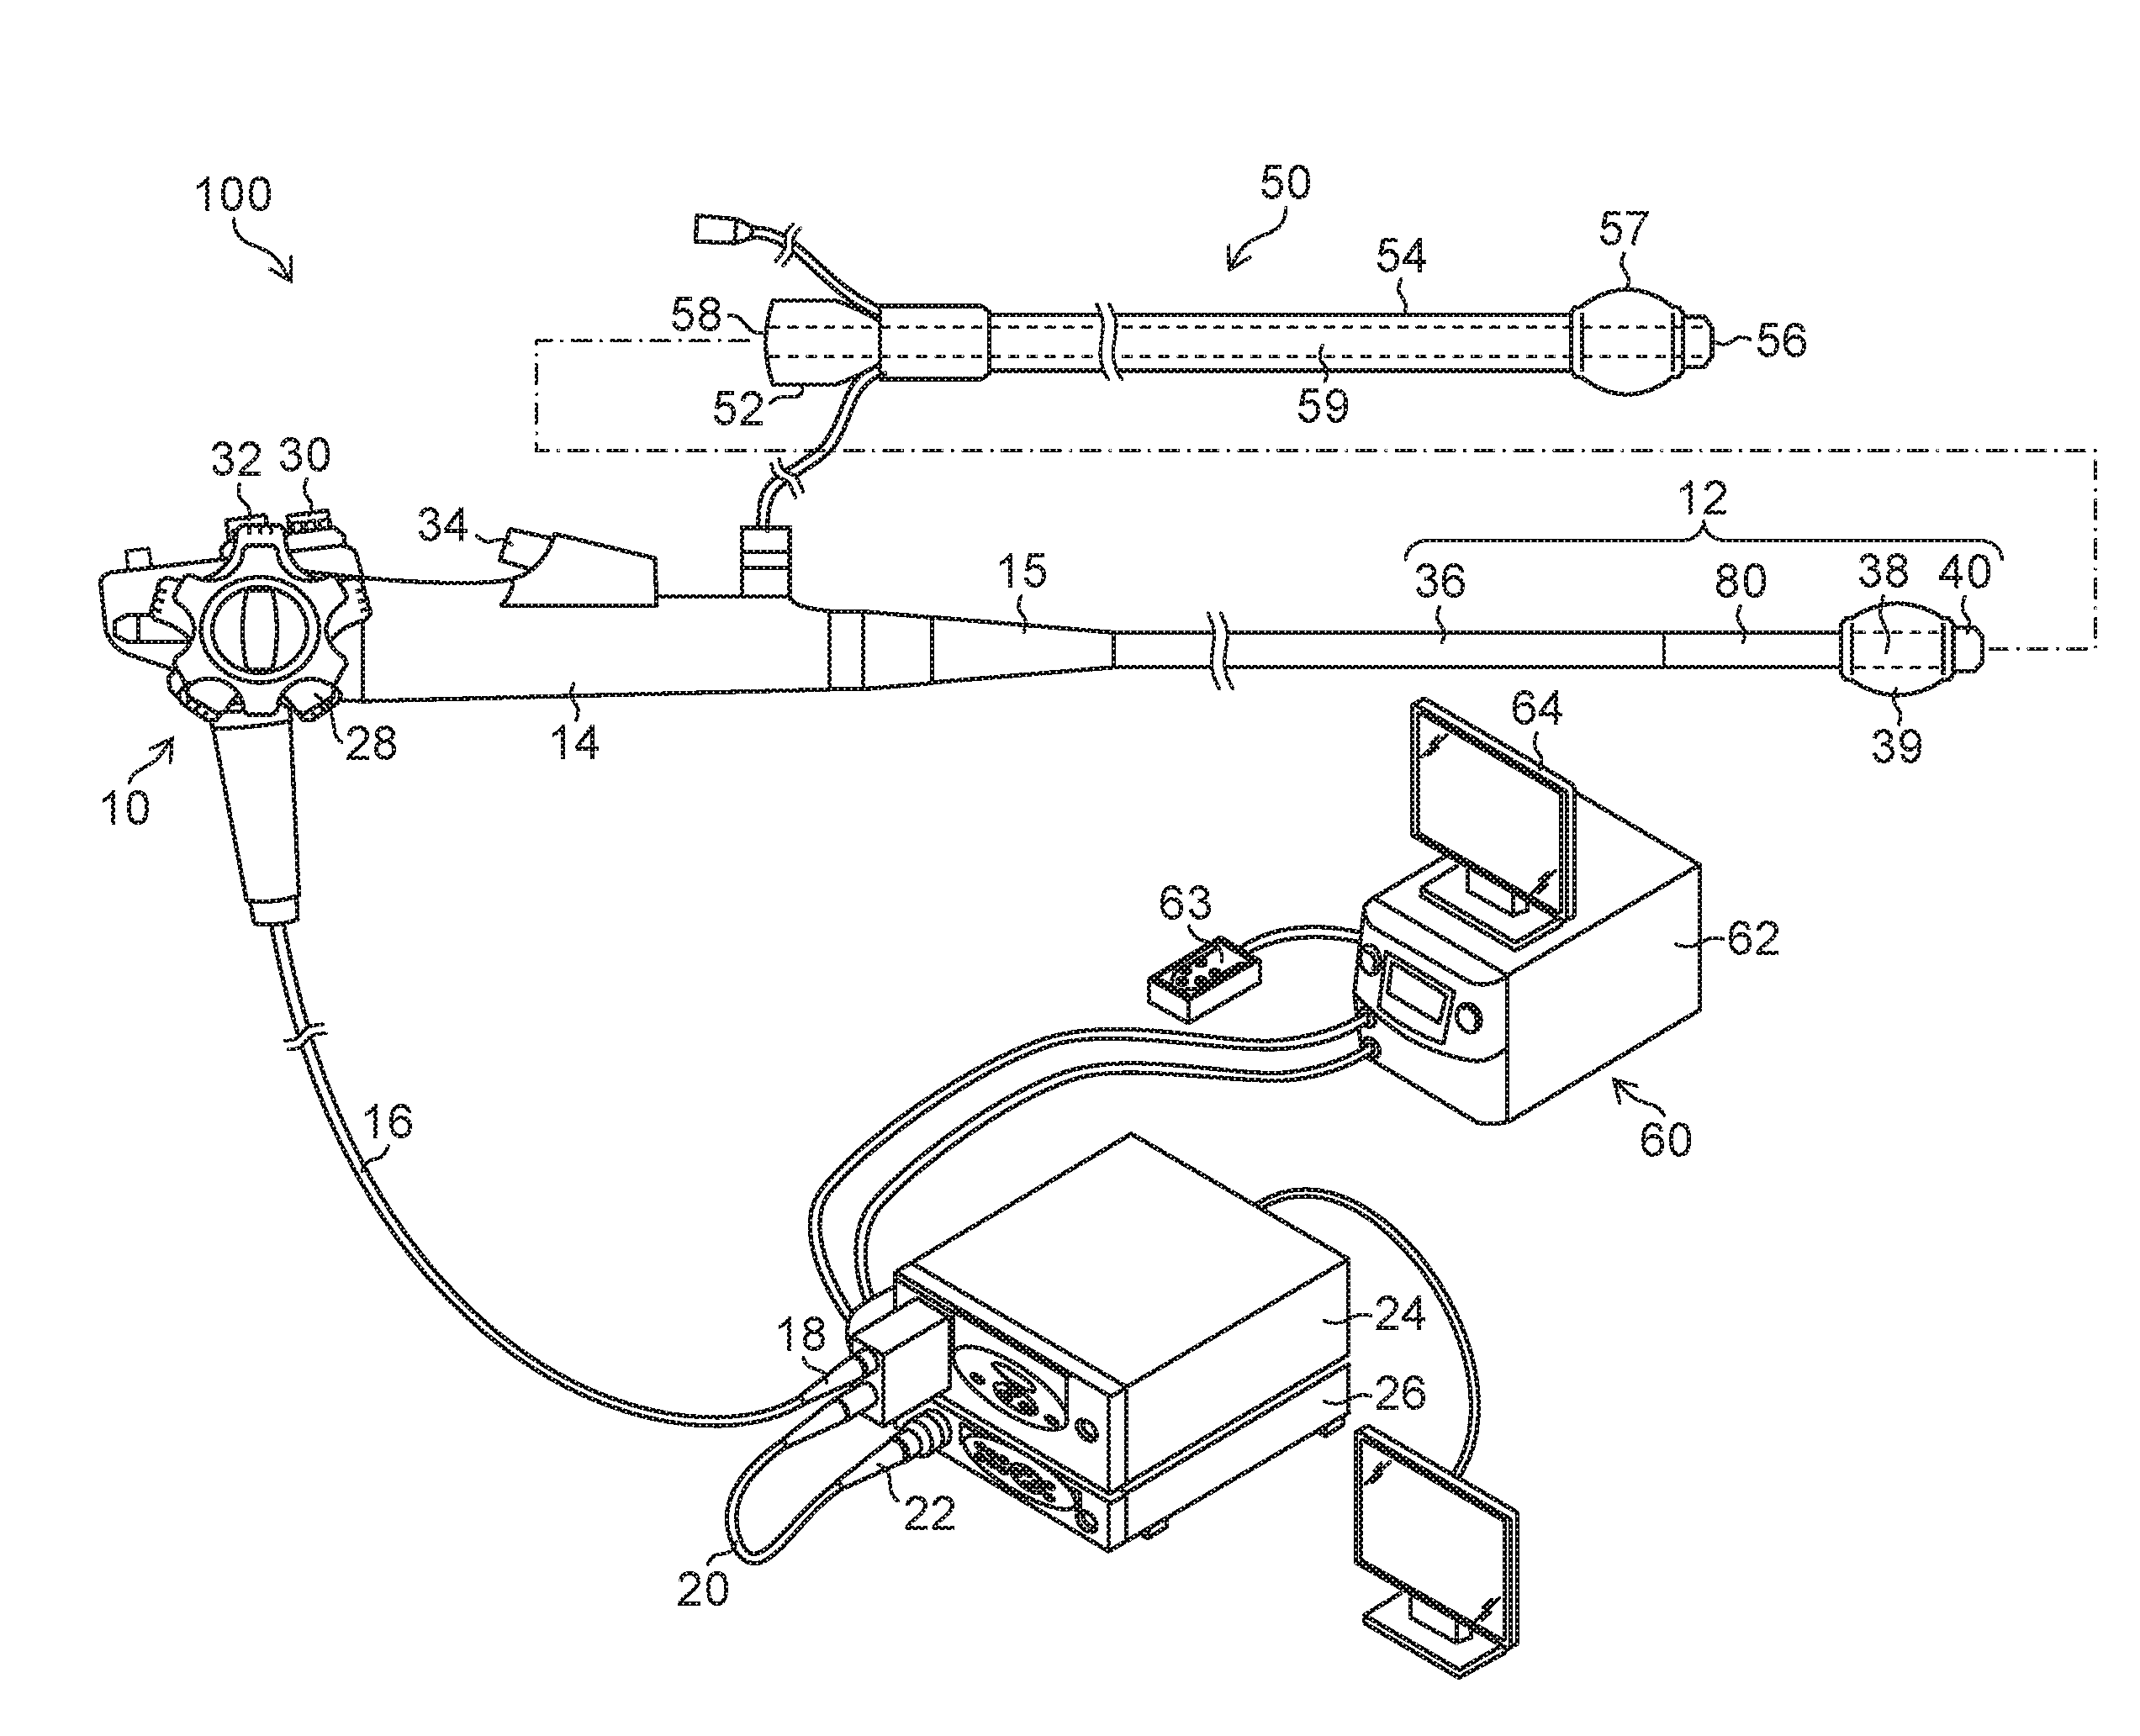
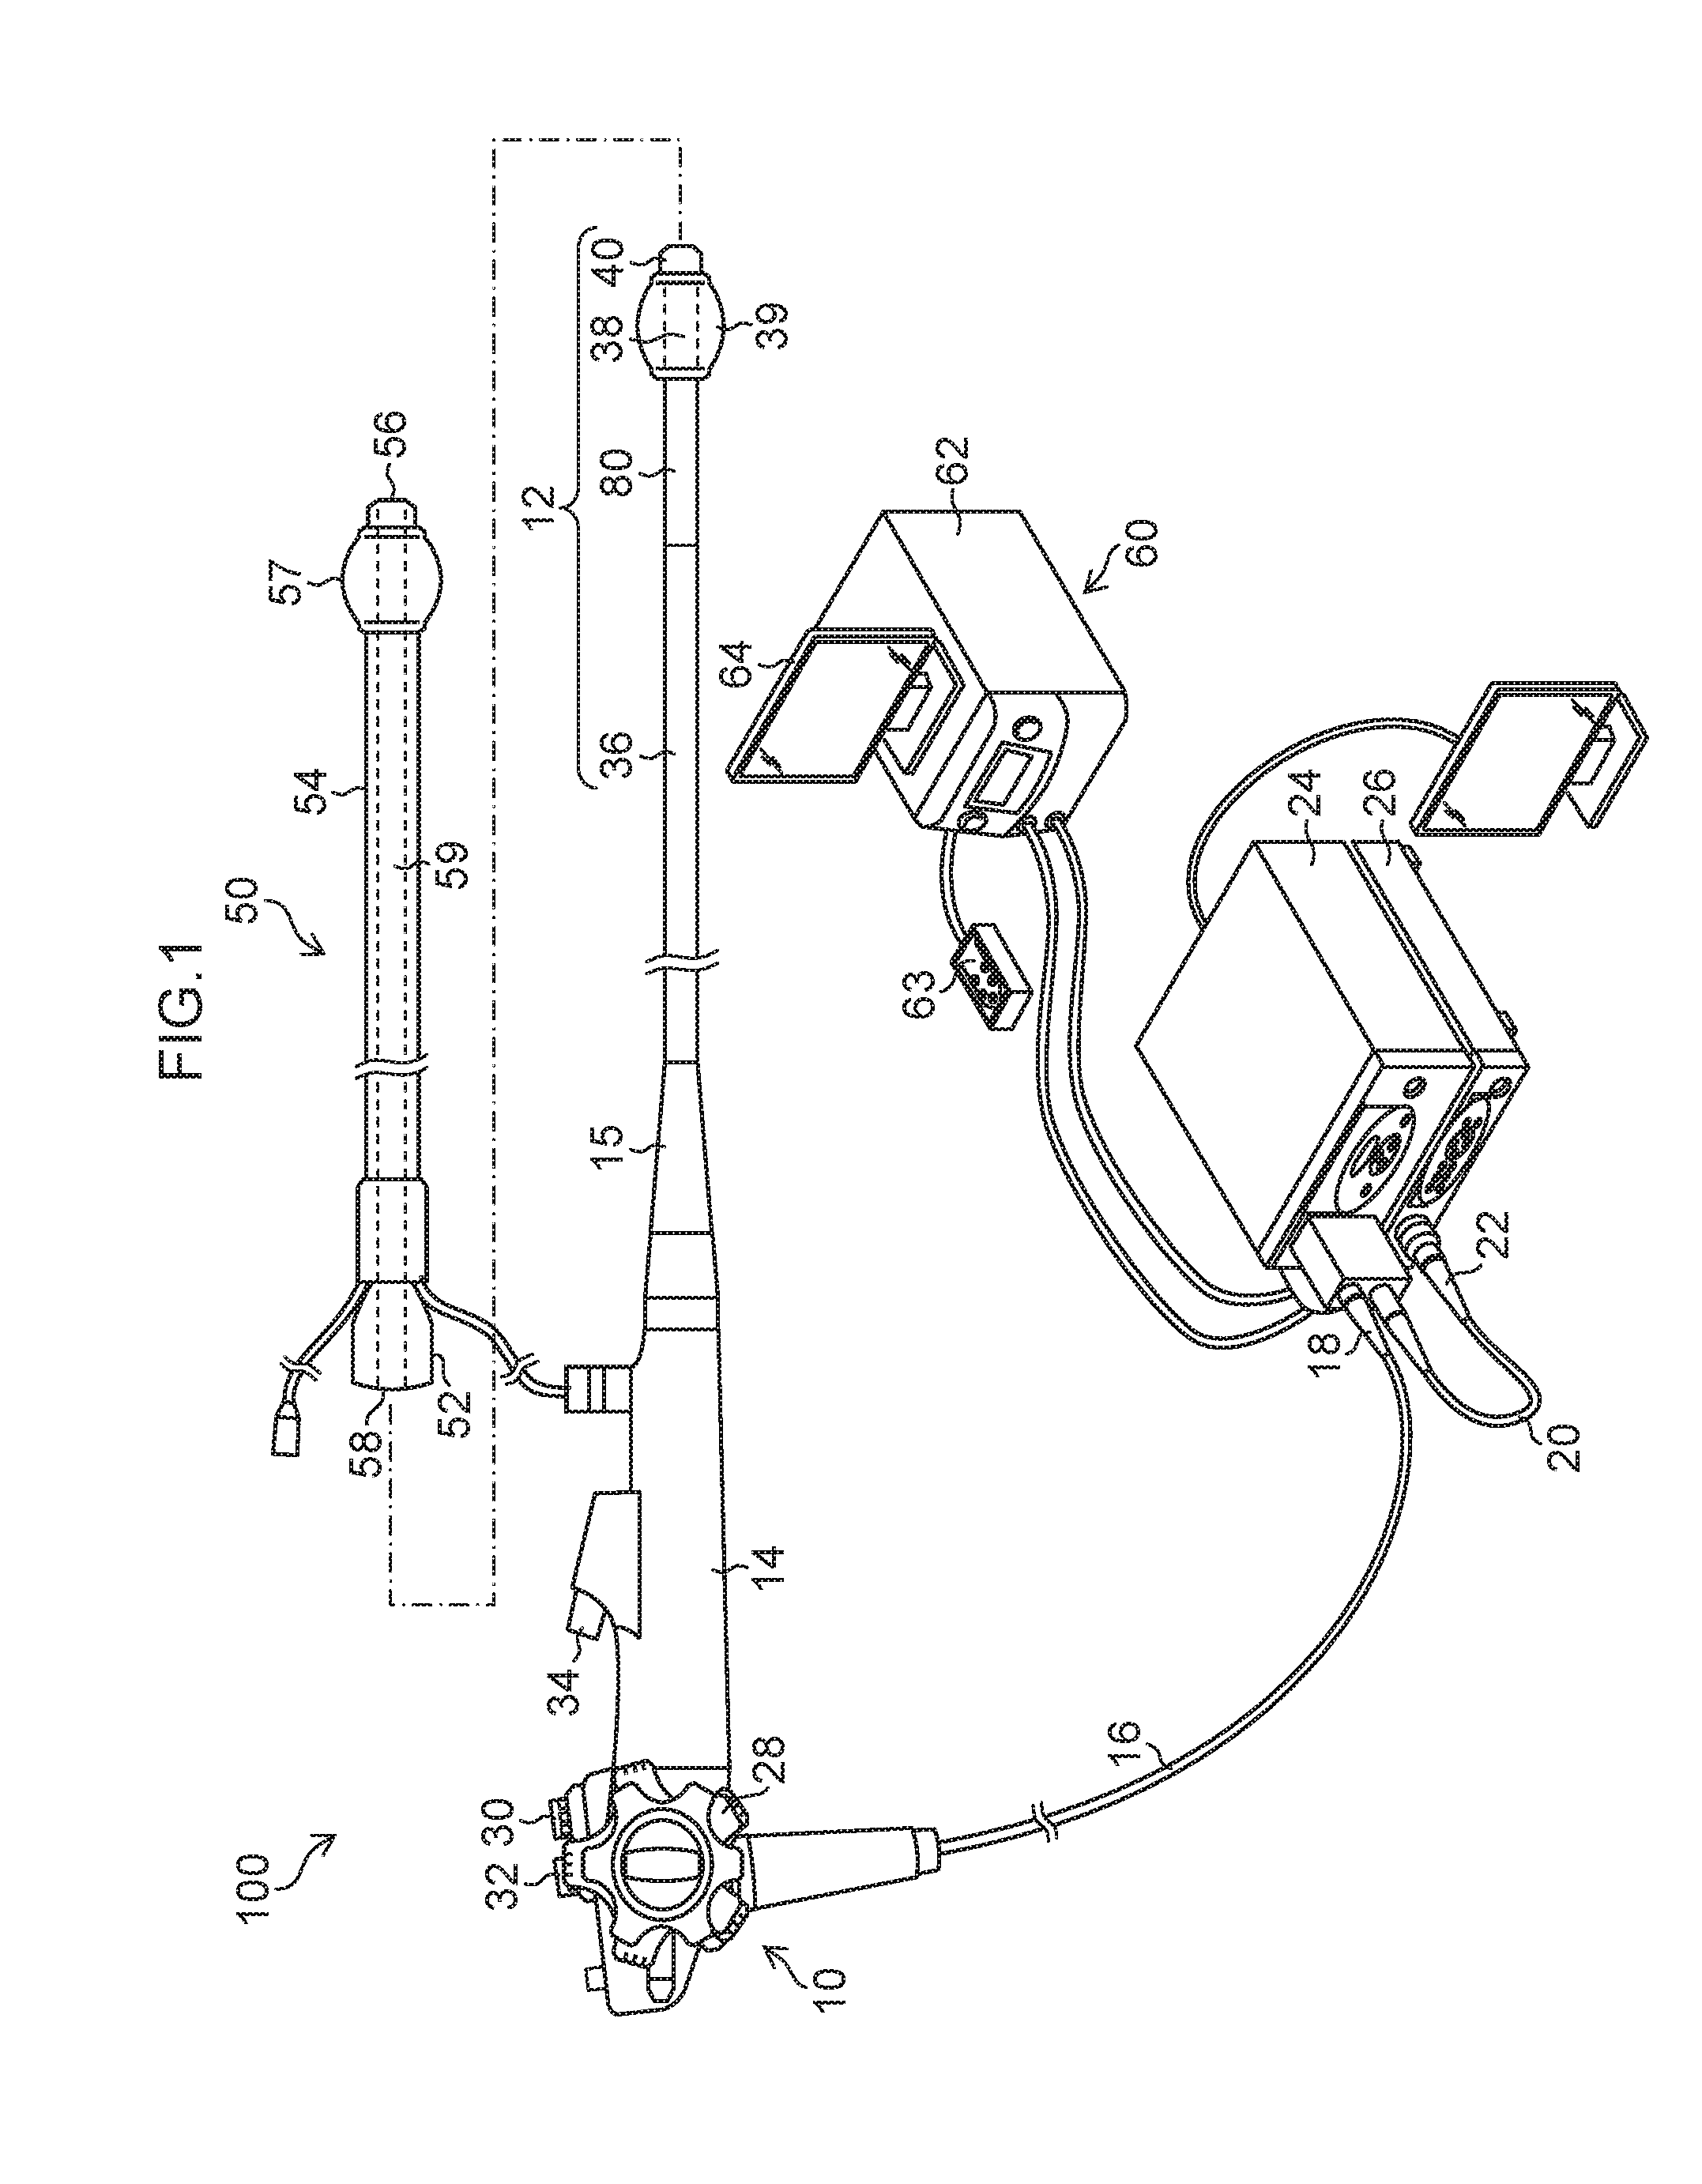
[0055]FIG. 5 is a graph illustrating the state of a bending stiffness change in Example 1. In Example 1, the bending stiffness change portion 80 is provided over the full range of the above-mentioned projection region 70 (the region of the flexible portion 36 that projects from the distal end opening 56 of the overtube 50 in a state where the insertion portion 12 is located in the distal end position in a movable range with respect to the overtube 50, that is, in a state where the insertion portion 12 is moved until the boot 15 abuts on the inner edge of the proximal end opening 58). Specifically, as illustrated in FIG. 5, a first position P1 in which the bending stiffness begins to increase is located at a position apart by 100 mm from the distal end of the insertion portion 12 (the distal end surface of the distal-end hard portion 40), a second position P2 in which the increase in the bending stiffness ends is located at a position apart by 500 mm from the distal end, and the leng...
example 2
[0059]FIG. 6 is a graph illustrating the state of a bending stiffness change in Example 2. In Example 2, the bending stiffness uniform portion 82 is provided in a range of 100 mm from the connection portion between the bending portion 38 and the flexible portion 36. In this bending stiffness uniform portion 82, the bending stiffness is constant (the bending stiffness is the least in the flexible portion 36) along the longitudinal axis direction of the flexible portion 36 (the X direction in FIG. 3). The most-proximal end-side position of the bending stiffness uniform portion 82 is a first position P1 in Example 2, the bending stiffness change portion 80 is provided in a range of 300 mm from this first position P1 to second position P2 on the proximal end side, and the bending stiffness gradually increases. The proximal end side than the second position P2 is covered with the overtube 50. Here, in a similar way to Example 1, when the bending stiffness in the first position P1 is assu...
example 3
[0061]FIG. 8 is a graph illustrating the state of a bending stiffness change in Example 3. In Example 3, the bending stiffness change portion 80 is provided on the further proximal end side than the projection region 70 in addition to the full range of the above-mentioned the projection region 70. Specifically, as illustrated in FIG. 8, a first position P1 in which bending stiffness begins to increase is located at a position apart by 100 mm from the distal end of the insertion portion 12, and an increase in the bending stiffness ends at a third position P3 (third position) (apart by 600 mm from the distal end) on the proximal end side further apart by 100 mm from a second position P2, over the second position P2 (the projection region 70 ends here) that is a position apart by 500 mm from the distal end. In a similar way to Examples 1 and 2, when the bending stiffness in the first position P1 is assumed to be 1, the bending stiffness (relative ratio) in the third position P3 is assu...
PUM
 Abstract
Description
Claims
Application Information
 - R&D
- Intellectual Property
- Life Sciences
- Materials
- Tech Scout
- Unparalleled Data Quality
- Higher Quality Content
- 60% Fewer Hallucinations
Browse by: Latest US Patents, China's latest patents, Technical Efficacy Thesaurus, Application Domain, Technology Topic, Popular Technical Reports.
© 2025 PatSnap. All rights reserved.Legal|Privacy policy|Modern Slavery Act Transparency Statement|Sitemap|About US| Contact US: help@patsnap.com


