Biomarkers of response to nae inhibitors
a technology of nae inhibitors and biomarkers, which is applied in the field of biomarkers of response to nae inhibitors, can solve the problems of many patients not being able to afford the trial and error of therapeutic regimens, and losing valuable time early in the treatment program of patients pursuing a therapy which eventually is proven ineffective for that patient, so as to eliminate ineffective or inappropriate therapy, aggressive dosing and/or administration
- Summary
- Abstract
- Description
- Claims
- Application Information
AI Technical Summary
Benefits of technology
Problems solved by technology
Method used
Image

Examples
example 1
Cell Line Panel Screens
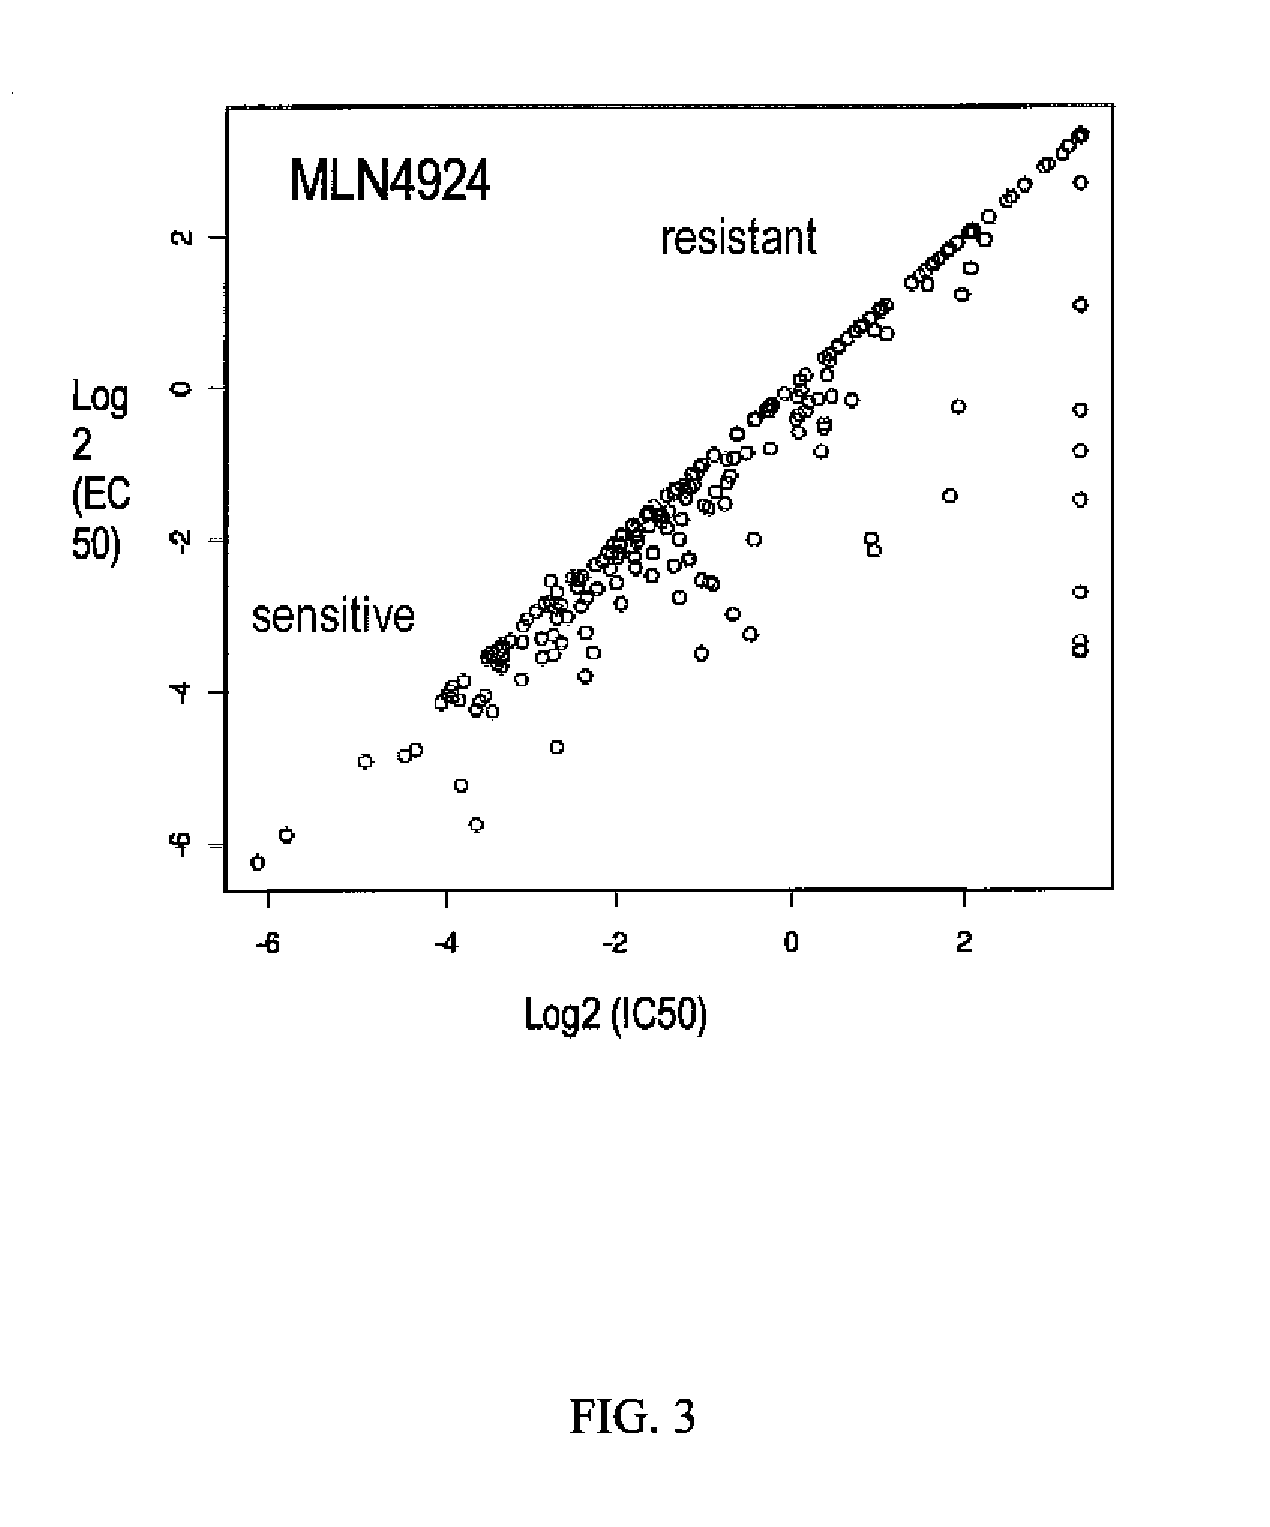
[0154]To support clinical development and identify potential biomarkers of tumor sensitivity or resistance, two large cancer cell line panels (Panel 1, N=653 (McDermott et al. (2007) PNAS 104:19936-19941); Panel 2, N=240 (O'Day et al. (2010) Fourth AACR International Conference on Molecular Diagnostics in Cancer Therapeutic Development)) were treated with MLN4924 and cell viability data (IC50, EC50, and POC—Percentage of Control) were generated.
[0155]Panel 1 (McDermott et al., supra). The cell lines were exposed to three MLN4924 concentrations (20 nM, 200 nM, and 2 μM) for 72 hours. Viability, i.e., cell number, was quantified by measuring fluorescence of a cell-permeant nucleic acid stain. Mean of triplicate values for each sample were taken and compared to DMSO control to calculate percentage of control. In the results, control or no activity value is given a value of about 1, sensitivity is indicated by a value less than 1, with 0 as death of the entire cel...
example 2
Analysis of Mutation Associations
[0159]One difficulty with correlating mutations of genes in cell lines with sensitivity to a therapeutic agent is that many cell lines have more than one mutated gene. For example, cell line named 8505C from thyroid carcinoma has mutations in BRAF, TP53, NF2 and CDKN2A. In particular, TP53 and CDKN2A mutations co-occurred with other mutations in the cell lines. To learn which mutant is associated with sensitivity or resistance in the cell line panels, sub-analyses were performed.
[0160]APC vs TP53.
[0161]In cell line panel 1, 23 cell lines have a mutation in APC. Of these, 18 cell lines also have a mutation in TP53. It was difficult to determine whether APC is a driver of resistance to MLN4924, or just a passenger mutation found frequently in TP53 mutants. Further analysis of the cell lines was undertaken by subtraction of cell lines with double mutants which included TP53 (Table 4).
TABLE 4Comparison of TP53 mutant cell lines withAPC and other mutant c...
example 3
Individual Cell Line Screening Results
[0168]The following tables include results of the individual cell line screens which led to conclusions about markers whose mutations confer sensitivity to MLN4924. Notation of the mutations and explanation of mutation syntax can be found in the COSMIC database.
TABLE 8Results of screens of cell lines with mutations in NF2.ViabilityEC50ORF mutationProtein mutationTumor TissueTumorat 2 μMPanelCo-occurringCell line(SEQ ID NO: 2)(SEQ ID NO: 3)SourcetypePanel 12Phenotypemutations647-Vc.115-1G > Cp.?urinary_tractprimary0.0380.283sensitiveMAP2K4: NF2:RB1: TP53: TP53ACHNc.169C > Tp.R57*kidneyprimary0.06210.652sensitiveCDKN2A:CDKN2a(p14): NF2CAL-62c.643G > Tp.E215*thyroidprimary0.06760.0837sensitiveCDKN2A:CDKN2a(p14):KRAS: NF2: TP53NUGC-3c.683delAp.K228fs*23stomachprimary0.098sensitiveNF2: TP53SW1573c.1_363del363p.?lungprimary0.1114sensitiveCDKN2A:CDKN2a(p14):CTNNB1: KRAS:NF2: PIK3CA: SMAD48505Cc.385G > Tp.E129*thyroidprimary0.1405sensitiveBRAF: CDKN2A: ...
PUM
| Property | Measurement | Unit |
|---|---|---|
| Mass | aaaaa | aaaaa |
| Mass | aaaaa | aaaaa |
| Mass | aaaaa | aaaaa |
Abstract
Description
Claims
Application Information
 - R&D
- Intellectual Property
- Life Sciences
- Materials
- Tech Scout
- Unparalleled Data Quality
- Higher Quality Content
- 60% Fewer Hallucinations
Browse by: Latest US Patents, China's latest patents, Technical Efficacy Thesaurus, Application Domain, Technology Topic, Popular Technical Reports.
© 2025 PatSnap. All rights reserved.Legal|Privacy policy|Modern Slavery Act Transparency Statement|Sitemap|About US| Contact US: help@patsnap.com