Method for detection of a neurological disease
- Summary
- Abstract
- Description
- Claims
- Application Information
AI Technical Summary
Benefits of technology
Problems solved by technology
Method used
Image
Examples
example 1
1. Sample Collection and Analysis
1.1 Data Sets
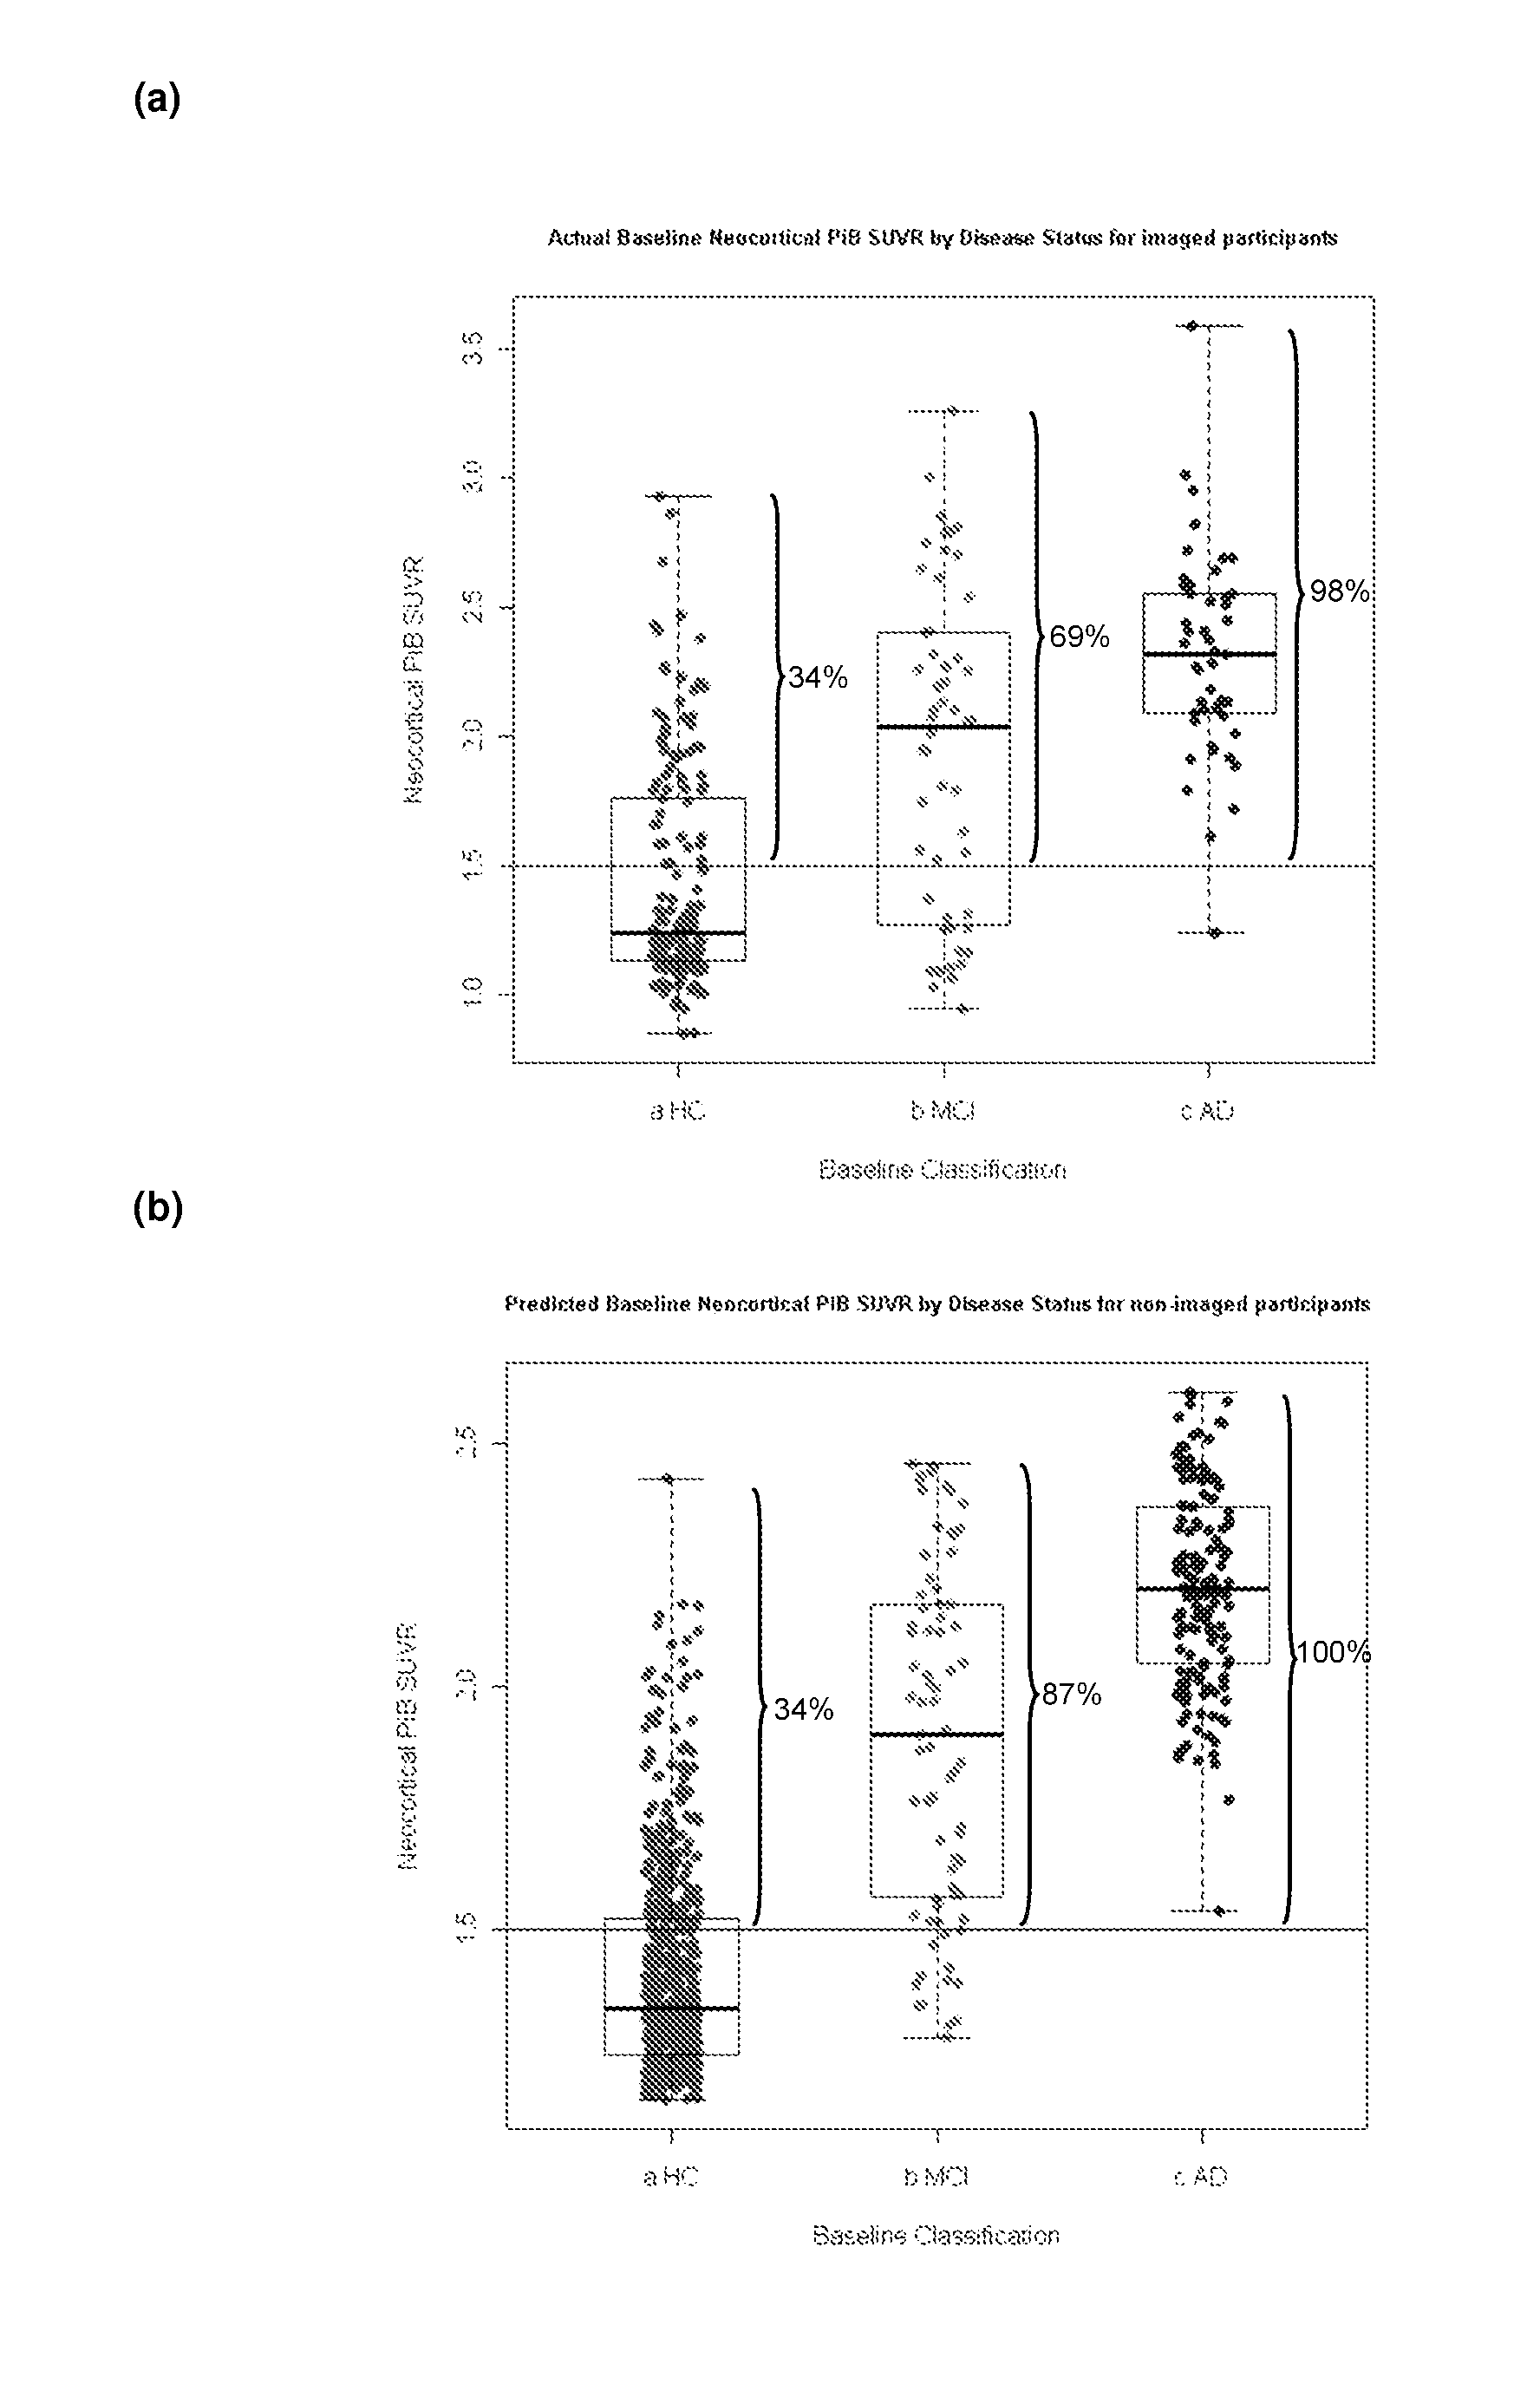
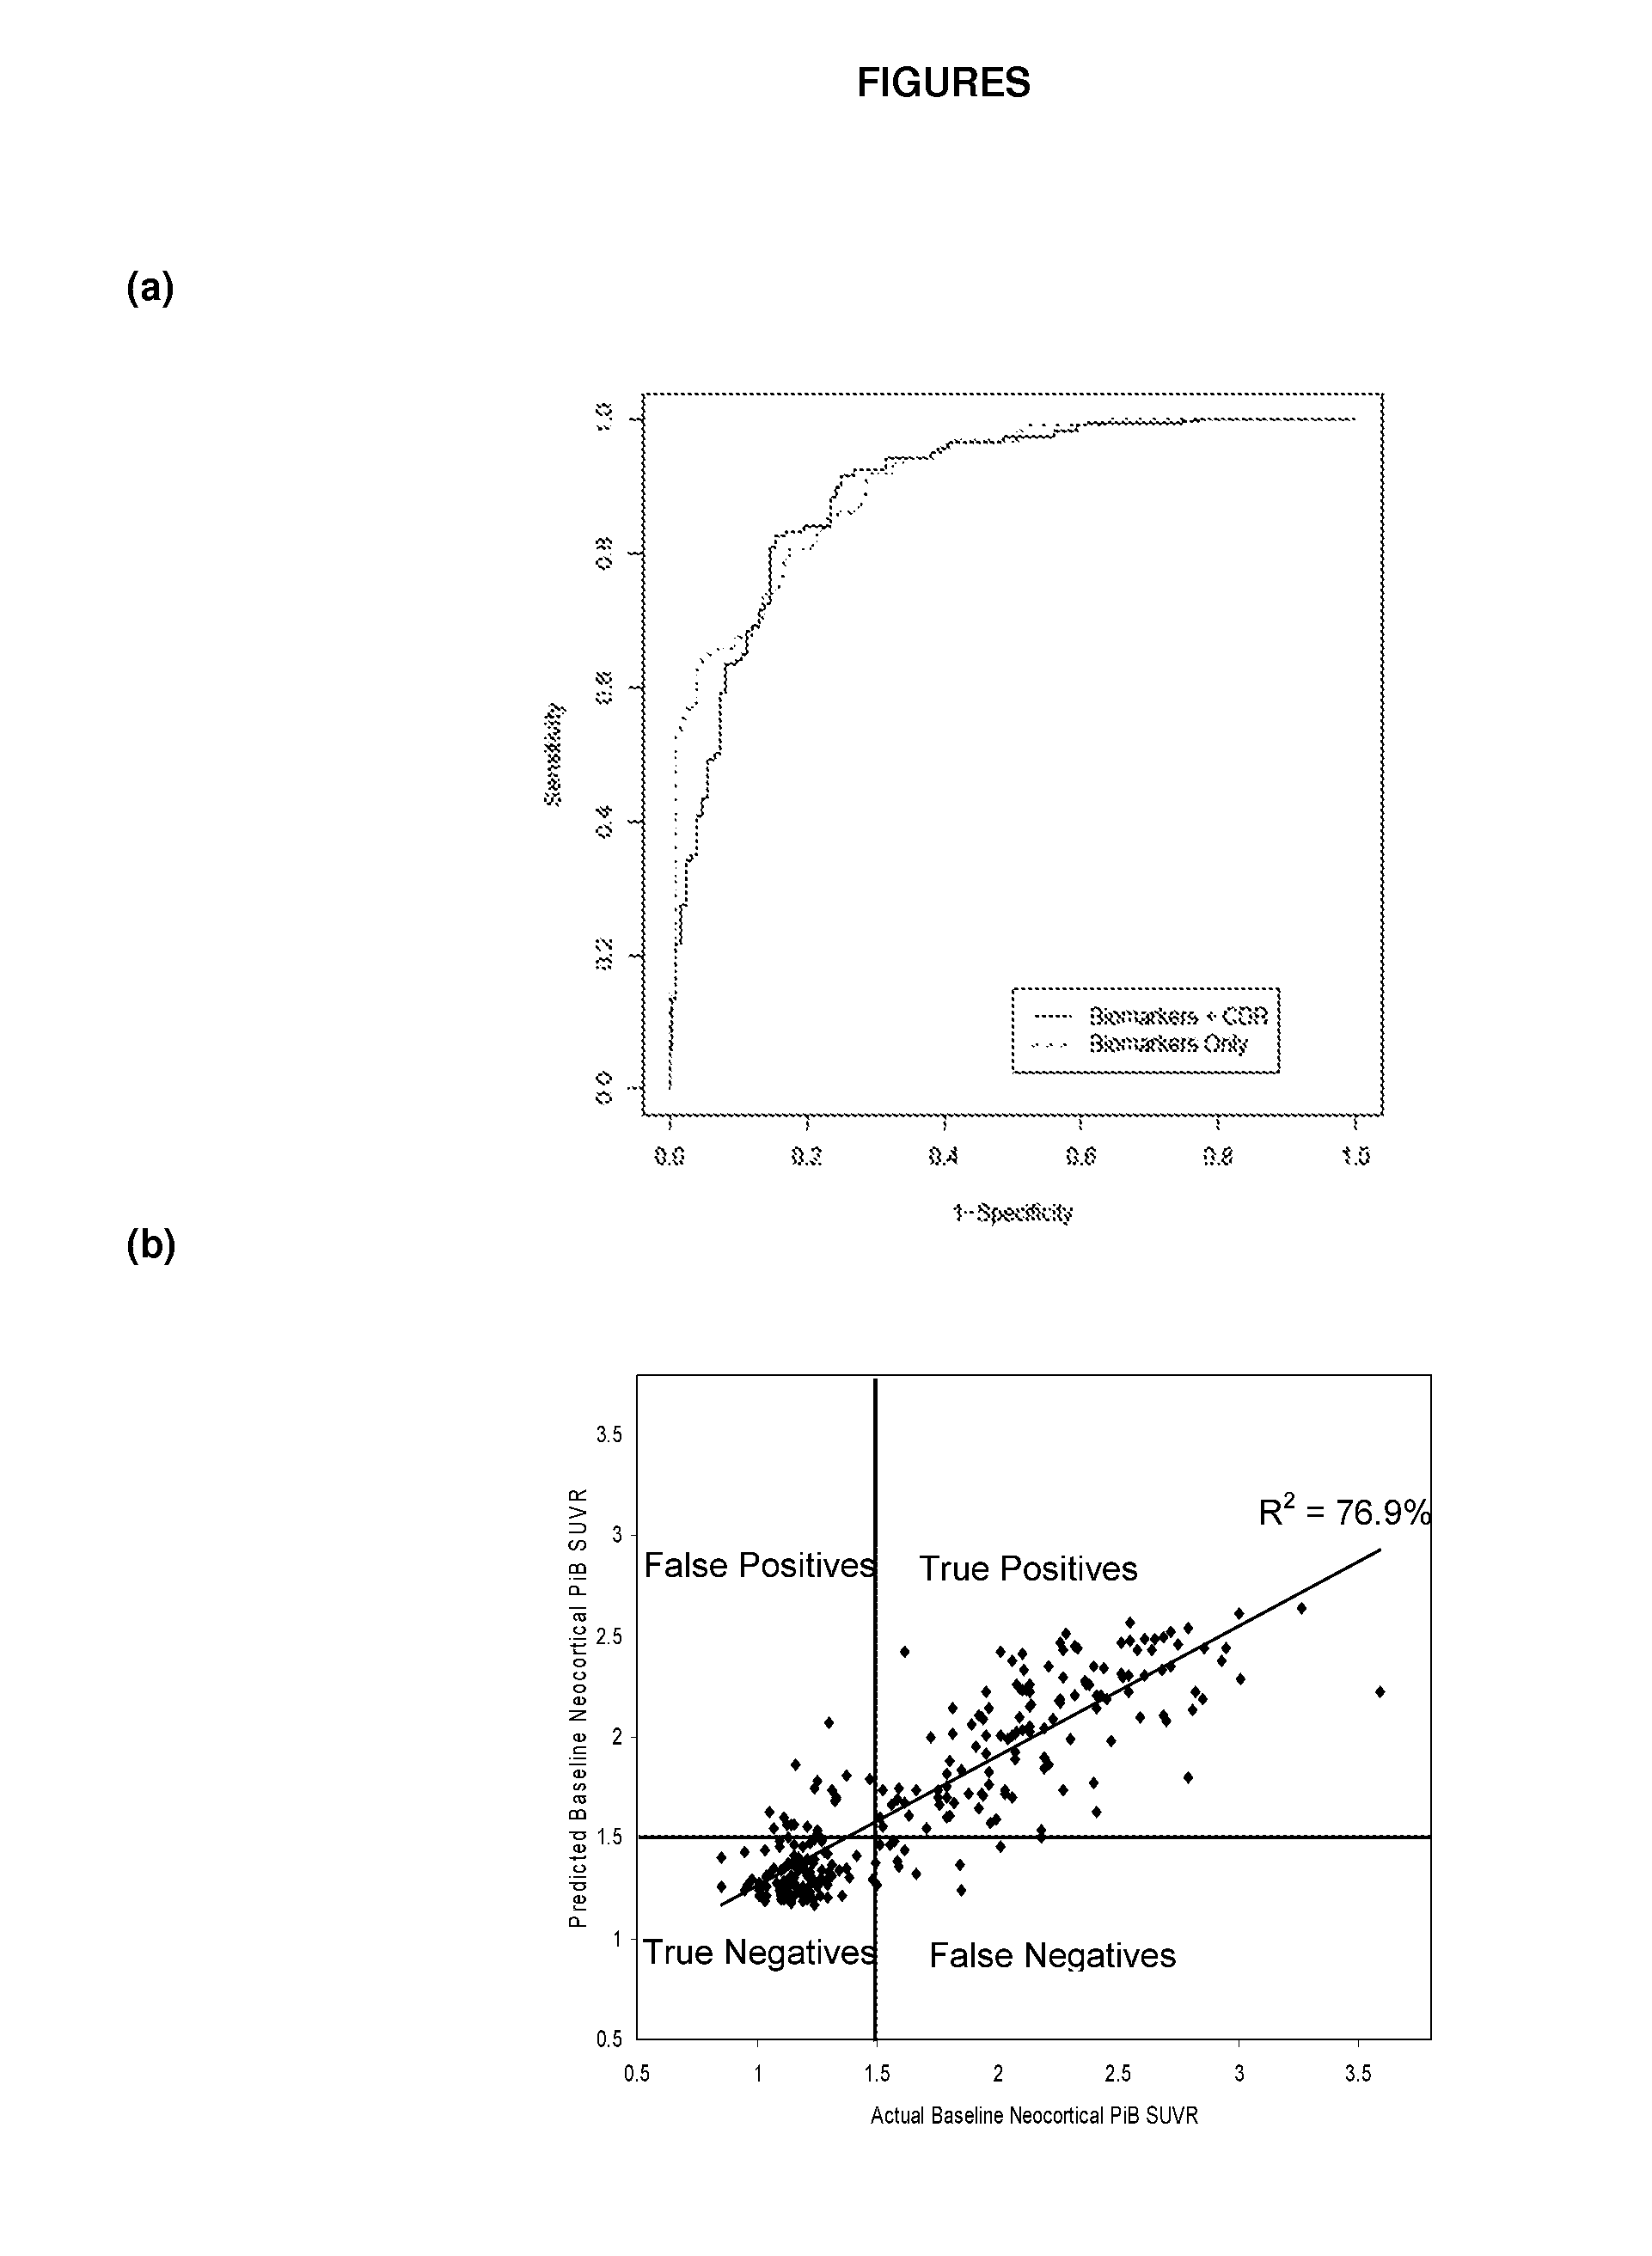
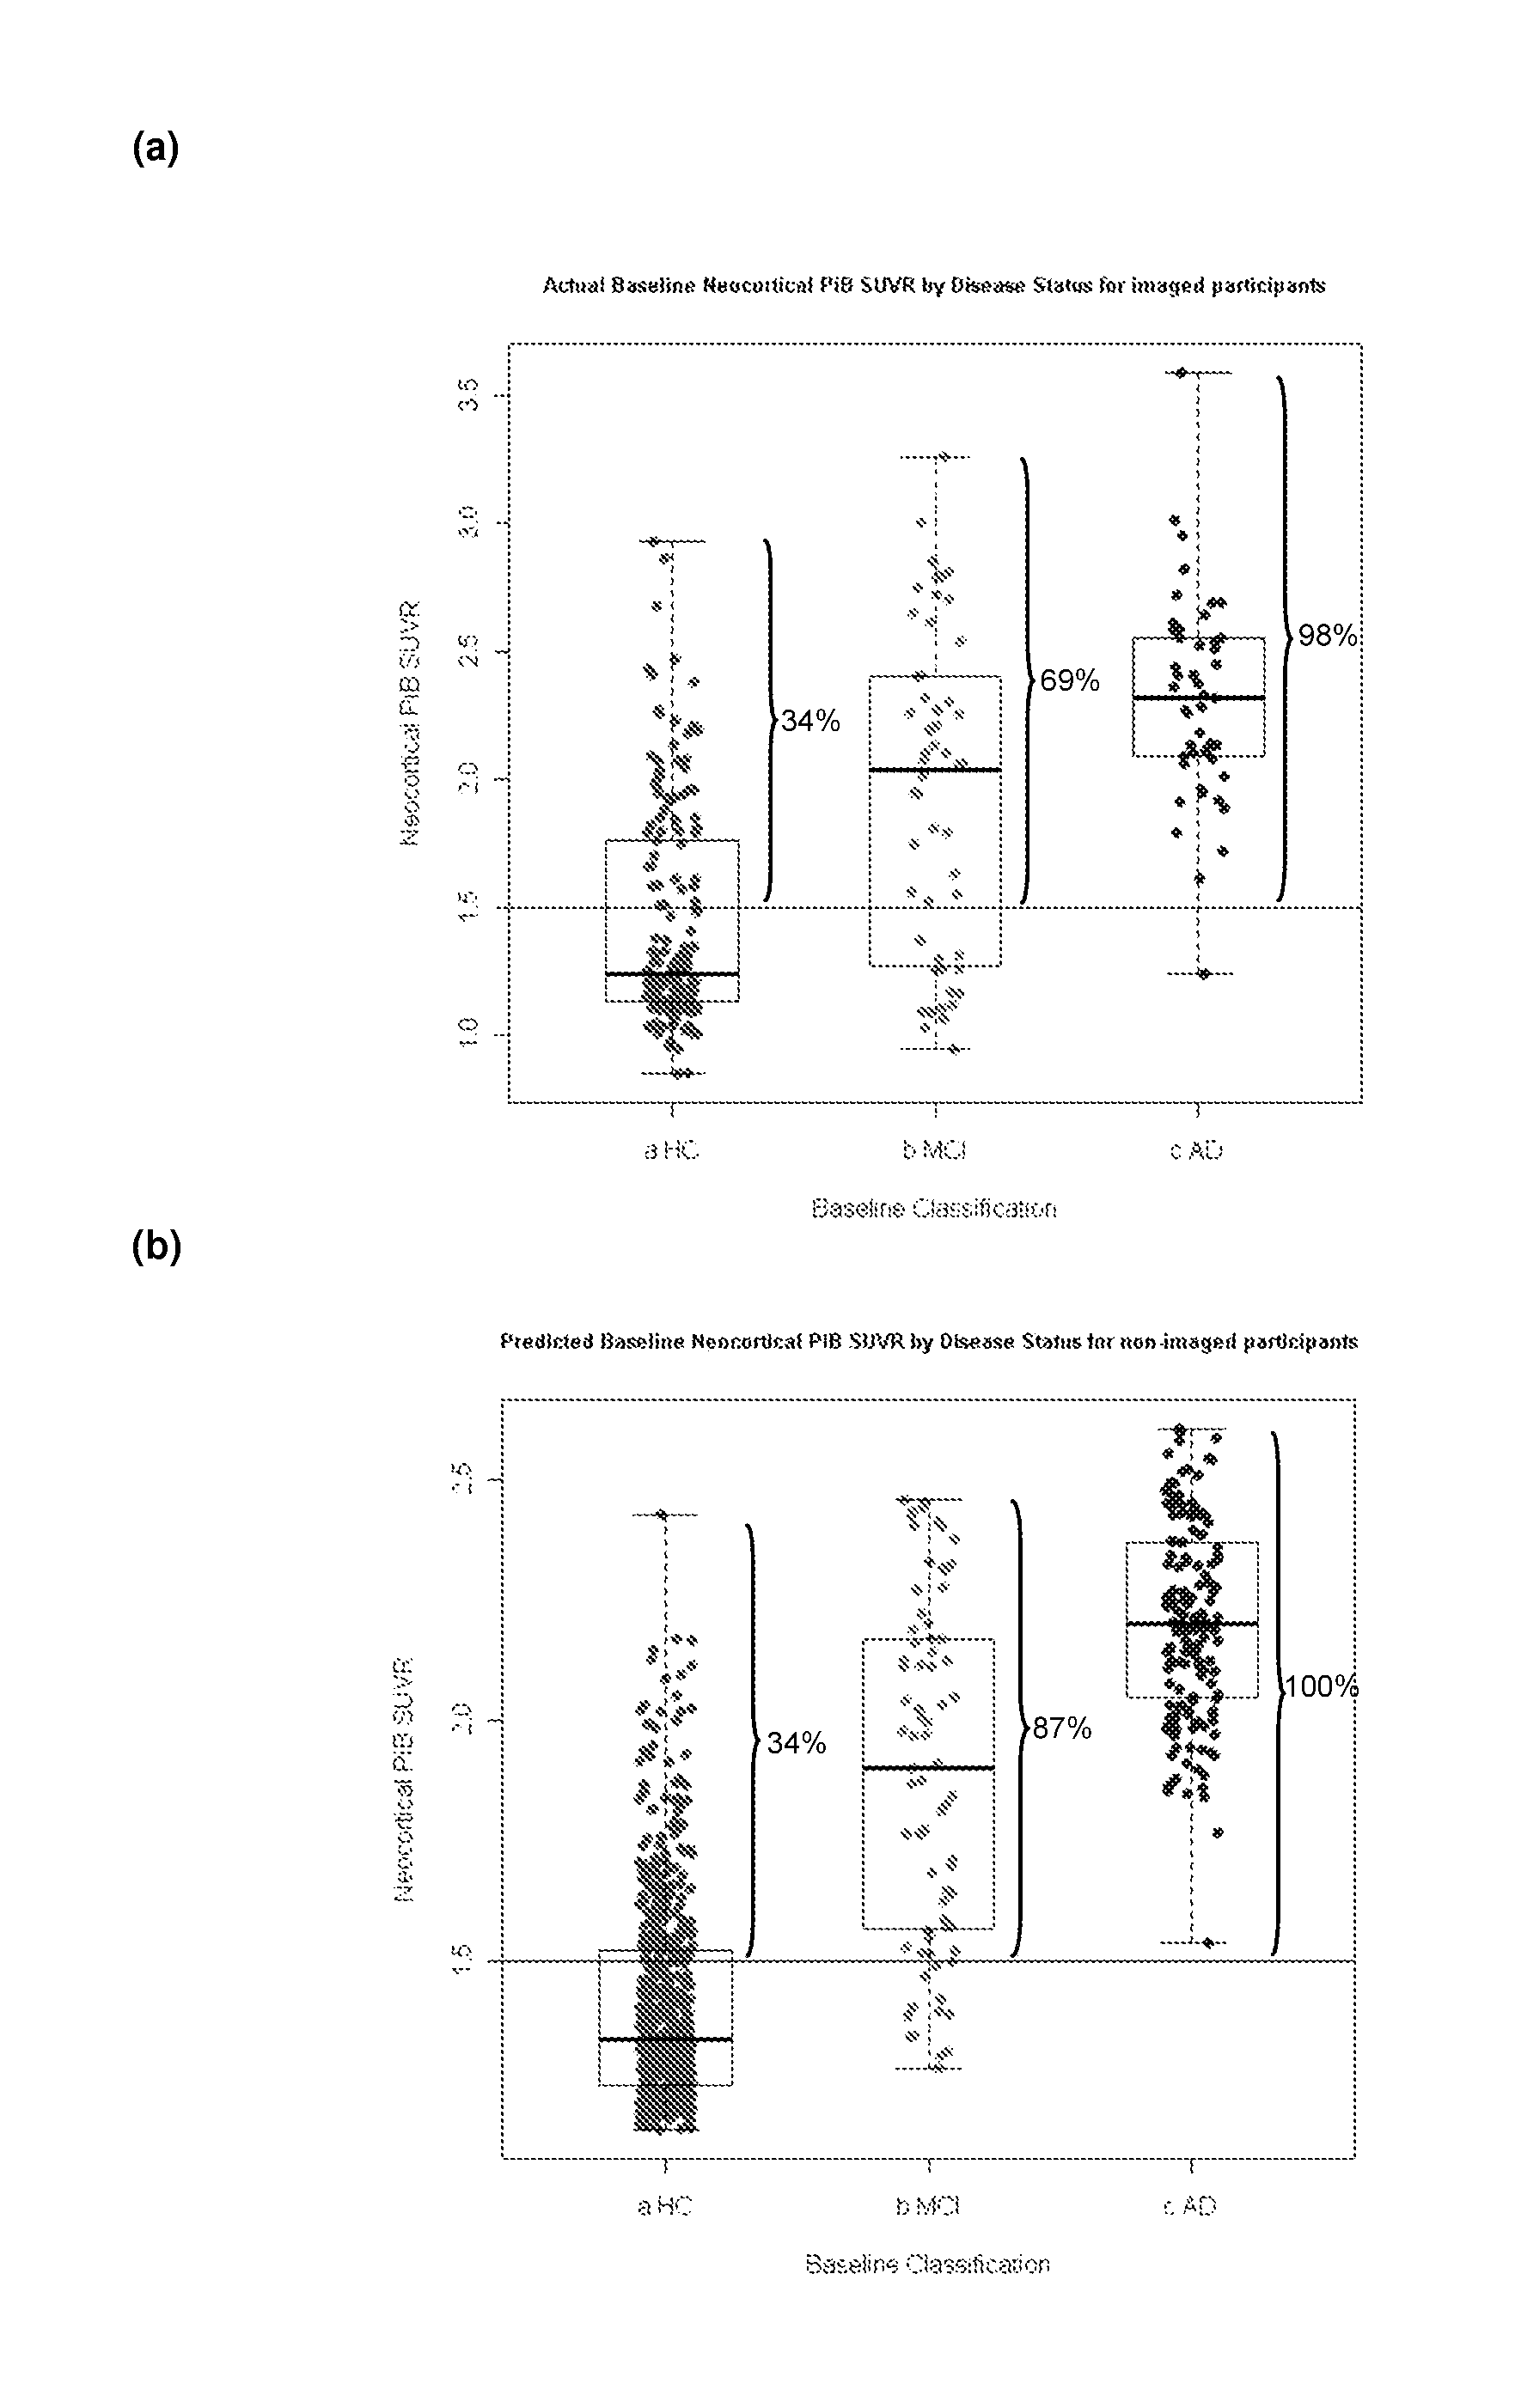
[0214]Two data sets were used. The first set was taken from the Australian Imaging, Biomarkers and Lifestyle (AIBL) Study. Detailed information on the study design and enrolment procedures have been discussed by (Ellis et al. 2009). The cohort consists of 1090 subjects (207 had clinically determined Alzheimers. Disease (AD), 129 had Mild Cognitive Impairment (MCI) and 754 were healthy controls (HC) HC). 273 of the subjects had both blood measurements taken and imaging (PiB-PET). At 18 month timeframe, PET images were taken and samples taken for blood measurements, however the blood measurements have yet to be assayed.
[0215]The second set was obtained from the Alzheimer's Disease Neuroimaging Initiative (ADNI) database (http: / / www.loni.ucla.edu / ADNI). Each of these samples had had baseline blood measurements taken and had been PET imaged at either baseline or a twelve month follow-up. Information on the ADNI study is detailed by (Mueller ...
example 2
1.1 Data Sets
[0246]The same samples from the AIBL cohort and the ADNI discussed in Example 1 were used in this second round analysis.
[0247]In view of the difficulty that could be encountered by when using certain markers in a clinical setting—difficulties because of their assay measurements being potentially unreliable, tricky to perform or too variable certain markers as used in Example 1 were ignored in this second round analysis. In their place, four other bio-, demographic and clinical markers of interest were appended to the blood analytes; the markers included are Gender, ApoE ε4 carrier status, Years of Education and CDR sum of boxes.
[0248]The demographic make-up of both the imaged (AIBL and ADNI) datasets split by high and low NAB for these four markers, Age and Clinical Classification (HC, MCI or AD) are given by TABLE 4. Demographic differences between the high and low NAB were assessed using a X2 test for the categorical variables, analysis of variance (ANOVA) for the con...
PUM
 Abstract
Description
Claims
Application Information
 - R&D
- Intellectual Property
- Life Sciences
- Materials
- Tech Scout
- Unparalleled Data Quality
- Higher Quality Content
- 60% Fewer Hallucinations
Browse by: Latest US Patents, China's latest patents, Technical Efficacy Thesaurus, Application Domain, Technology Topic, Popular Technical Reports.
© 2025 PatSnap. All rights reserved.Legal|Privacy policy|Modern Slavery Act Transparency Statement|Sitemap|About US| Contact US: help@patsnap.com


