
Systems And Methods For Processing Oximetry Signals Using Least Median Squares Techniques

Inactive Publication Date: 2011-04-28
NELLCOR PURITAN BENNETT IRELAND
View PDF72 Cites 35 Cited by
  • Summary
  • Abstract
  • Description
  • Claims
  • Application Information

AI Technical Summary

Benefits of technology

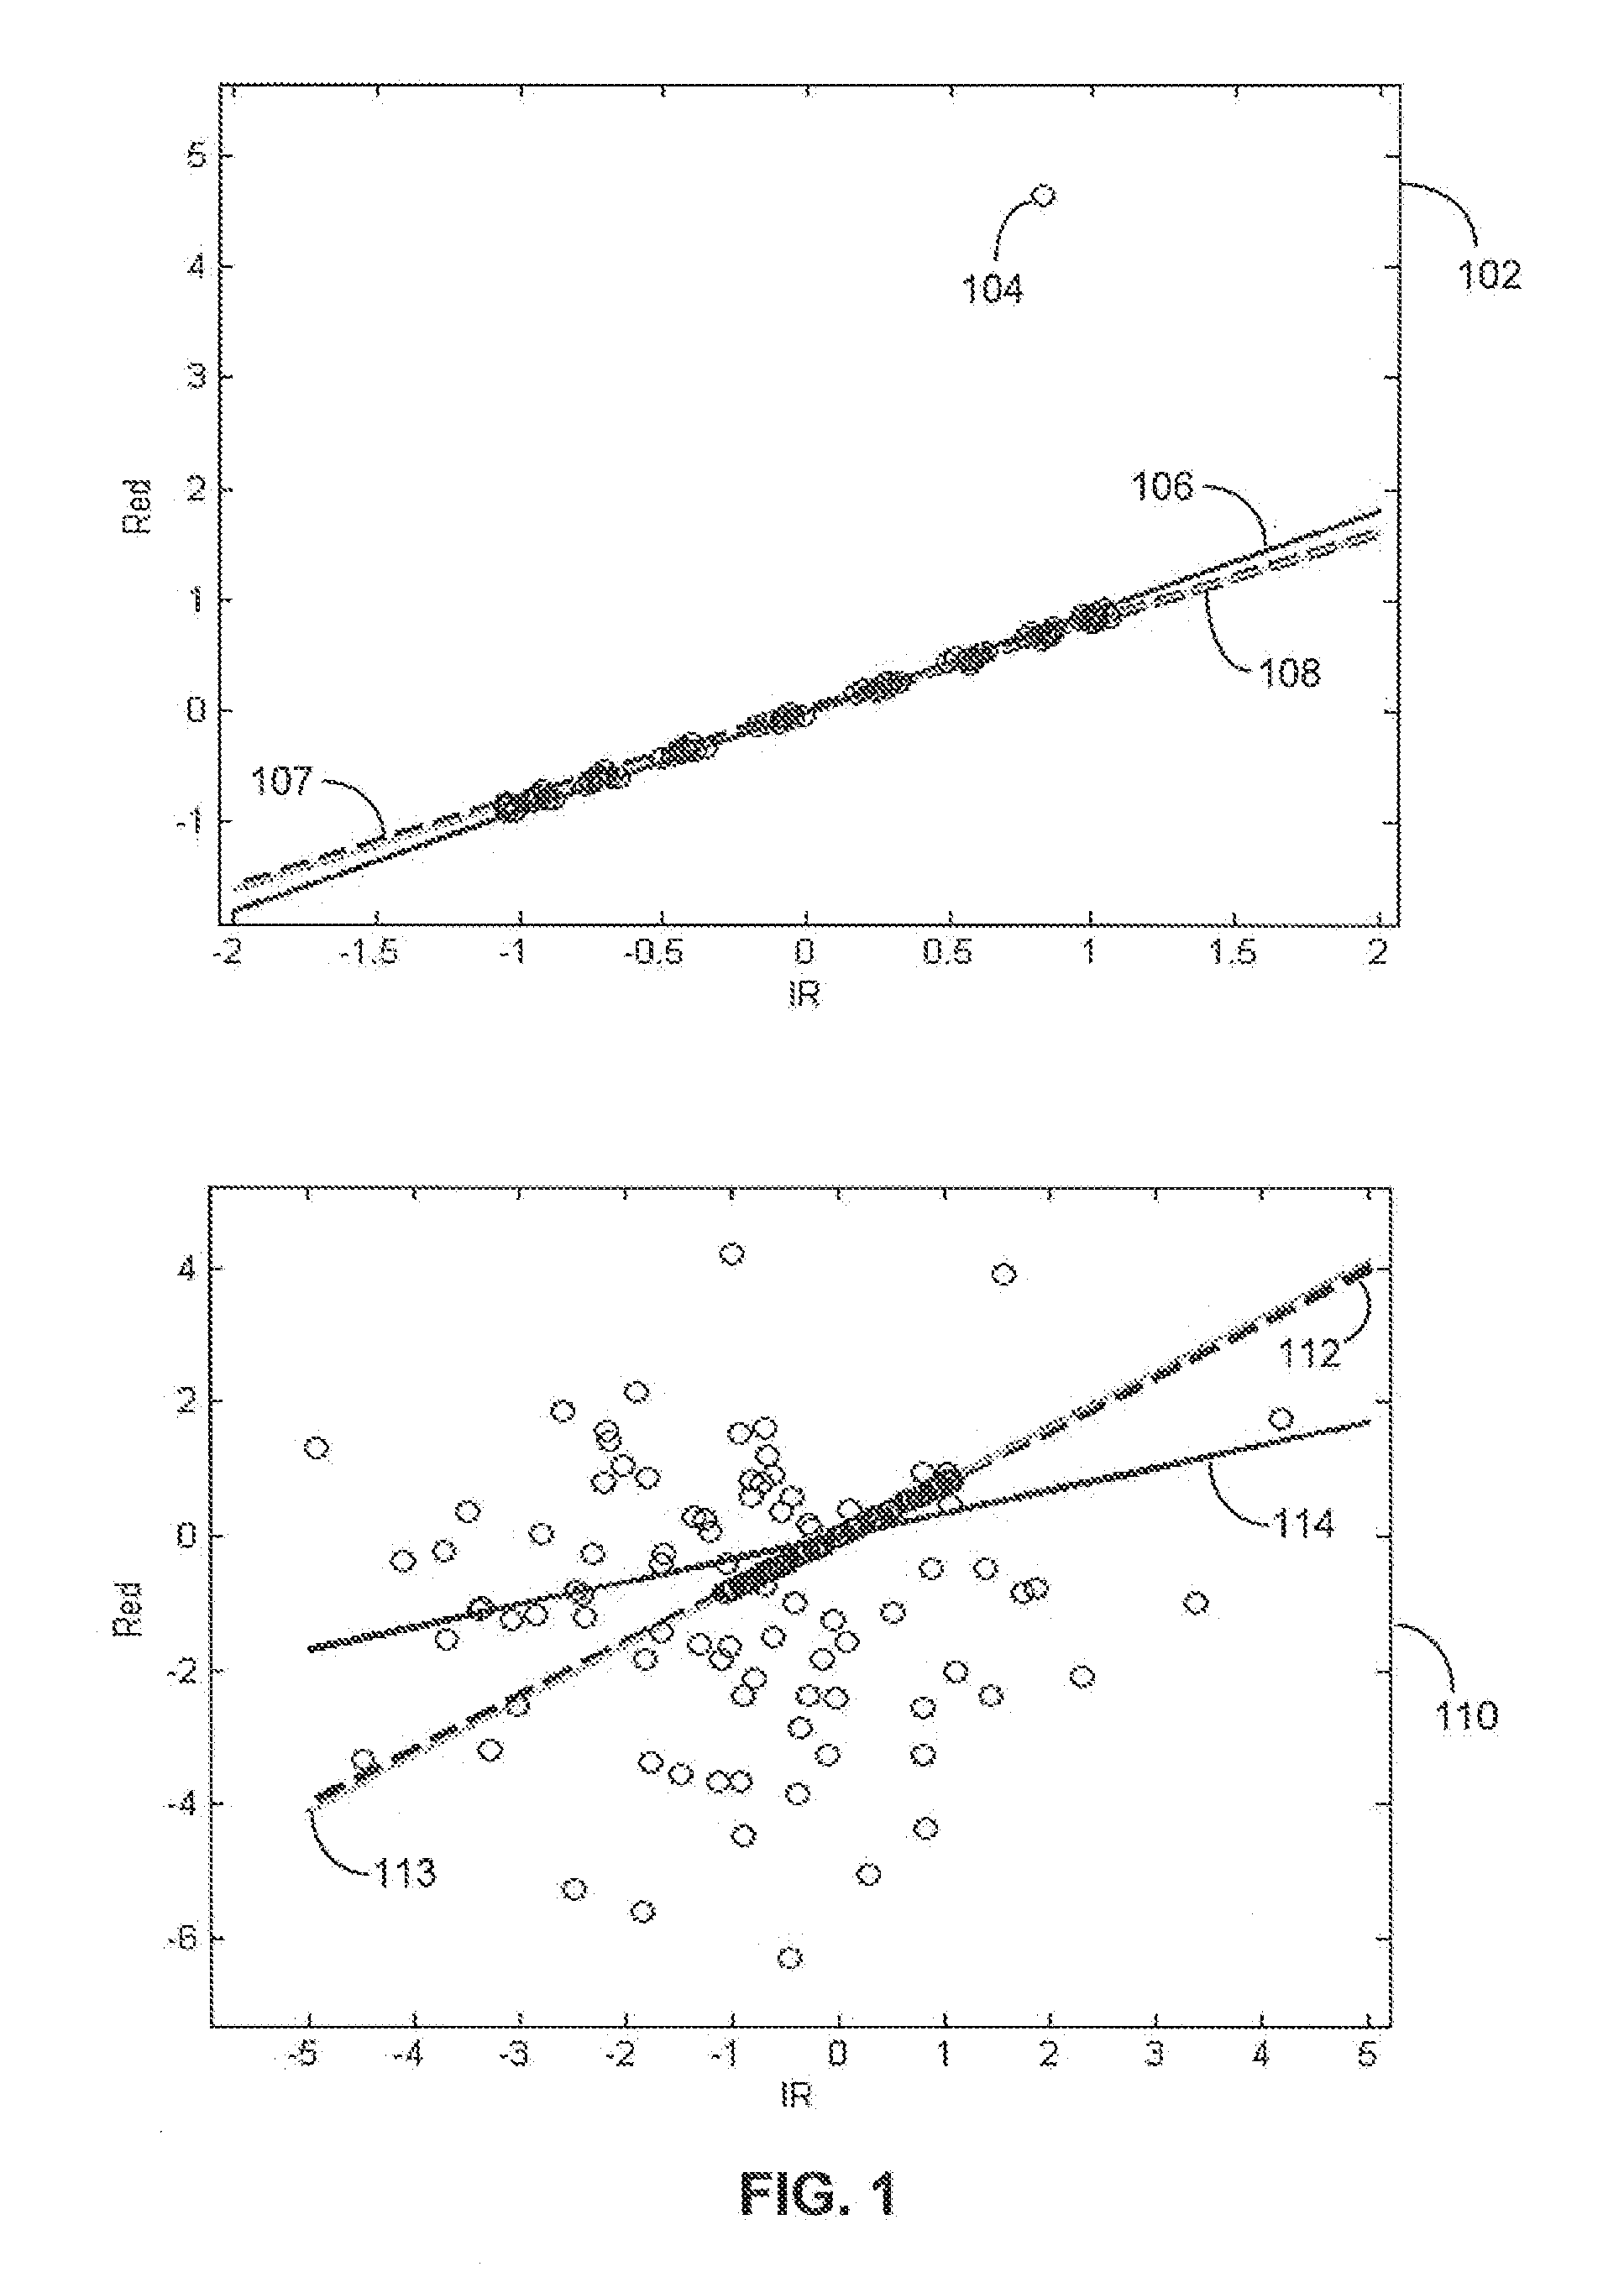
[0007]In some applications, least median squares regression methods may provide improved reliability in the presence of noise and outliers in a measured signal. The median value of a set of values is commonly defined as the middle value of an ordered set of values, or the value that separates the higher half of a set of values from the lower half of a set of values. Least median squares techniques may exhibit improved robustness over least mean squares regressions. For example, in Lissajous FIG. 102 of FIG. 1, solid line 107 indicates the best-fit line returned by a least median squares regression. Solid line 107 is difficult to distinguish from dashed line 108 (the true slope of the curve relating the underlying PPG data). Similarly, in Lissajous FIG. 110 of FIG. 1, solid line 113 indicates the best-fit line returned by a least median squares regression. As in Lissajous FIG. 102, solid line 113 is difficult to distinguish from dashed line 112 indicating the true slope of the curve relating the underlying PPG data of Lissajous FIG. 110. Least median squares techniques may be especially suitable for determining physiological information from signals representative of physiological processes (e.g., as illustrated by the examples of FIG. 1).

Problems solved by technology

These methods often have a closed-form solution, which may be computationally convenient, but are also vulnerable to poor performance when noise and outliers are introduced into the data.
Indeed, such methods are known to have a “zero breakdown point,” which refers to the situation in which a single outlier is capable of rendering a least mean squares regression unreliable.
Because many measurement signals, including physiological signals, are routinely subject to noise and outliers, least mean squares regressions may not always be suitable for these applications.
In such calculations, an error of + / −0.1 in the slope of the line determined by a linear regression method may result in a blood oxygen saturation measurement error of + / −5%, which may trigger false alarms or result in missing a deterioration in a patient's health status.

Method used


Image

  • Systems And Methods For Processing Oximetry Signals Using Least Median Squares Techniques
  • Systems And Methods For Processing Oximetry Signals Using Least Median Squares Techniques
  • Systems And Methods For Processing Oximetry Signals Using Least Median Squares Techniques

Examples


Embodiment Construction

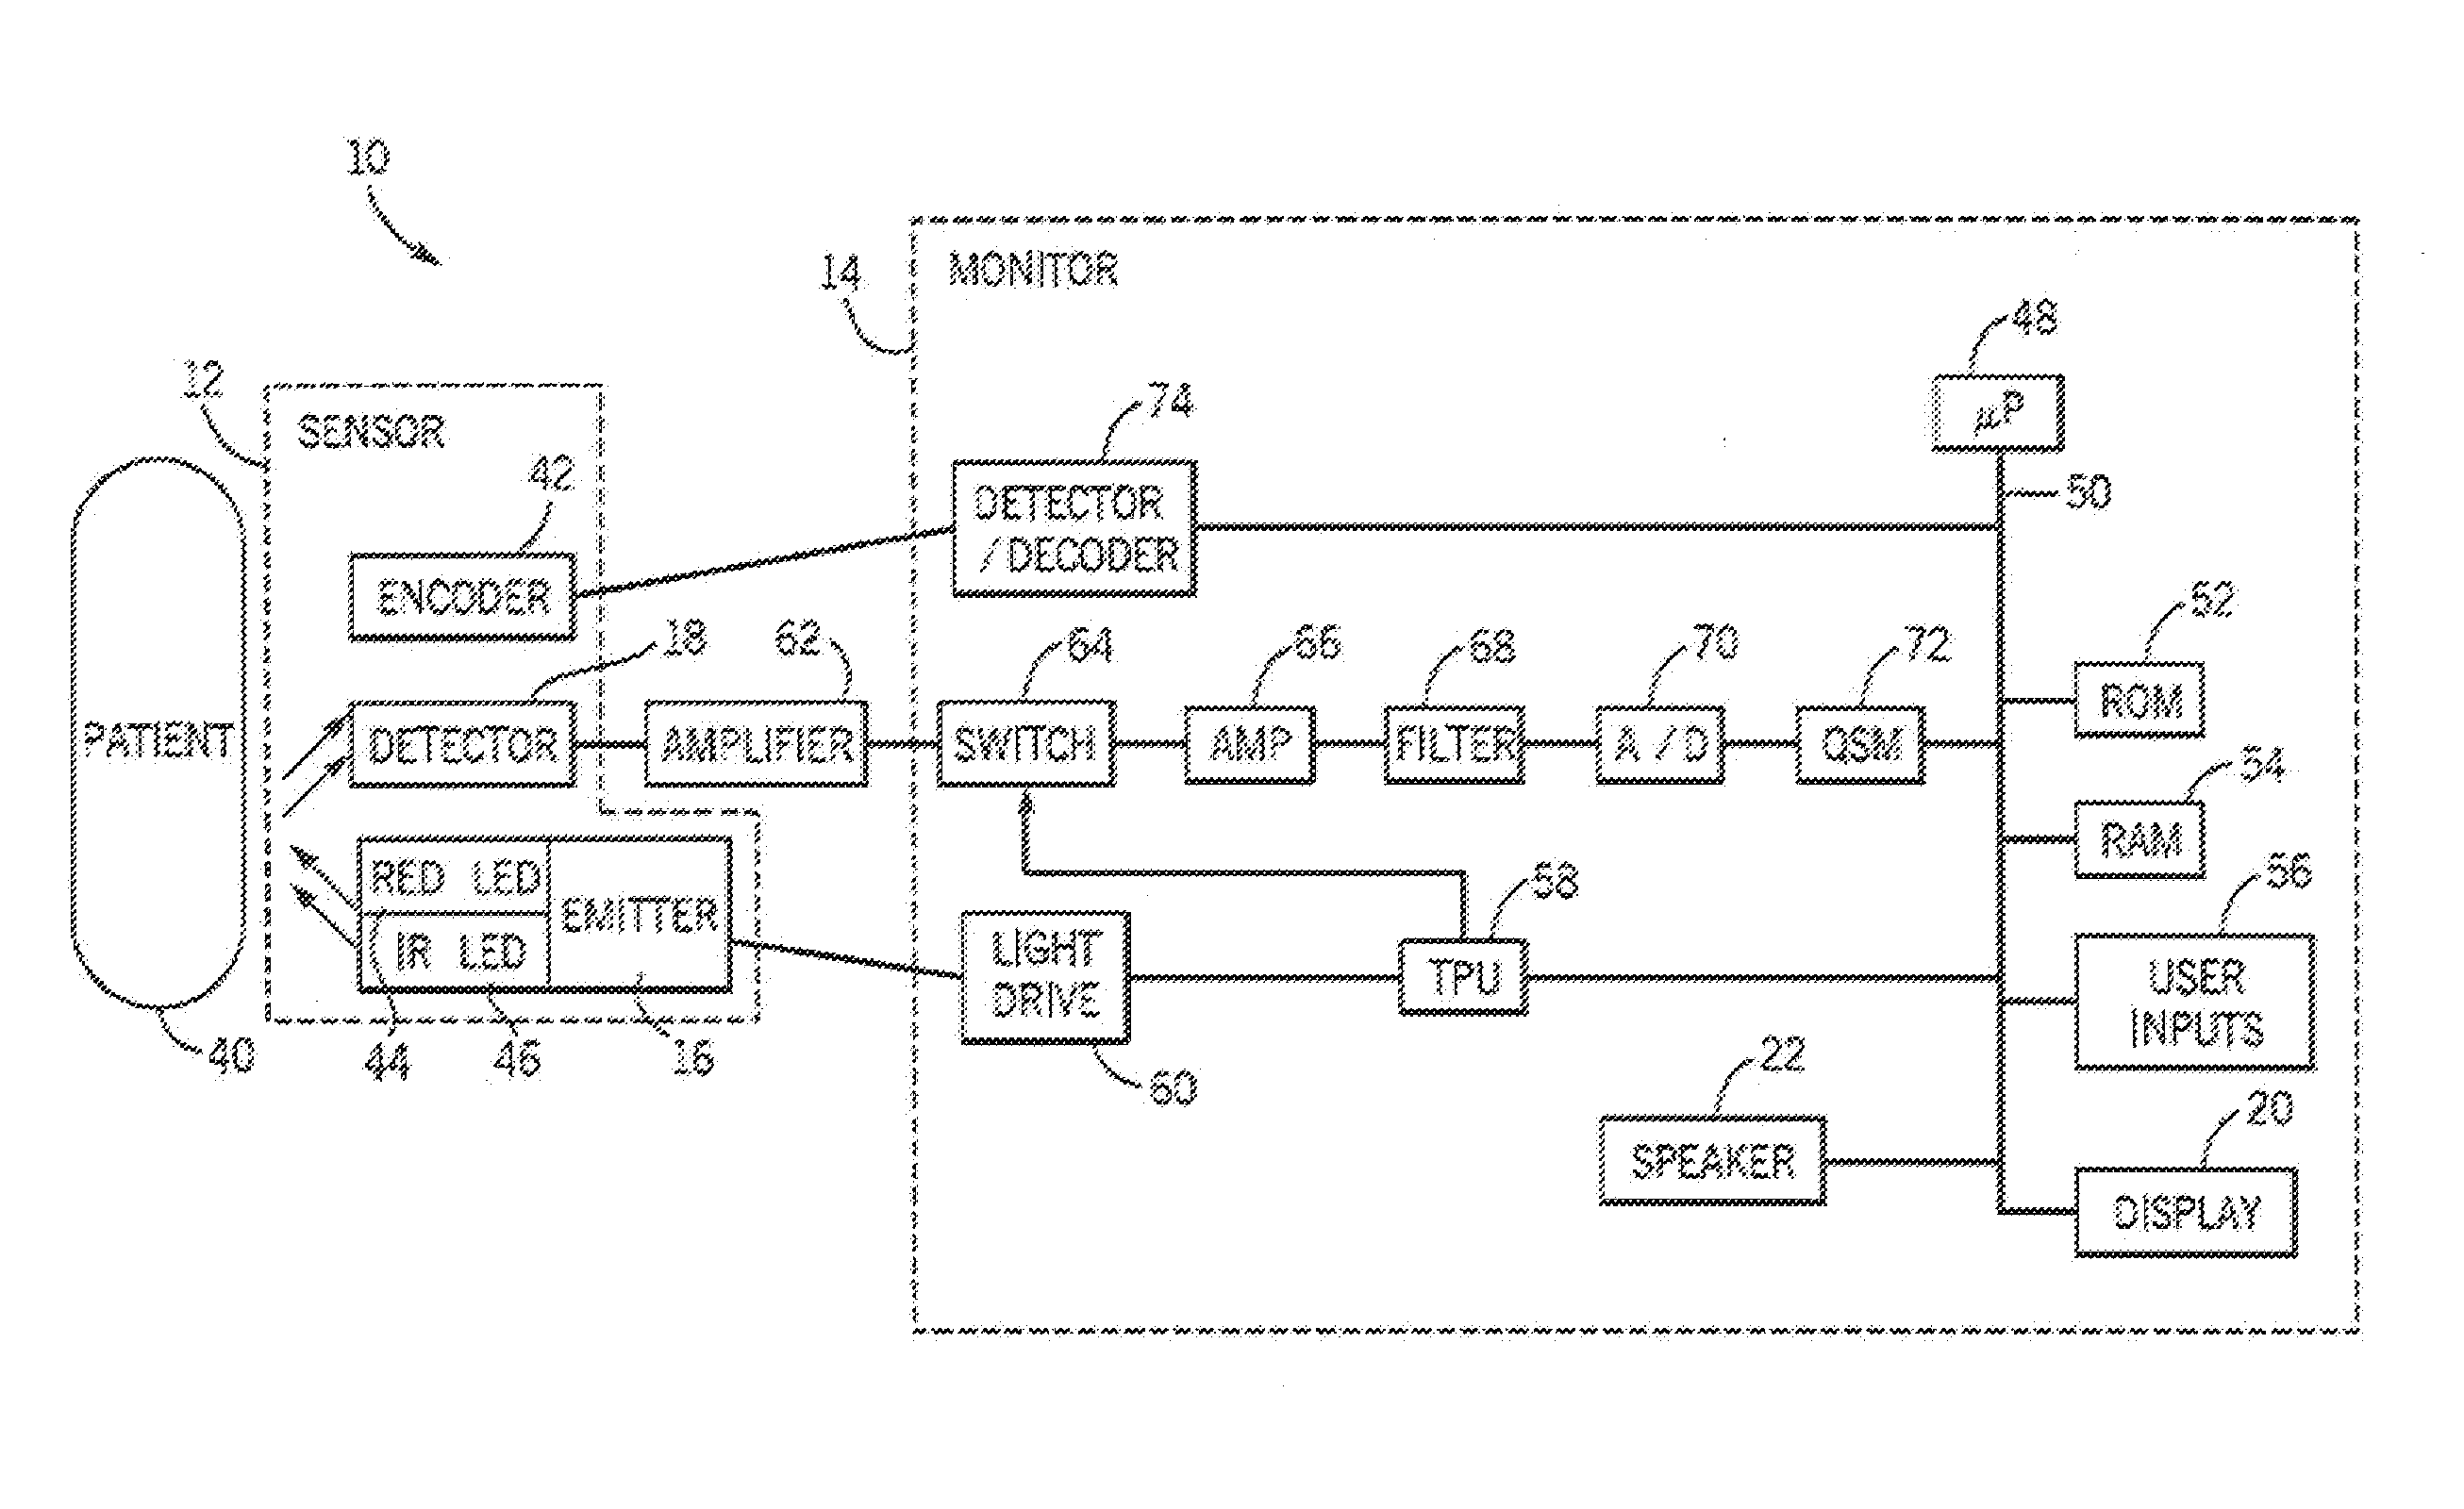
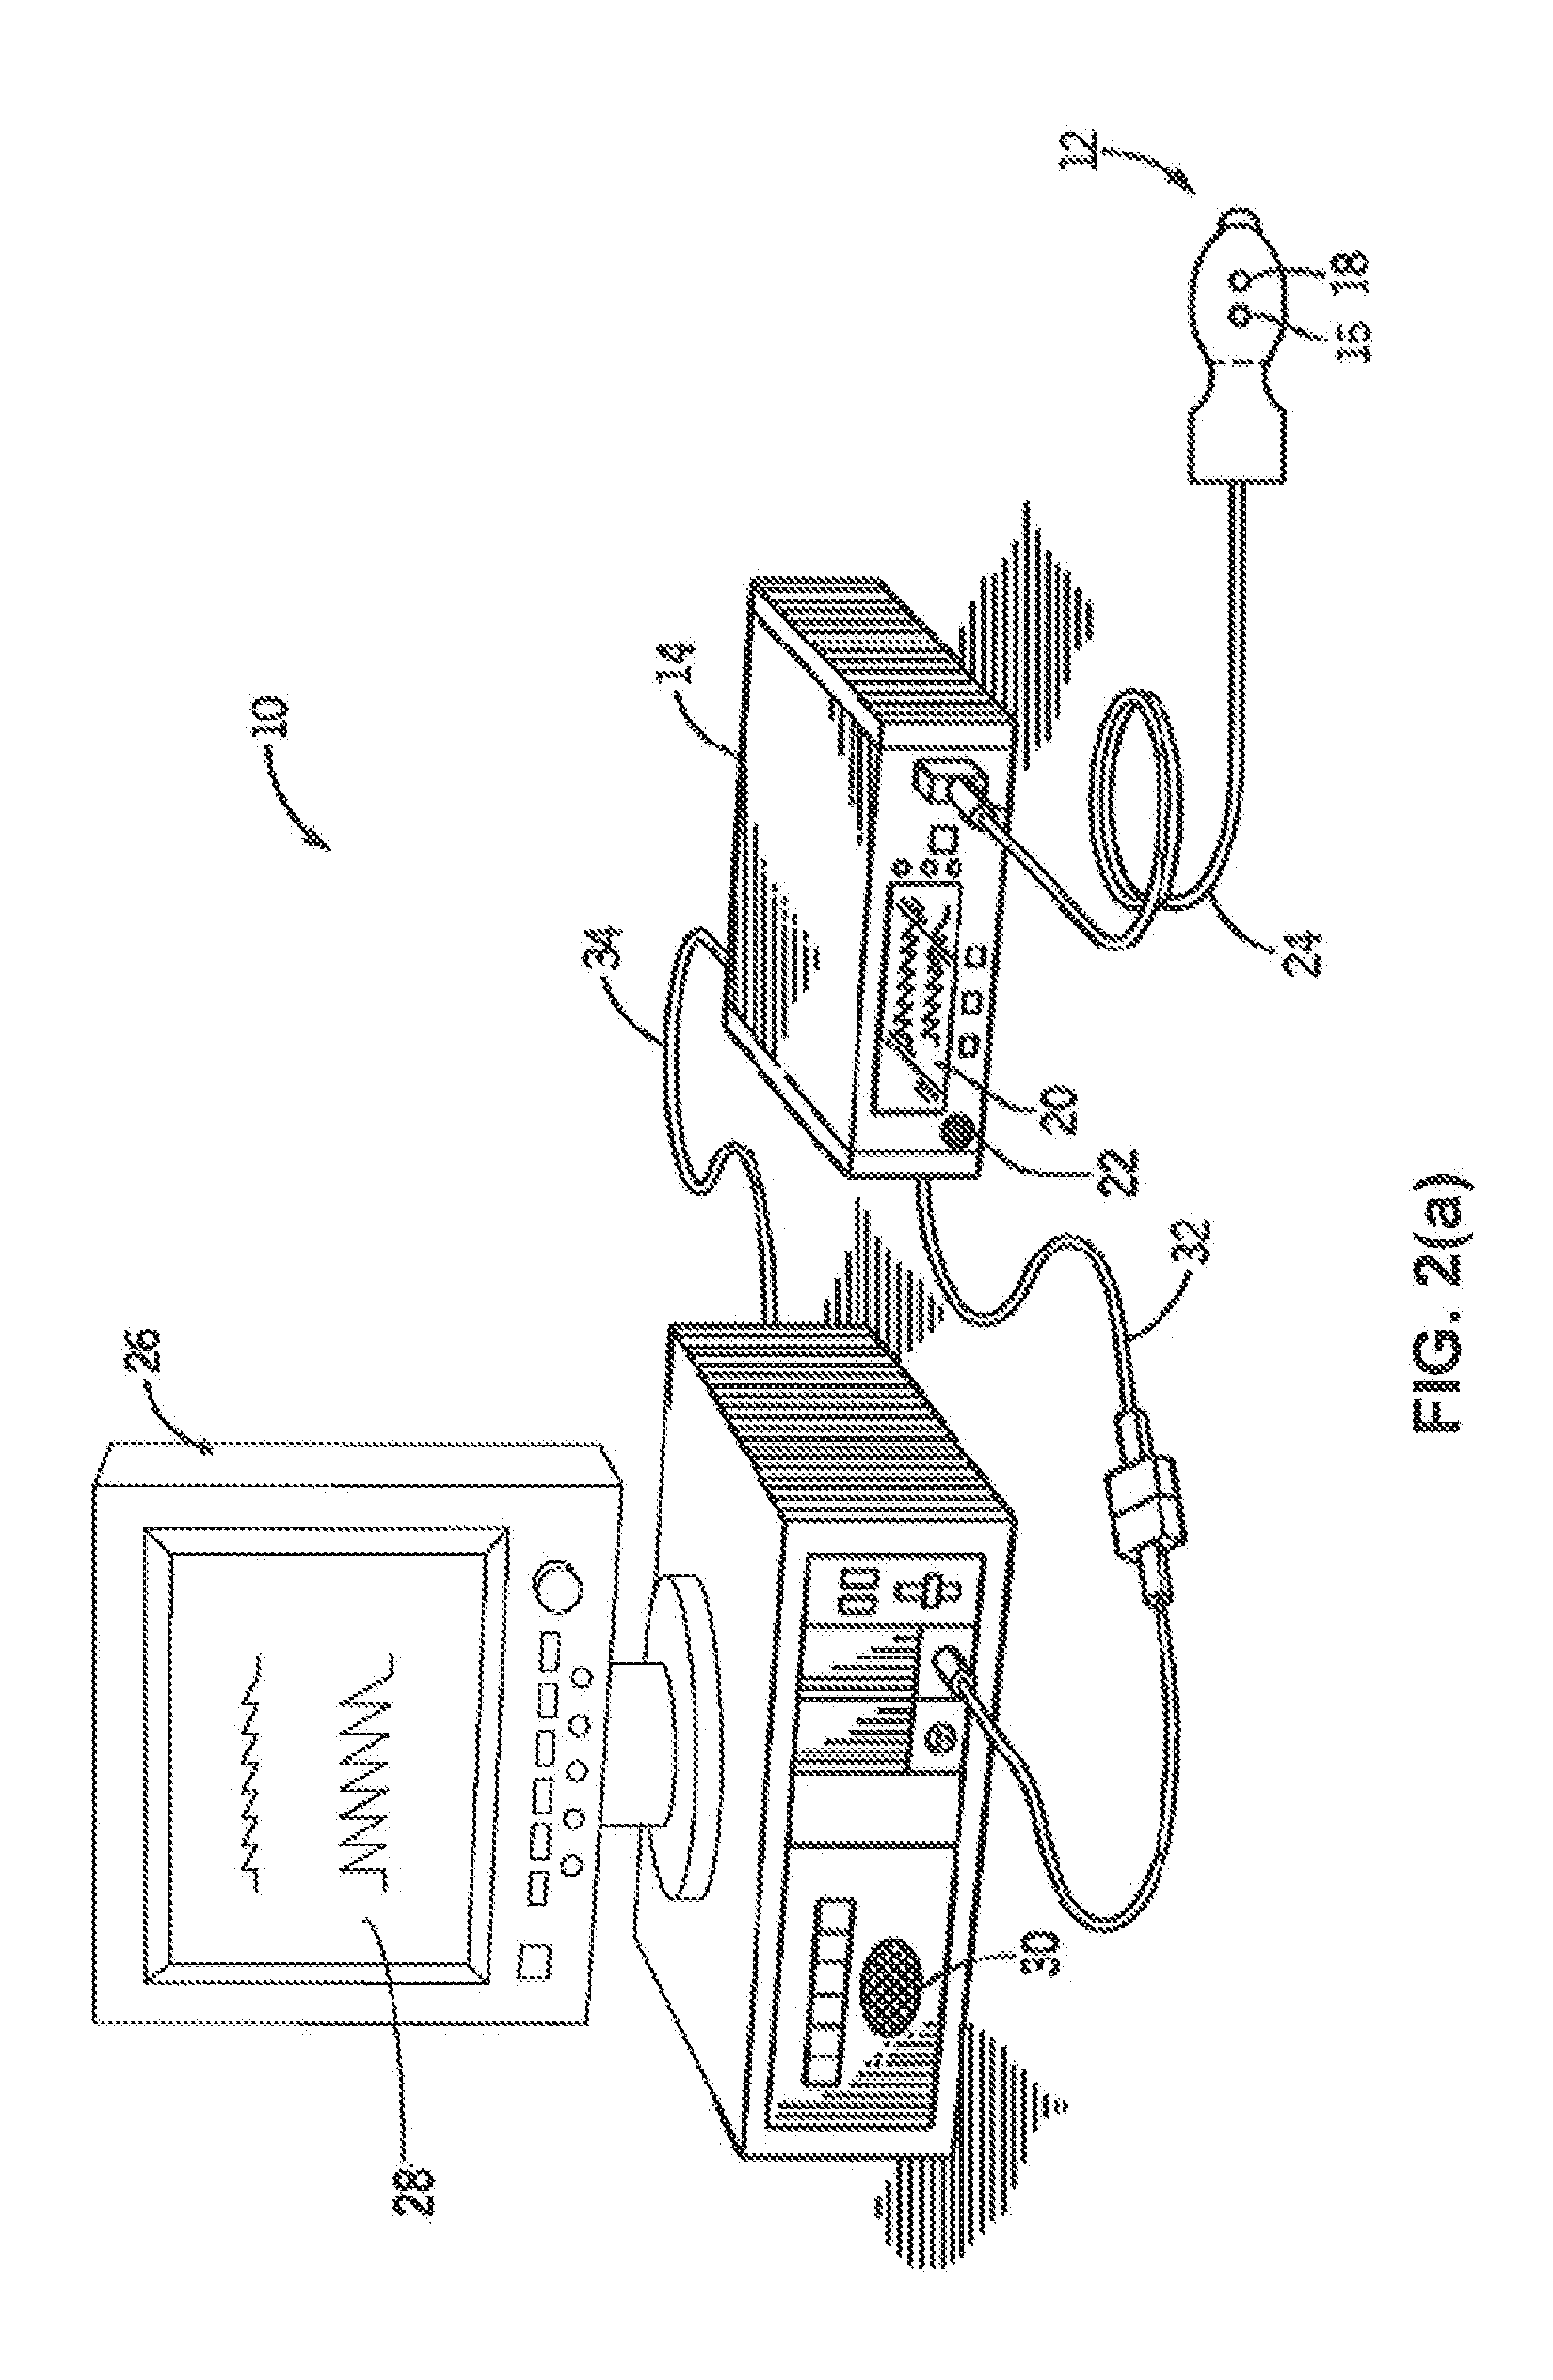
[0022]An oximeter is a medical device that may determine the oxygen saturation of the blood. One common type of oximeter is a pulse oximeter, which may indirectly measure the oxygen saturation of a patient's blood (as opposed to measuring oxygen saturation directly by analyzing a blood sample taken from the patient) and changes in blood volume in the skin. Ancillary to the blood oxygen saturation measurement, pulse oximeters may also be used to measure the pulse rate of the patient. Pulse oximeters typically measure and display various blood flow characteristics including, but not limited to, the oxygen saturation of hemoglobin in arterial blood.

[0023]An oximeter may include a light sensor that is placed at a site on a patient, typically a fingertip, toe, forehead or earlobe, or in the case of a neonate, across a foot. The oximeter may pass light using a light source through blood perfused tissue and photoelectrically sense the absorption of light in the tissue. For example, the oxi...


PUM


Abstract

Methods and systems are disclosed for determining information from a signal using least median squares techniques, including determining blood oxygen saturation measurements based at least in part on photoplethysmograph signals. In an embodiment, a Lissajous figure is generated based on multiple measurements and least median squares techniques may be used for one or more of: determining information, assessing measurement confidence, filtering measurements, and choosing a regression analysis technique.

Description

SUMMARY OF THE DISCLOSURE[0001]The present disclosure relates to signal analysis and, more particularly, the present disclosure relates to signal analysis using least median squares techniques in connection with, for example, physiological signals.[0002]Many measurement systems require one or more signal processing steps to determine useful information from a measured signal. In some applications, these signal processing steps include determining a best-fit or regression curve from a series of one or more measurements.[0003]One of the most common regression methods is the calculation of a linear regression curve using a least mean squares error metric. In such a method, a best-fit line is calculated by determining the parameters (e.g., slope and y-intercept) of a line that minimize the mean squared difference between the line and the measured data. These methods often have a closed-form solution, which may be computationally convenient, but are also vulnerable to poor performance wh...

Claims


Application Information

Patent Timeline
IPC IPC(8): G06F17/18G06F19/00
CPCA61B5/14551A61B5/7203A61B5/7267G06F17/18G06K9/00523A61B5/726G06F2218/08
Inventor OCHS, JAMES
Owner NELLCOR PURITAN BENNETT IRELAND
Learn More