Eureka AIR delivers breakthrough ideas for toughest innovation challenges, trusted by R&D personnel around the world.

System and Method for Predicting Future Fractures

a future fracture and system technology, applied in the field of system and method for predicting future fractures, can solve the problems of large dxa system, large bmd measurement errors, and limited accuracy of dxa scans

Active Publication Date: 2011-02-17
IMATX
View PDF62 Cites 101 Cited by
  • Summary
  • Abstract
  • Description
  • Claims
  • Application Information

AI Technical Summary

Benefits of technology

[0020]In another embodiment, a method of determining the effect of a candidate agent on a subject's prognosis for musculoskeletal disease includes: predicting a first risk of musculoskeletal disease in the subject according to any of the predictive methods described herein; administering a candidate agent to the subject; predicting a second risk of the musculoskeletal disease in the subject according to any of the predictive methods described herein; and comparing the first and second risks, thereby determining the effect of the candidate on the subject's prognosis for the disease. In any of these methods, the candidate agent can be administered to the subject in any modality, for example, by injection (intramuscular, subcutaneous, int

Problems solved by technology

Osteoporosis is among the most common conditions to affect the musculoskeletal system, as well as a frequent cause of locomotor pain and disability.
However, it is widely recognized that the accuracy of DXA scans is limited by the variable composition of soft tissue.
Differences in the soft tissue composition in the path of the x-ray beam through bone compared with the adjacent soft tissue reference area cause errors in the BMD measurements, according to the results of several studies.
Moreover, DXA systems are large and expensive, ranging in price between $75,000 and $150,000.
This reduces the accuracy errors but at the price of poorer precision and higher radiation dose.
Like DXA, however, QCT are very expensive and the use of such equipment is currently limited to few research centers.
There remain, however, several limitations to QUS measurements.
The success of QUS in predicting fracture risk in younger patients remains uncertain.
Another difficulty with QUS measurements is that they are not readily encompassed within the WHO definitions of osteoporosis and osteopenia.
Moreover, no intervention thresholds have been developed.
Thus, measurements cannot be used for therapeutic decision-making.
There are also several technical limitations to QUS.
Thus, the measurement site is not readily adapted to different sizes and shapes of the calcaneus, and the exact anatomic site of the measurement varies from patient to patient.
It is generally agreed that the relatively poor precision of QUS measurements makes most devices unsuitable for monitoring patients' response to treatment.
Furthermore, current methods and devices do not generally take into account bone structure analyses.
BMD does not accurately predict the presence of osteoporotic fracture.

Method used


Image

  • System and Method for Predicting Future Fractures
  • System and Method for Predicting Future Fractures
  • System and Method for Predicting Future Fractures

Examples


example 1

Correlation of Micro-Structural and Macro-Structural Parameters to Fracture Load

[0121]Using 15 fresh cadaveric femurs, the following analyses were performed to determine the correlation of various micro-structural and macro-structural parameters to fracture load, as determined by biomechanical testing. Parameters measured included one or more of the following:

Parameter NameDescriptionMeasurements on gray values of extracted structuresStd. dev. ofNormalized ROI is subtracted from the background using a difference ofnormalized ROIgaussian filter. The standard deviation reflects the “roughness” of thetrabecular structures.Measurements on binarization of extracted structuresTrab. PerimeterTotal length of outline (perimeter) of extracted trabecular structures in aROI.Trab.Trabecular perimeter normalized by area of extracted trabecular structures.Perimeter / Trab.AreaTrab.Trabecular perimeter normalized by ROI area.Perimeter / TotalAreaTrabecular BoneChange of perimeter per change of area. Me...

example 2

Correlation of 2D and 3D Measurements

[0141]To demonstrate that these methods that use 2D x-ray technology to quantitatively assess trabecular architecture are as effective as 3D .mu.CT, which serves as a gold standard for such measurements, the following experiments were performed. Bone cores (n=48) were harvested from cadaveric proximal femora. Specimen radiographs were obtained and 2D structural parameters were measured on the radiographs. Cores were then subjected to 3D .mu.CT and biomechanical testing. The .mu.CT images were analyzed to obtained 3D micro-structural measurements. Digitized 2D x-ray images of these cores were also analyzed as described herein to obtain comparative micro-structural measurements.

[0142]Results showed very good correlation among the numerous 2D parameters and 3D .mu.CT measurements, including for example correlation between 2D Trabecular Perimeter / Trabecular Area (Tb.P / Tb.A) with 3D Bone Surface / Bone Volume (r=0.92, p<0.001), and 2D Trabecular Separat...

example 3

Sliding Window Analysis and Watershed Segmentation

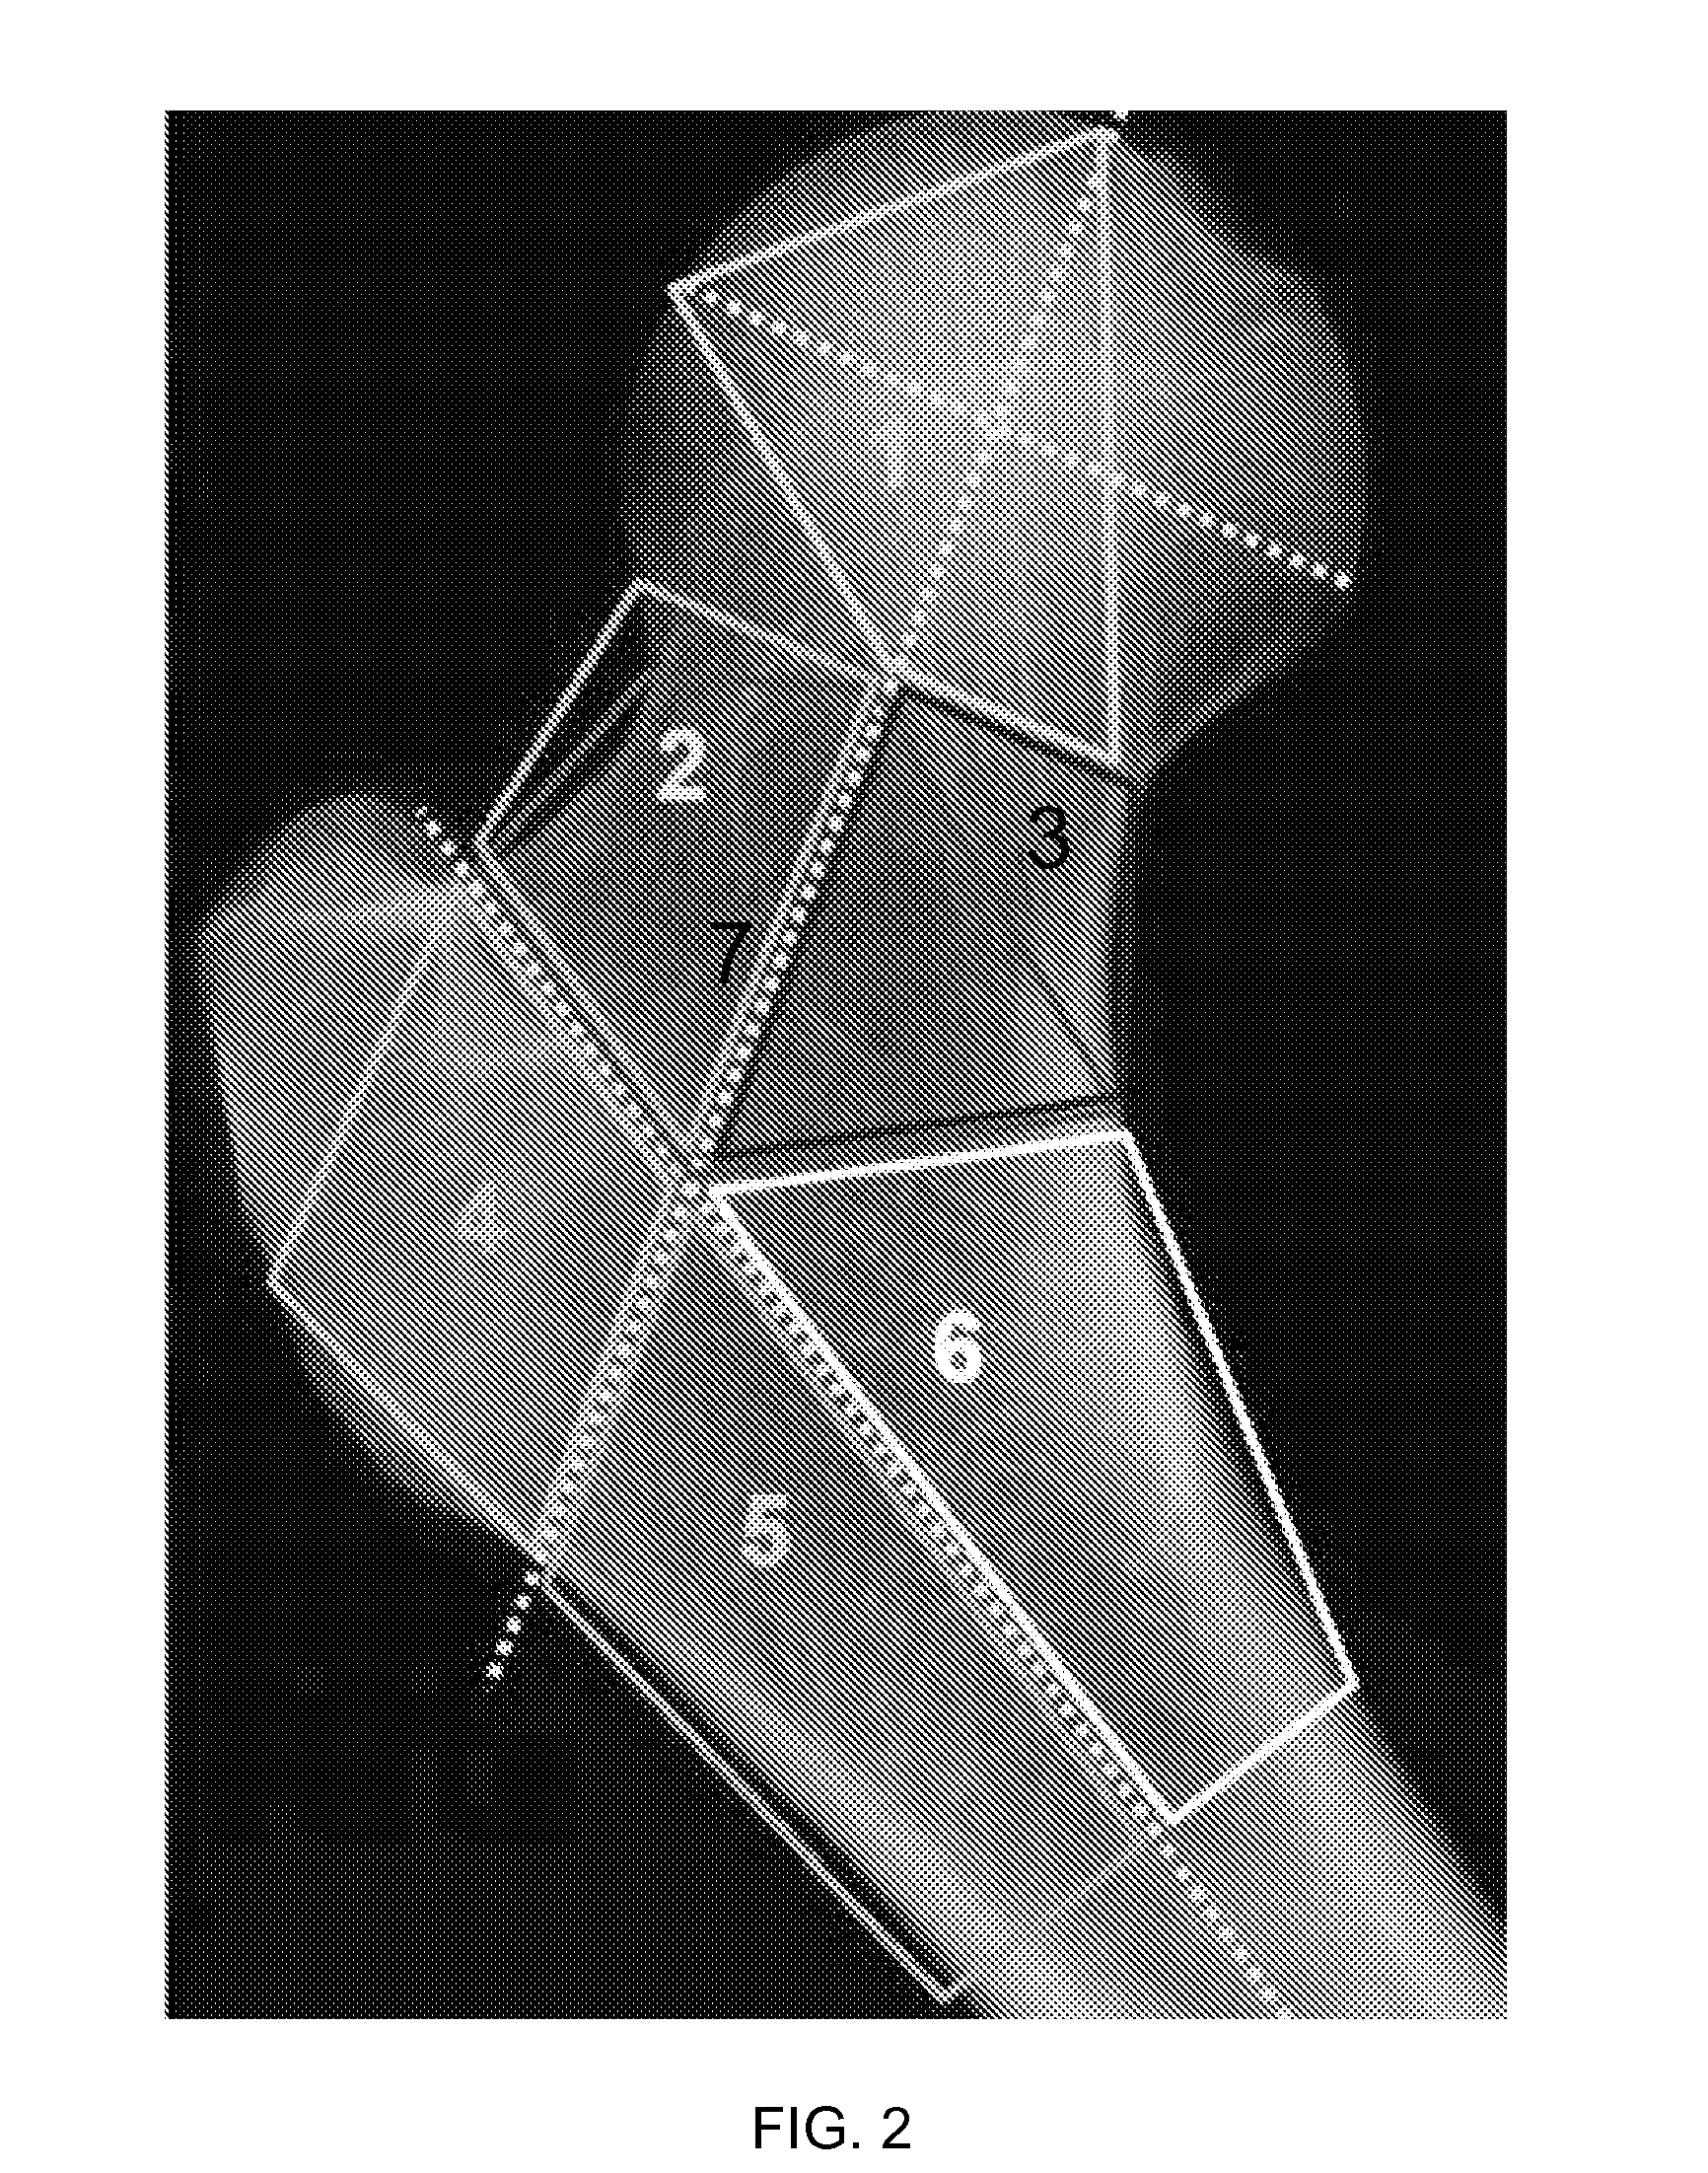
[0144]To show feasibility of the approach to better predict an individual's failure load and fracture risk, a sliding window analysis of the proximal femur in 3 cadaveric samples was also performed. Instead of using fixed ROI's as described in FIG. 2, a regular grid was laid over the proximal femur in the x-ray taken before the mechanical failure tests. A rectangular region of interest of a fixed size was placed at each grid node, and bone structure parameters were evaluated within the boundaries of the ROI at each position. This resulted in a value for each bone parameter at each grid node, which was displayed in a color-coded map of the proximal femur for each parameter.

[0145]The pre-fracture x-rays were then aligned with the post-fracture images, so that the fracture lines can be shown in the grayscale maps, as shown in FIGS. 6A to 6D. It can be seen in the samples presented in FIGS. 6A-6D that certain parameters (e.g., for Area R...


PUM


Abstract

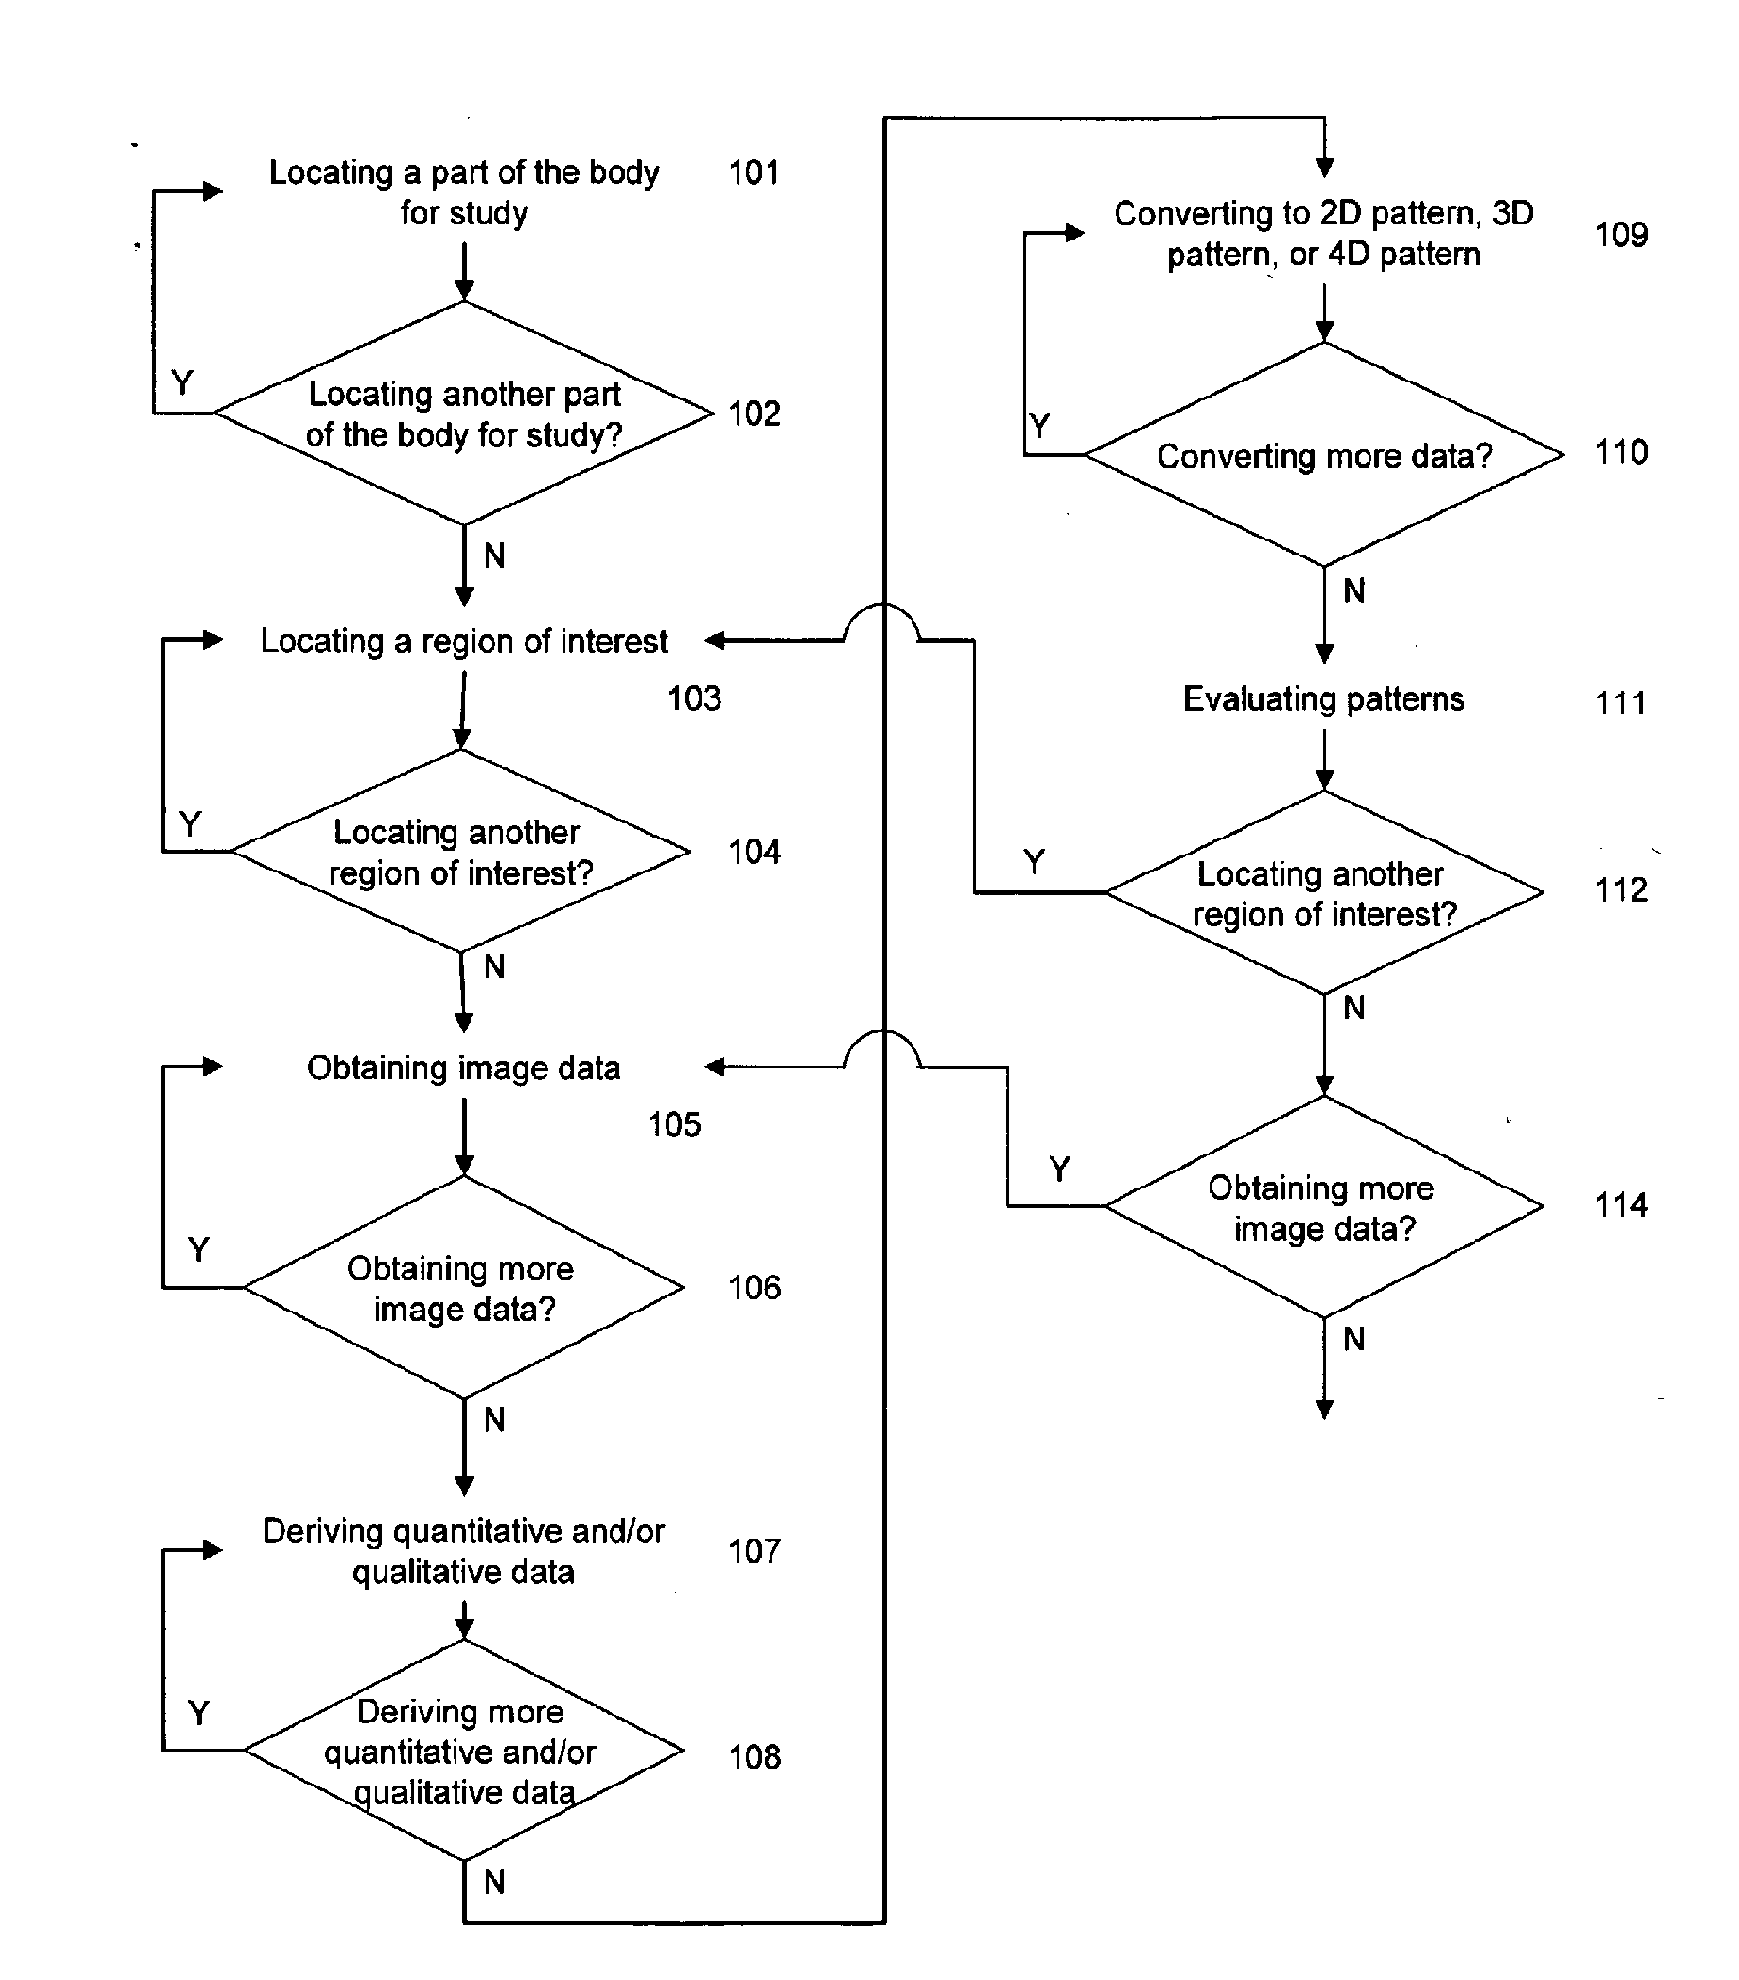
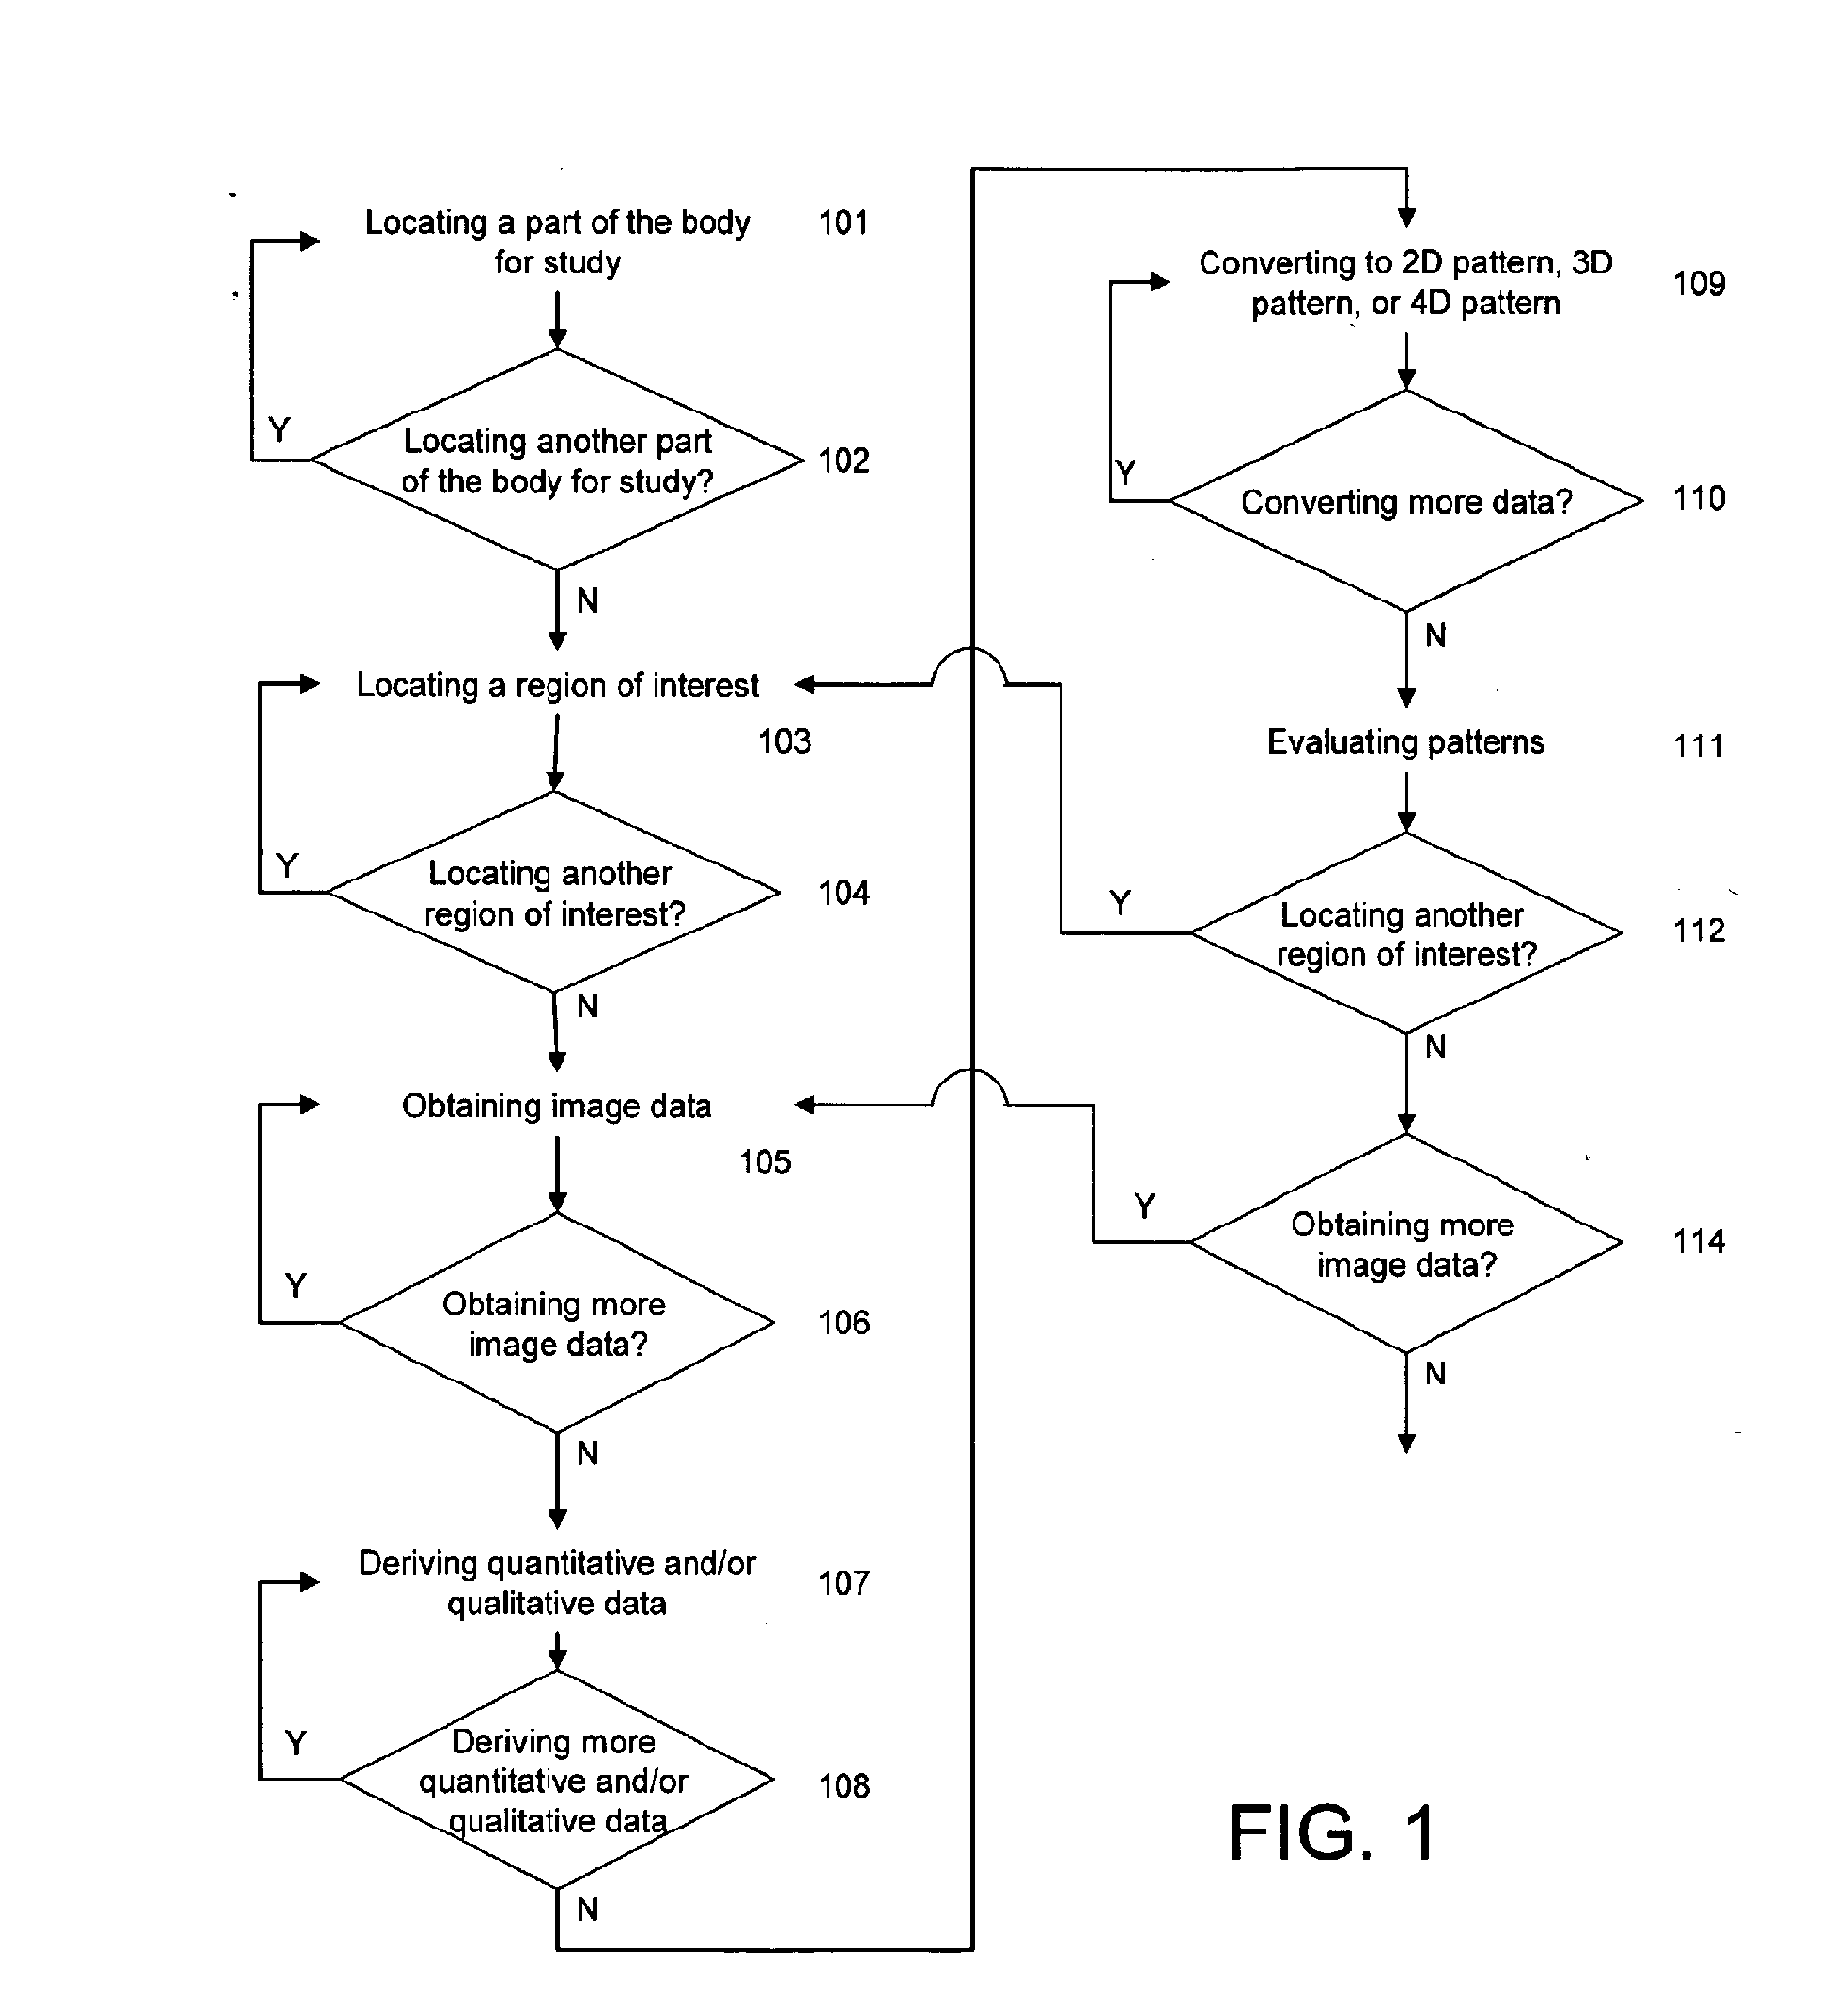
A method of predicting bone or articular disease in a subject includes determining one or more micro-structural parameters, one or more macroanatomical parameters or biomechanical parameters of a joint in the subject and combining at least two of the parameters to predict the risk of bone or articular disease.

Description

CROSS-REFERENCE TO RELATED APPLICATIONS[0001]This application claims priority to U.S. Provisional Patent Application No. 61 / 177,875 filed May 13, 2009. The present application is also a Continuation-in-Part of U.S. application Ser. No. 11 / 228,126, filed Sep. 16, 2005, which in turn claims the benefit of Provisional Application No. 60 / 610,447, filed Sep. 16, 2004. The present application is also a Continuation-in-Part of U.S. application Ser. No. 10 / 753,976, filed Jan. 7, 2004, which claims the benefit of Provisional Application No. 60 / 438,641, filed Jan. 7, 2003. U.S. application Ser. No. 10 / 753,976 is also a Continuation-in-Part of U.S. application Ser. No. 10 / 665,725, filed Sep. 16, 2003, which claims the benefit of Provisional Application No. 60 / 411,413, filed Sep. 16, 2002. The present application is also a Continuation-in-Part of U.S. application Ser. No. 10 / 665,725, filed Sep. 16, 2003, which claims the benefit of Provisional Application No. 60 / 411,413, filed Sep. 16, 2002. Ea...

Claims


Application Information

Patent Timeline
IPC IPC(8): A61B5/05G06K9/00
CPCG06T7/0012G06T2200/04G06K2209/055G06T2207/20104G06T2207/30008G06T2207/10116G06V2201/033G06T2207/10081G06T2207/10088
Inventor ARNAUD, CLAUDELIEW, SIAU-WAYSTEINES, DANIELVARGAS-VORACEK, RENE
Owner IMATX
Why Eureka
Eureka Blog
Learn More