Method, System and Computer Program Product for Non-Invasive Classification of Cardiac Rhythm
a non-invasive, cardiac rhythm technology, applied in the field of cardiac disease, can solve the problems of short-lived symptoms, difficult to distinguish, and non-common use of non-invasive devices for determining the heart rate from the pulse ra
- Summary
- Abstract
- Description
- Claims
- Application Information
AI Technical Summary
Benefits of technology
Problems solved by technology
Method used
Image
Examples
example 1
Relates to AF Detection in the MIT-BIH Databases
[0126]In these examples univariable and multivariable methods were used to classify cardiac rhythms, employing logistic regression and its variations. Segments of 50-point non-overlapping records are separated into binary outcomes with 1 denoting normal sinus rhythm or 0 denoting a cardiac arrhythmia such as atrial fibrillation. A variety of the moment and entropy rate parameters described above are estimated for each record and cardiac rhythm classifiers are developed using an optimal parsimonious subset of variables.
[0127]For purposes of this example, an optimal subset of variables for the MIT-BIH Atrial Fibrillation Database is the quadratic differential entropy rate (Q), the mean (μ), and the standard deviation (σ) of the RR intervals. The entropy rate is calculated using the SampEn algorithm with parameters m=1 and r=50 milliseconds. This result aided in the development of the coefficient of sample entropy (Q*) which is described ...
example 2
ion in 422 Consecutive Holter Monitor Recordings
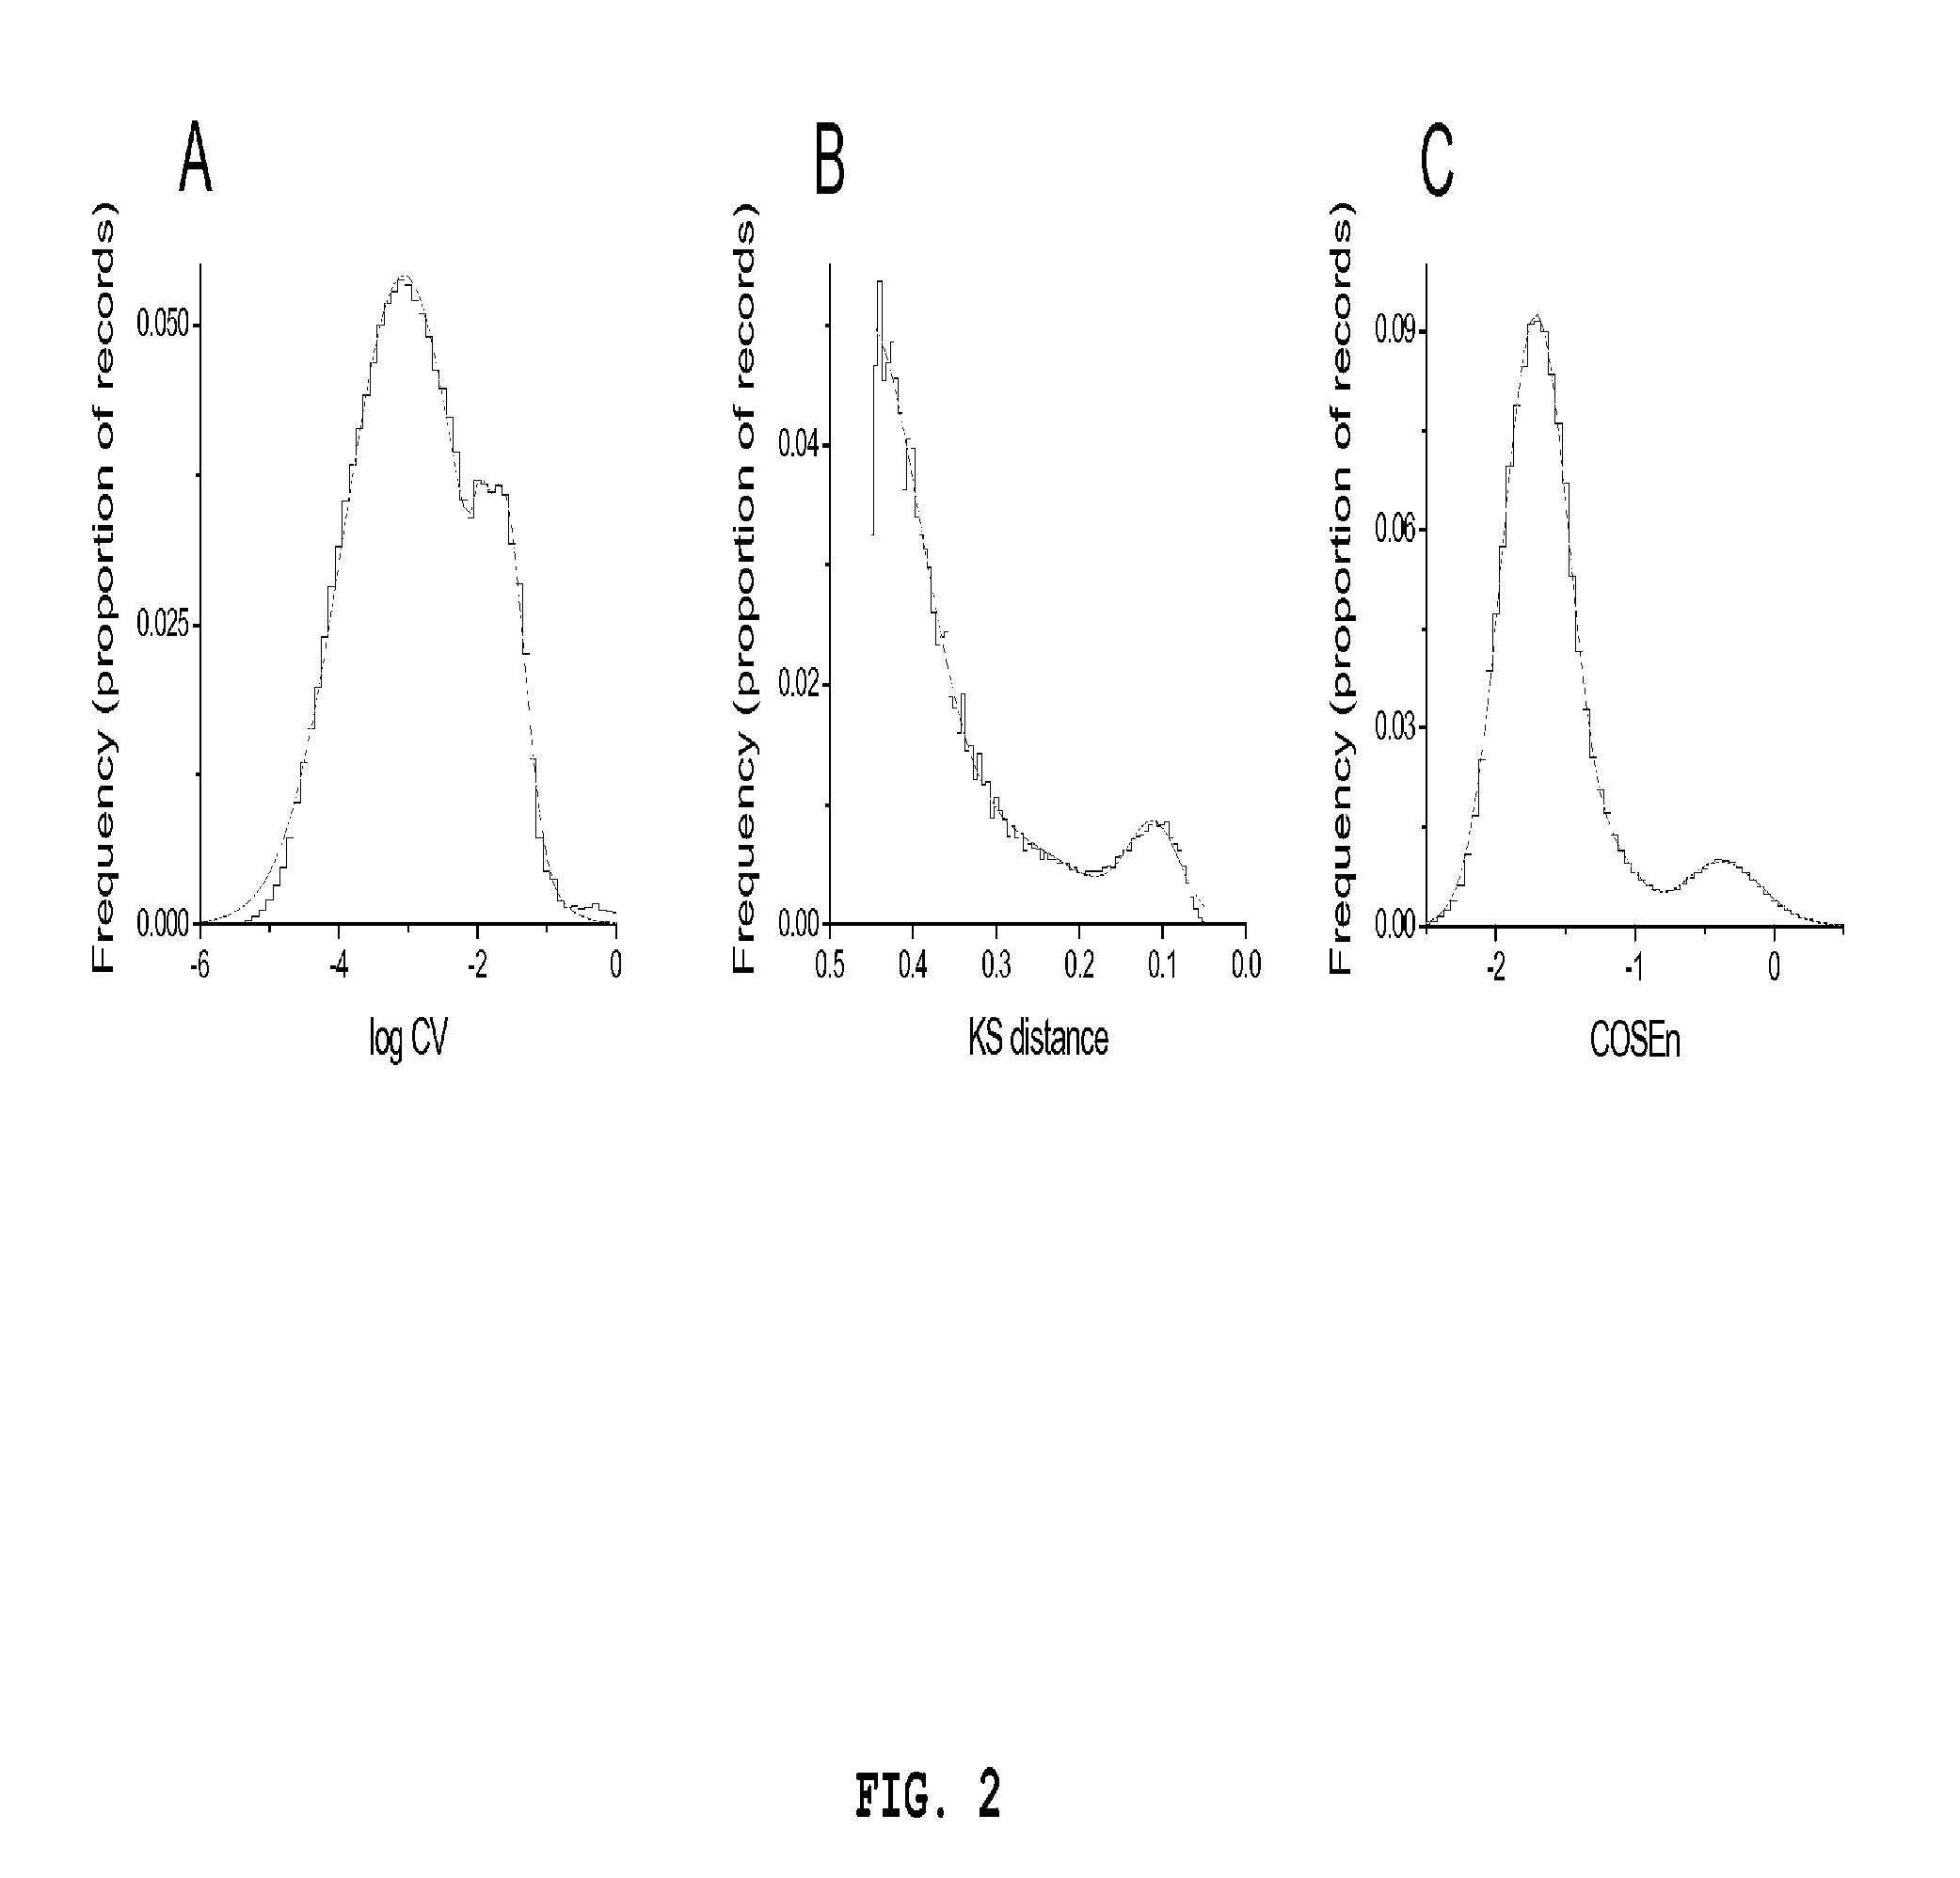
[0130]In 920, 242 50-beat records we calculated CV, KS distance (that is, we implemented the method of Tateno and Glass), and COSEn. FIG. 2 shows frequency histograms of the results, i.e., of time series measures in 422 24-hour Holter monitor records from the University of Virginia Heart Station.
[0131]The multimodal nature suggests that different components contribute to the overall distribution. We dissected the components using sums of 3 Gaussians functions, shown as smooth lines representing an expression of the form:
f(x)=A1σ12π-(x-μ1)2 / 2σ12+A2σ22π-(x-μ2)2 / 2σ22+A2σ22π-(x-μ2)2 / 2σ22,
where A is the proportion of the total area attributed to each component, and μ and σ are the mean and standard deviation of each component.
[0132]The largest component is attributed to normal sinus rhythm (NSR), and the next largest is attributed to atrial fibrillation (AF). The smallest, which always is intermediate in location, is attributed to premature...
example 3
Relates to AF Classification in 24-Hour Holter Recordings Using COSEn
[0135]FIGS. 1, 3, and 4 show three of the 24-hour Holter monitor recordings, and RR intervals are classified as NSR (blue) or AF (green) using only COSEn, which is shown as a purple line at the bottom. The cut-off of COSEn=−1 was chosen by eye from inspection of the frequency histogram of COSEn values in 420 consecutive Holter recordings. FIGS. 3 and 4 show uninterrupted NSR and AF, respectively. FIG. 1 shows a record with paroxysms of AF. There is good agreement between the COSEn value and the appearance of the time series. Note that the y-axis is RR interval, and AF is characterized by faster rates (shorter intervals) as well as increased variability.
PUM
 Abstract
Description
Claims
Application Information
 - R&D
- Intellectual Property
- Life Sciences
- Materials
- Tech Scout
- Unparalleled Data Quality
- Higher Quality Content
- 60% Fewer Hallucinations
Browse by: Latest US Patents, China's latest patents, Technical Efficacy Thesaurus, Application Domain, Technology Topic, Popular Technical Reports.
© 2025 PatSnap. All rights reserved.Legal|Privacy policy|Modern Slavery Act Transparency Statement|Sitemap|About US| Contact US: help@patsnap.com


