
Method for mapping of dispersion and other optical properties of optical waveguides

a technology of optical waveguides and optical properties, applied in the field of mapping of dispersion and other optical properties of optical waveguides, can solve the problems of reducing the sensitivity and spatial resolution of existing dispersion measurement techniques, identifying the fundamental obstacle to the construction of wideband parametric devices, and further tightening the fabrication process a difficult proposition

Active Publication Date: 2009-03-26
RGT UNIV OF CALIFORNIA
View PDF7 Cites 20 Cited by
  • Summary
  • Abstract
  • Description
  • Claims
  • Application Information

AI Technical Summary

Benefits of technology

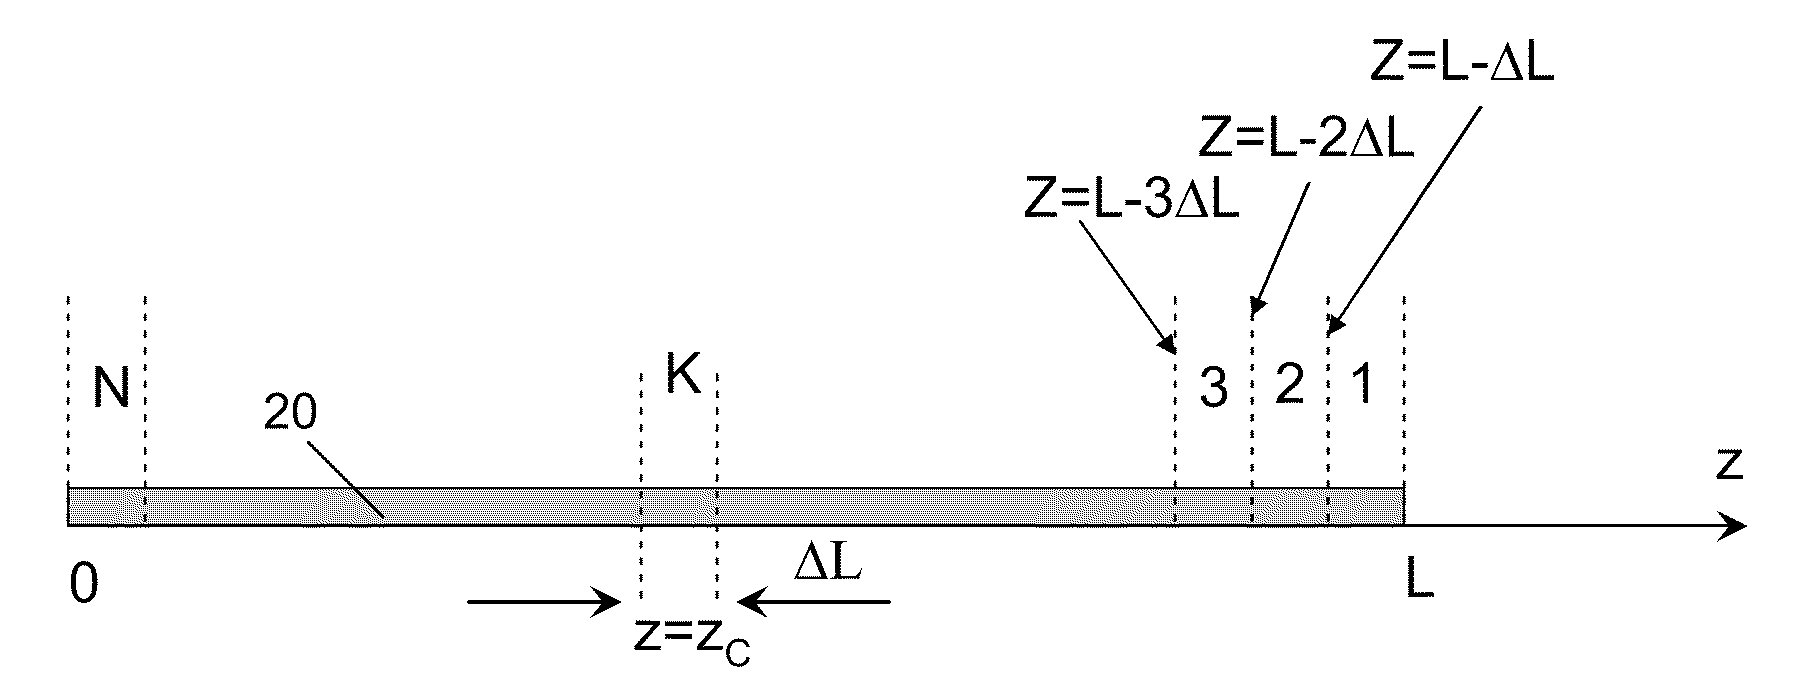
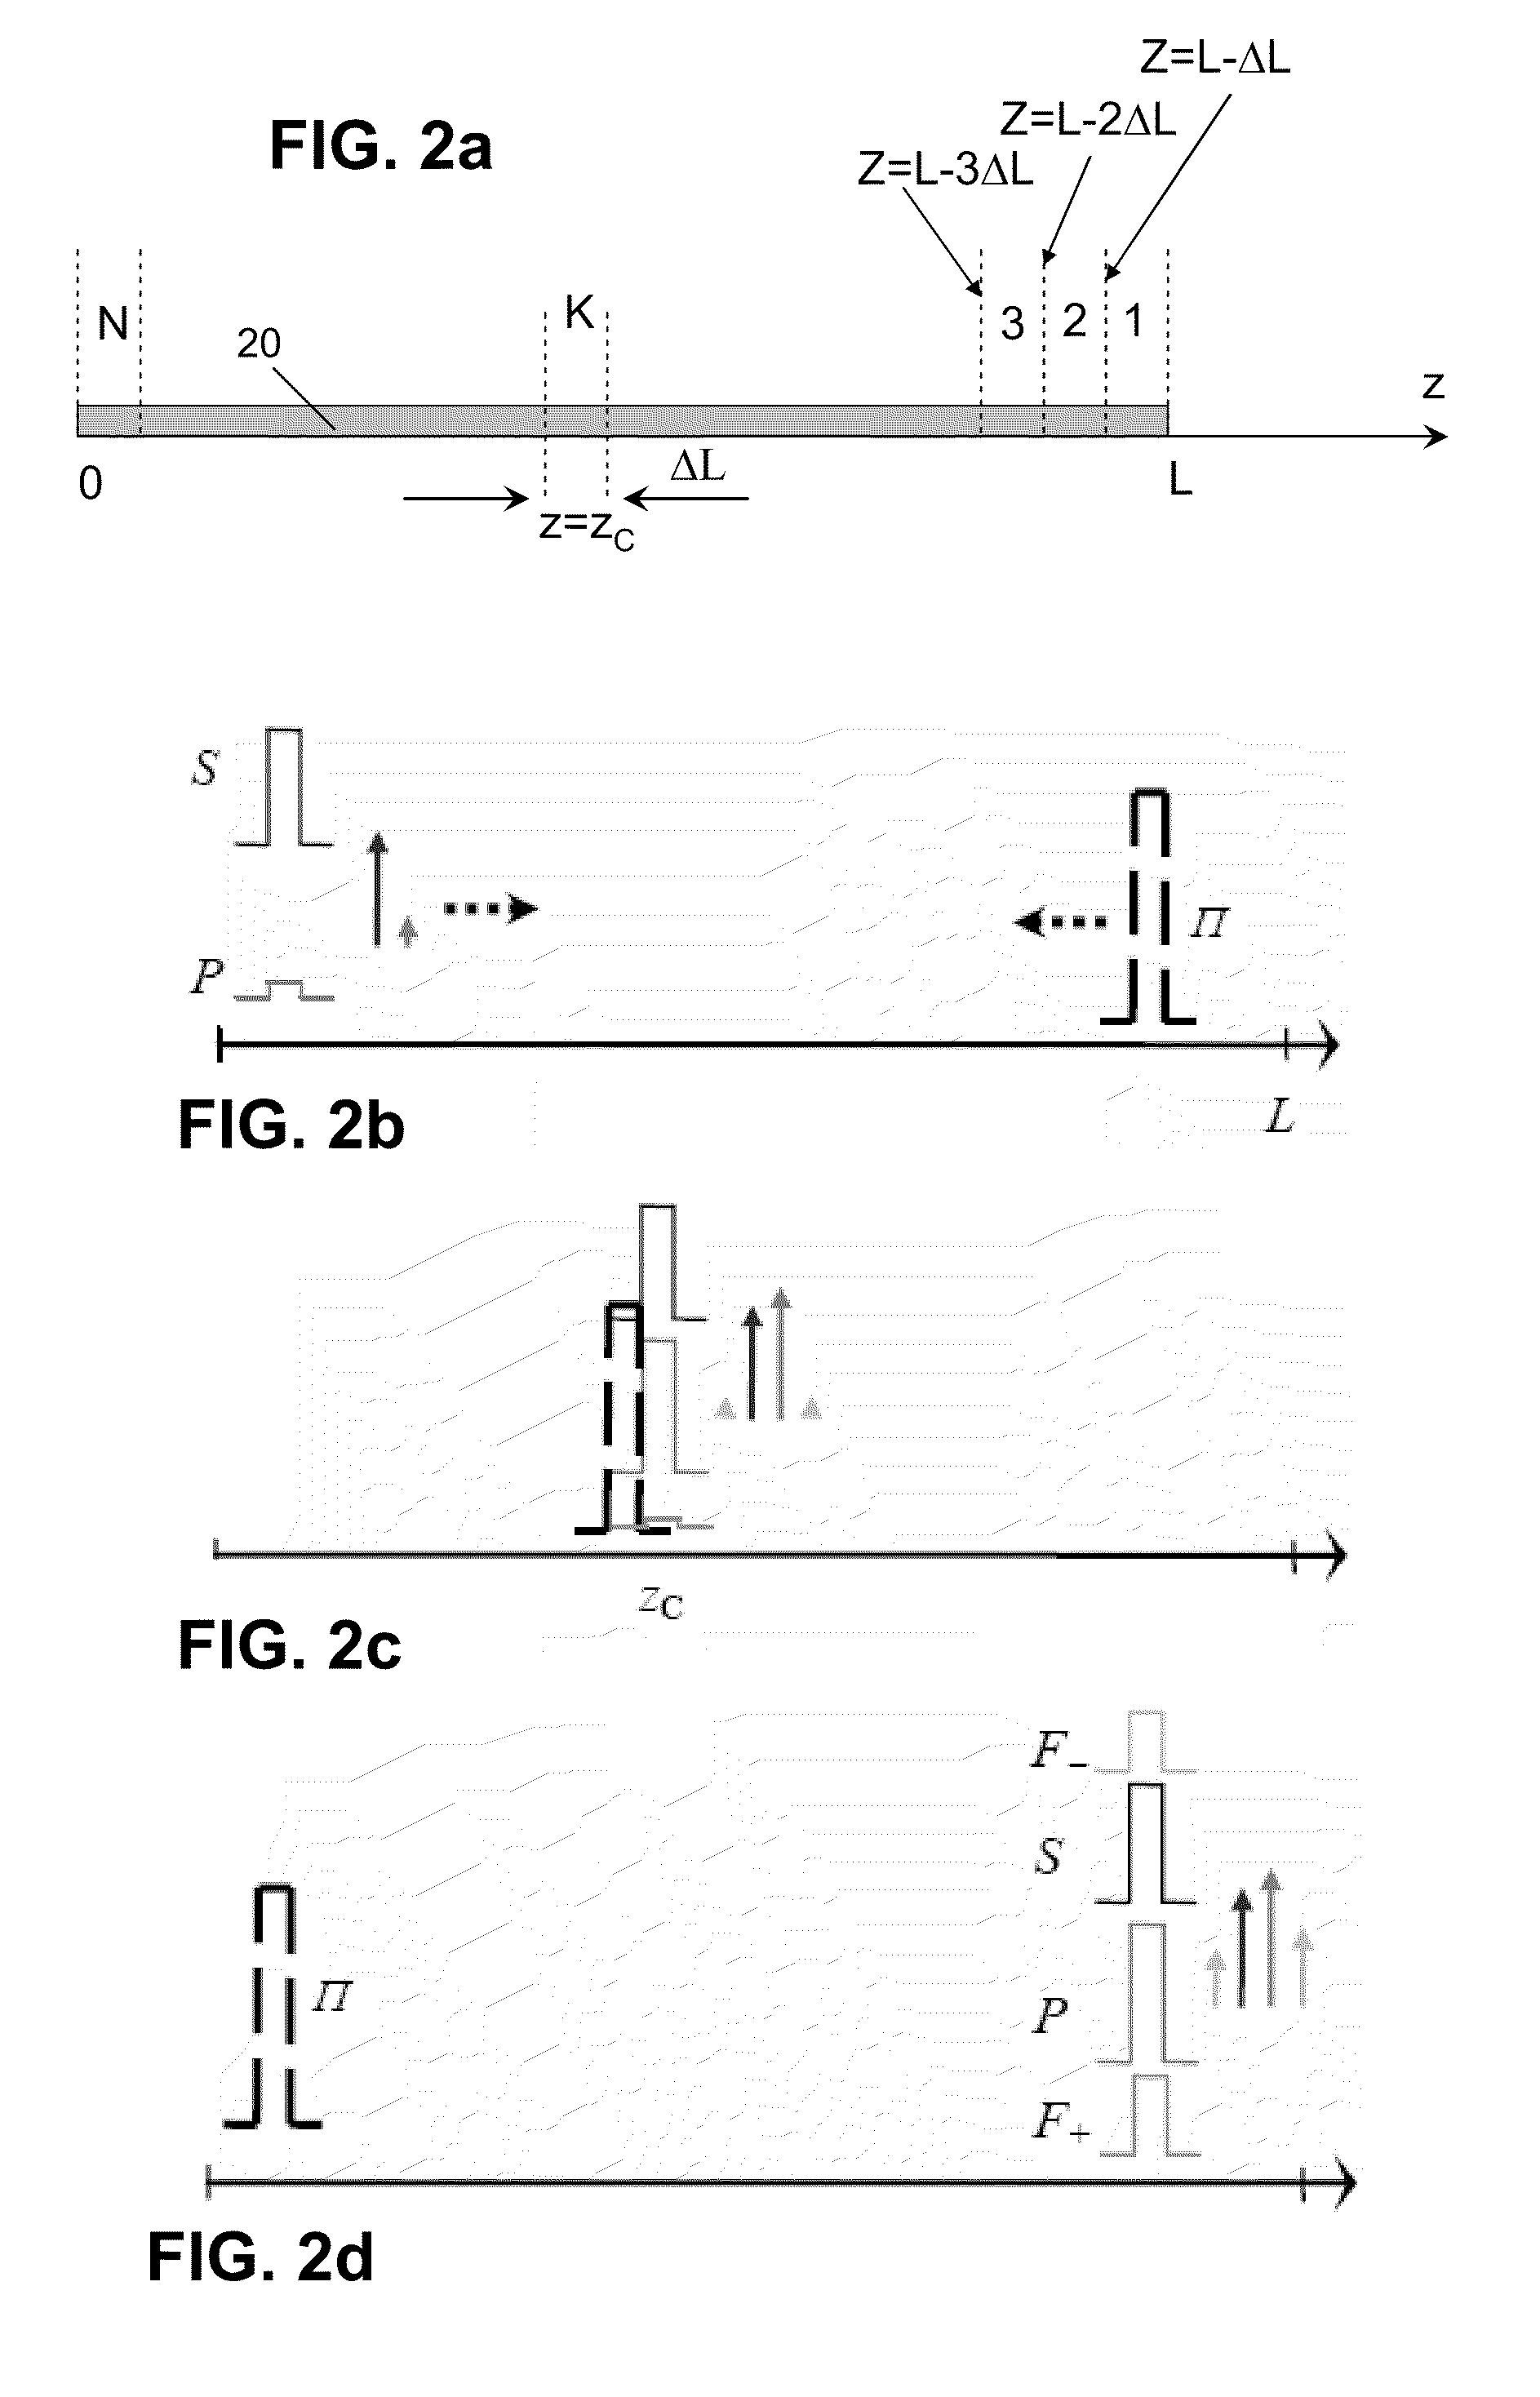
[0008]A new technique for measurement and mapping of dispersion and optical properties of fiber and optical waveguides is provided. The technique uses highly localized (in space) power transfer between counter-propagating pulses in order to create deterministic, localized characterization of the optical sample. In one embodiment, the technique can be used for a precise dispersion mapping of fiber possessing arbitrary chromatic dispersion, enabling the design of a broad class of optical devices or optical subsystems that rely on precise phase matching or dispersion map control.
[0010]In contrast to conventional dispersion mapping techniques, the new method uses counter-propagating optical interaction to deliver optical energy in highly localized fashion. The pulse duration of counter-colliding pulses precisely determines the spatial resolution of the measurement. The technique performance (accuracy, resolution) is considerably higher than that of conventional techniques, and particularly superior in low-dispersion samples, such as HNLF or dispersion shifted fiber.

Problems solved by technology

This variation has been identified as the fundamental obstacle to the construction of wideband parametric devices.
The remarkable control of the HNLF cross-sectional variances makes further tightening of the fabrication process a difficult proposition, suggesting a need for alternative means for phase matching control over long length of fiber.
Unfortunately, the magnitude of these fluctuations is well below the sensitivity and spatial resolution of existing dispersion measurement techniques.
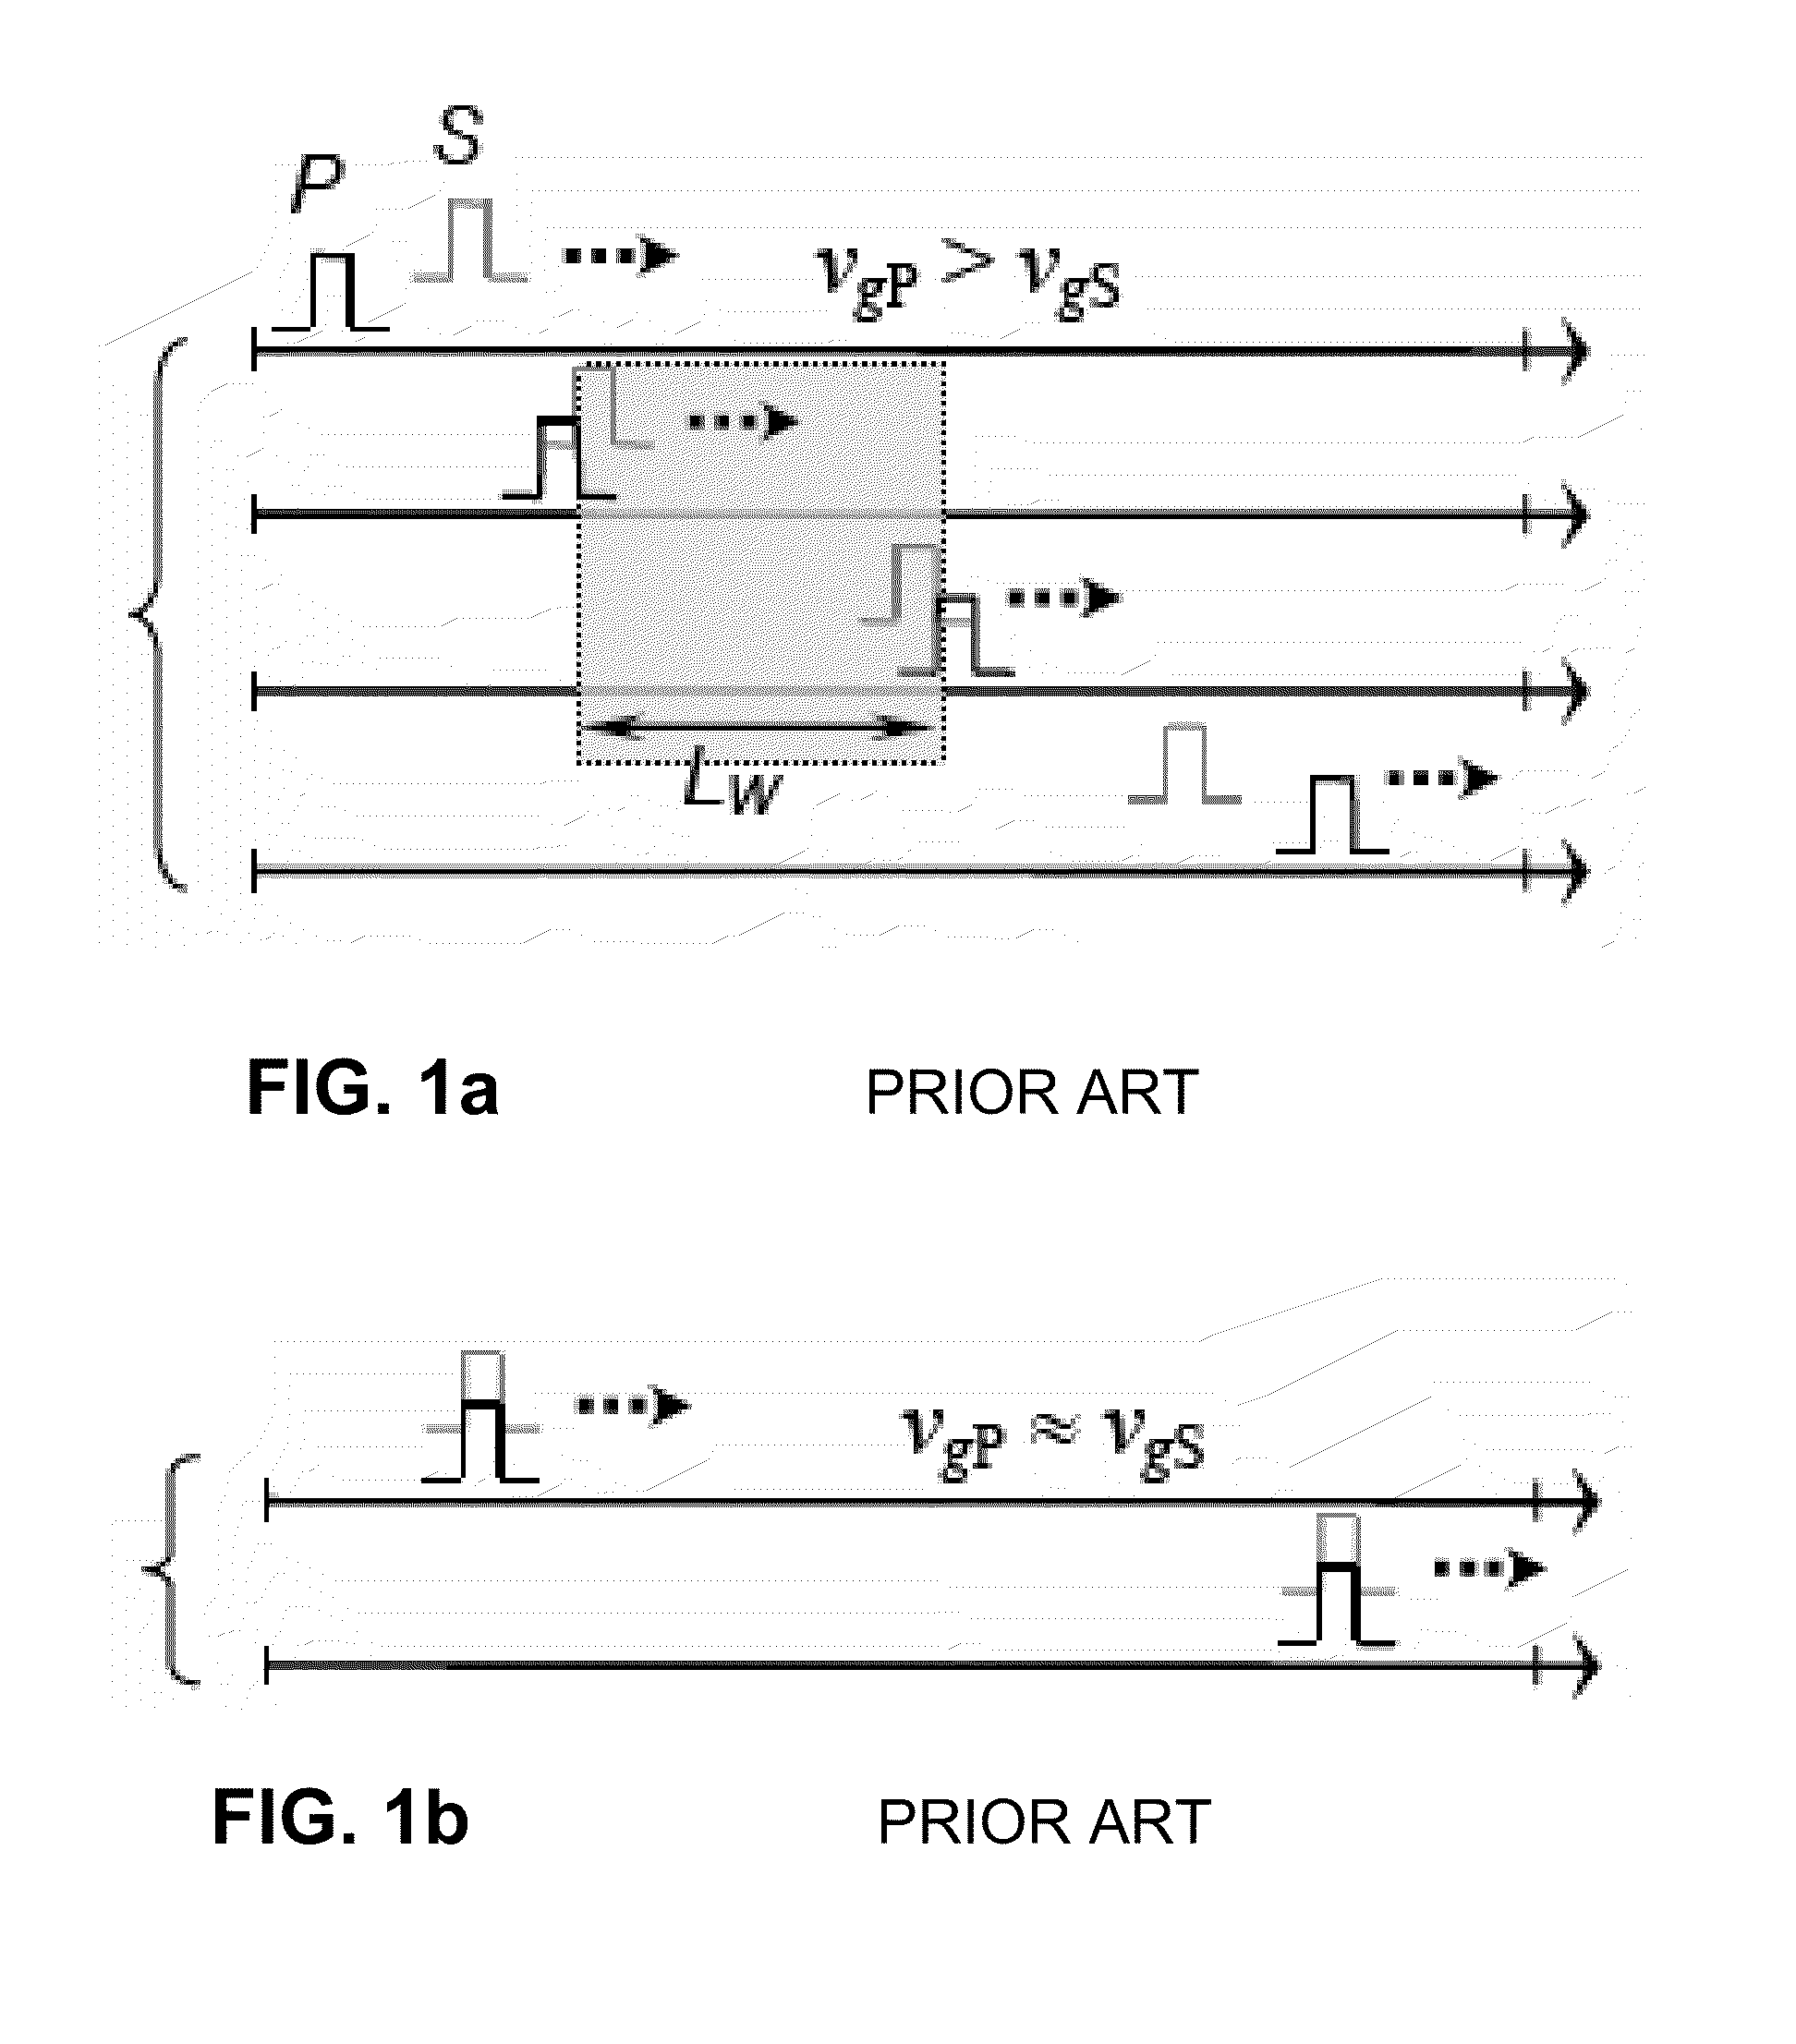
In the case of nearly dispersionless fibers, such as HNLF, the walk-off length necessarily diverges (LW˜L) and the technique fails to provide spatially resolved measurements.
While FPM generation will be maximized in the first case, it can only be used to obtain a global, rather than a spatially-localized dispersion measurement.
Such a length scale is considerably longer than a typical parametric device length (˜100 m), thus imposing a key limitation to the practical value of this technique.

Method used


Image

  • Method for mapping of dispersion and other optical properties of optical waveguides
  • Method for mapping of dispersion and other optical properties of optical waveguides
  • Method for mapping of dispersion and other optical properties of optical waveguides

Examples


example 1

[0072]The HNLF sample with mean ZDW (zero dispersion wavelength) of 1560.5 nm and deviation σλ0 less than 3 nm was scanned first in both directions by two co-propagating 10 ns pulses positioned at λ1=1558.23 nm and λ2=1530.23 nm and a counter-propagating 10 ns pump. FIGS. 18a and b illustrate the measured and converged (calculated) power profiles obtained by the algorithm, both relative to the collision position (zC), for the backward and forward scans, respectively. FIG. 18c provides a diagram of the general mathematical formulation used to determine dispersion. Although similar pulse powers were used in both directions, the measured power profiles are highly asymmetric with respect to the fiber directionality.

[0073]Periods of the oscillation of the Stokes sideband (100 vs. 50 m) are noticeably different, indicating that the ZDW of the last fiber section is closer to the probe wavelength λ1. The averaged Stokes product mean-squared deviation between the measured and calculated valu...

example 2

[0076]A modification of the experimental set-up was made before scanning a second fiber sample. The optical amplifier used to amplify the signal pulse was replaced by a custom-designed three-stage pre-amplifier to improve the measurement dynamic range. The modifications allowed the decrease in SBS gain to a lower value (<15 dB), while maintaining the measurement sensitivity. The power of the pump pulse remained constant during the propagation and the collision gain was more equalized along the fiber. The new configuration also allowed the powers of the probe and the signal pulse to be equalized and to eliminate the non-linear phase mismatch defined by Equation (9).

[0077]FIG. 21 illustrates the power profiles measured in both directions for a 175 m fiber sample with average SBS gain of only 12 dB (0>=1562 nm; Sλ=0.25 ps / nm2 / km). In this case, the period of spatial FPM oscillation differed by approximately 10 nm. The dispersion profiles were calculated using 13 harmonic-decomposition....


PUM


Abstract

A method is provided for measurement of dispersion or other optical and mechanical properties within a waveguide by inducing four-photon mixing at different locations within the waveguide by timing a pump signal to counter-collide with and abruptly amplify or attenuate one or both of a probe pulse and a signal pulse at each location. The measurement of the components of the resulting mixing signal created by each collision is used to calculate dispersion defined by the location at which the collision occurred. By combining the measurements from all of the locations, a spatial map of dispersion or other optical or mechanical properties within the waveguide can be generated.

Description

RELATED APPLICATIONS [0001]This application claims the priority of U.S. Provisional Application No. 60 / 973,765, filed Sep. 20, 2007, which is incorporated herein by reference in its entirety.BACKGROUND OF THE INVENTION [0002]The introduction of highly nonlinear fibers (HNLF) has revolutionized optical parametric processing, allowing for the first time the construction of true continuous-wave (CW), high efficiency devices. In contrast to centimeter-long crystalline devices, phase-matched interaction in HNLF can take place over hundreds of meters and have efficiencies exceeding 40 dB. Similar to conventional fiber, microscopic variation in HNLF transverse geometry can lead to spatially-localized dispersion fluctuations. As a result, the phase matching condition varies along the length of the fiber. This variation has been identified as the fundamental obstacle to the construction of wideband parametric devices.[0003]Recent fabrication advances have reduced transverse HNLF variations t...

Claims


Application Information

Patent Timeline
IPC IPC(8): G01N21/00
CPCG01M11/319G01M11/39G01M11/338
Inventor RADIC, STOJAN
Owner RGT UNIV OF CALIFORNIA
Learn More