Optimal Scenario Forecasting, Risk Sharing, and Risk Trading

a risk trading and optimal scenario technology, applied in the field of statistical analysis and risk sharing, can solve the problems of inability to accurately determine coefficients, ever-larger empirical data sets, errors and distortions, etc., and achieve the effect of accurately portraying future probabilities

Inactive Publication Date: 2008-01-31
JAMESON JOEL
View PDF8 Cites 14 Cited by
  • Summary
  • Abstract
  • Description
  • Claims
  • Application Information

AI Technical Summary

Problems solved by technology

If the Equation is not correctly specified, then errors and distortions occur can occur.
As the number of explanatory variates increases, the number of possible functional forms for Equation 1.0 increases exponentially, ever-larger empirical data sets are needed, and accurately determining coefficients can become impossible.
As a result, one is frequently forced to use only first-order linear fmc functional forms, but at a cost of ignoring possibly important non-linear relationships.
Though prima facie minimizing deviations makes sense, the deviations in themselves are not necessarily correlated nor linked with the costs and benefits of using a properly or improperly fitted curve.
As a consequence, most statistical techniques, to some degree, are plagued by the above five MCFPs.
A result that is statistically significant can be practically insignificant.
Further, for the normal distribution assumption to be applicable, frequently large—and thus costly—sample sizes are required.
But such refinement has a cost: loss of information.
One problem that becomes immediately apparent by a consideration of FIG. 2 is the lack of unification.
A particular problem, moreover, with regression analysis is the assumption that explanatory variates are known with certainty.
Another problem with Regression Analysis is deciding between different formulations of Equation 1.0: accuracy in both estimated coefficients and significance tests requires that Equation 1.0 be correct.
An integral-calculus version of the G2 Formula (explained below) is sometimes used to select the best fitting formulation of Equation 1.0 (a.k.a. the model selection problem), but does so at a cost of undermining the legitimacy of the significance tests.
However, such techniques fail to represent all the lost information.
However, the resulting statistical significances are of questionable validity.
Further, Logit requires a questionable variate transform, which can result in inaccurate estimates when probabilities are particularly extreme.
Analysis-of-Variance (and variates such as Analysis-of-Covariance) is plagued by many of the problems mentioned above.
The first issue is significance testing.
The main problem with using both Chi Square and G2 for significance testing is that both require sizeable cell counts.
The first major problem with the IPFP is its requirement for both computer memory (storage) and CPU time.
However, their techniques become increasingly cumbersome and less worthwhile as the number of dimensions increases.
These strategies, however, are predicated upon finding redundant, isolated, and independent dimensions.
As the number of dimensions increases, this becomes increasingly difficult and unlikely.
Besides memory and CPU requirements, another major problem with the IPFP is that specified target marginals (tarProp) and cell counts must be jointly consistent, because otherwise, the IPFP will fail to converge.
The final problem with the IPFP is that it does not suggest which variates or dimensions to use for weighting.
In conclusion, though some strategies have been developed to improve the IPFP, requirements for computer memory, CPU time, and internal consistency are major limitations.
There are two major weaknesses with this approach: 1.
Computation of posterior distributions based upon prior distributions and new data can quickly become mathematically and computationally intractable, if not impossible.
There are two problems with this approach.
First it is very sensitive to training data.
Second, once a network has been trained, its logic is incomprehensible.
Unable to handle incomplete xCS data when performing a classification.
Lack of a statistical test.
Lack of an aggregate valuation of explaintory variates.
Massive updating of the database is likely very expensive but so are inaccurate estimates of yCS.
Because they may impose structure and relationships between linked variates, the relationship between two distantly linked variates may be distorted by errors that accumulate over the distance.
In other words, using two fitted curves in succession: one curve that models the relationship between xCS and qCS, and another that models the relationship between qCS and yCS, is far less accurate than using a fitted-curve that models the relationship between xCS and yCS directly.
Because of the physical 3-D limitations of the world, Graphic models have severe limitations on how much they can show: Frequently, each node / variate is allowed only two states, and there are serious limitations on showing all possible nodal connections.
Because they employ the above statistical and mathematical curve fitting techniques, they suffer from the deficiencies of those techniques.
Because expert systems employ the above techniques, they too suffer from the deficiencies of those techniques.
More importantly, however, is the high cost and extensive professional effort required to build and update an expert system.
However, much of the time, using such data is not done because of conceptual and practical difficulties.
One could use the above techniques to create sample / scenario data, but the resulting data can be inaccurate, primarily from loss of information, MCFP #3.
Such a loss of information undermines the very purpose of both computer simulations and computerized-scenario optimizations: addressing the multitude of possibilities that could occur.
However, each financial instrument is a bundle of risks that cannot be traded.
Arguably, the risks associated with most assets in the world cannot be traded.
Such negotiations and agreements can be difficult.
Each farmer will make and execute their own decisions but be forced to live the by the complete consequences of these decisions since, given present-day technology, they lack a means of risk sharing.
They further have problems with granularity, necessitating complex multiple trades.
These means of trading risk entail a “winner-take-all” orientation, with the result that traders are unable to fully maximize their individual utilities.
All-in-all, trading risk is a complex endeavor, in itself has risk, and can be done only on a limited basis.
As a result of this, coupled with people's natural risk-aversion, the economy does not function as well as it might.
Perhaps this is the result of a gap between humans and mathematical optimization: the insights of humans cannot be readily communicated as input to a mathematical optimization process.
The one problem, of course, is the Agency Theory problem as defined by economic theory: Forecasters are apt to make forecasts that are in their private interest and not necessarily in the interests of those who rely on the forecast.
Within medicine, treatment approval by the FDA is a long and arduous process, and even so, sometimes once a treatment is approved and widely used, previously unknown side-effects appear.
The net result is ever more uncertainty and confusion regarding treatments.
In conclusion, though innumerable methods have been developed to quantitatively identify correlative relationships and trade risk, they all have deficiencies.

Method used


Image

  • Optimal Scenario Forecasting, Risk Sharing, and Risk Trading
  • Optimal Scenario Forecasting, Risk Sharing, and Risk Trading
  • Optimal Scenario Forecasting, Risk Sharing, and Risk Trading

Examples


embodiment

IV. Embodiment

[0294] IV.A. Bin Analysis Data Structures [0295] IV.B. Bin Analysis Steps [0296] IV.B.1. Load Raw Data into Foundational Table [0297] IV.B.2. Trend / Detrend Data [0298] IV.B.3. Load BinTabs [0299] IV.B.4. Use Explanatory-Tracker to Identify Explanatory Variates [0300] IV.B.4.a Basic-Explanatory-Tracker [0301] IV.B.4.b Simple Correlations [0302] IV.B.4.c Hyper-Explanatory-Tracker [0303] IV.B.5. Do Weighting [0304] IV.B.6. Shift / Change Data [0305] IV.B.7. Generate Scenarios [0306] IV.B.8. Calculate Nearest-Neighbor Probabilities [0307] IV.B.9. Perform Forecaster-Performance Evaluation [0308] IV.B .10. Multiple Simultaneous Forecasters [0309] IV.C. Risk Sharing and Trading [0310] IV.C.1. Data Structures [0311] IV.C.2. Market Place Pit (MPPit) Operation [0312] IV.C.3. Trader Interaction with Risk-Exchange and MPTrader [0313] IV.D. Conclusion, Ramifications, and Scope

[0314] I. Expository Conventions

[0315] An Object Oriented Programming orientation is used here. Pseudo-code...

example # 1

EXAMPLE #1

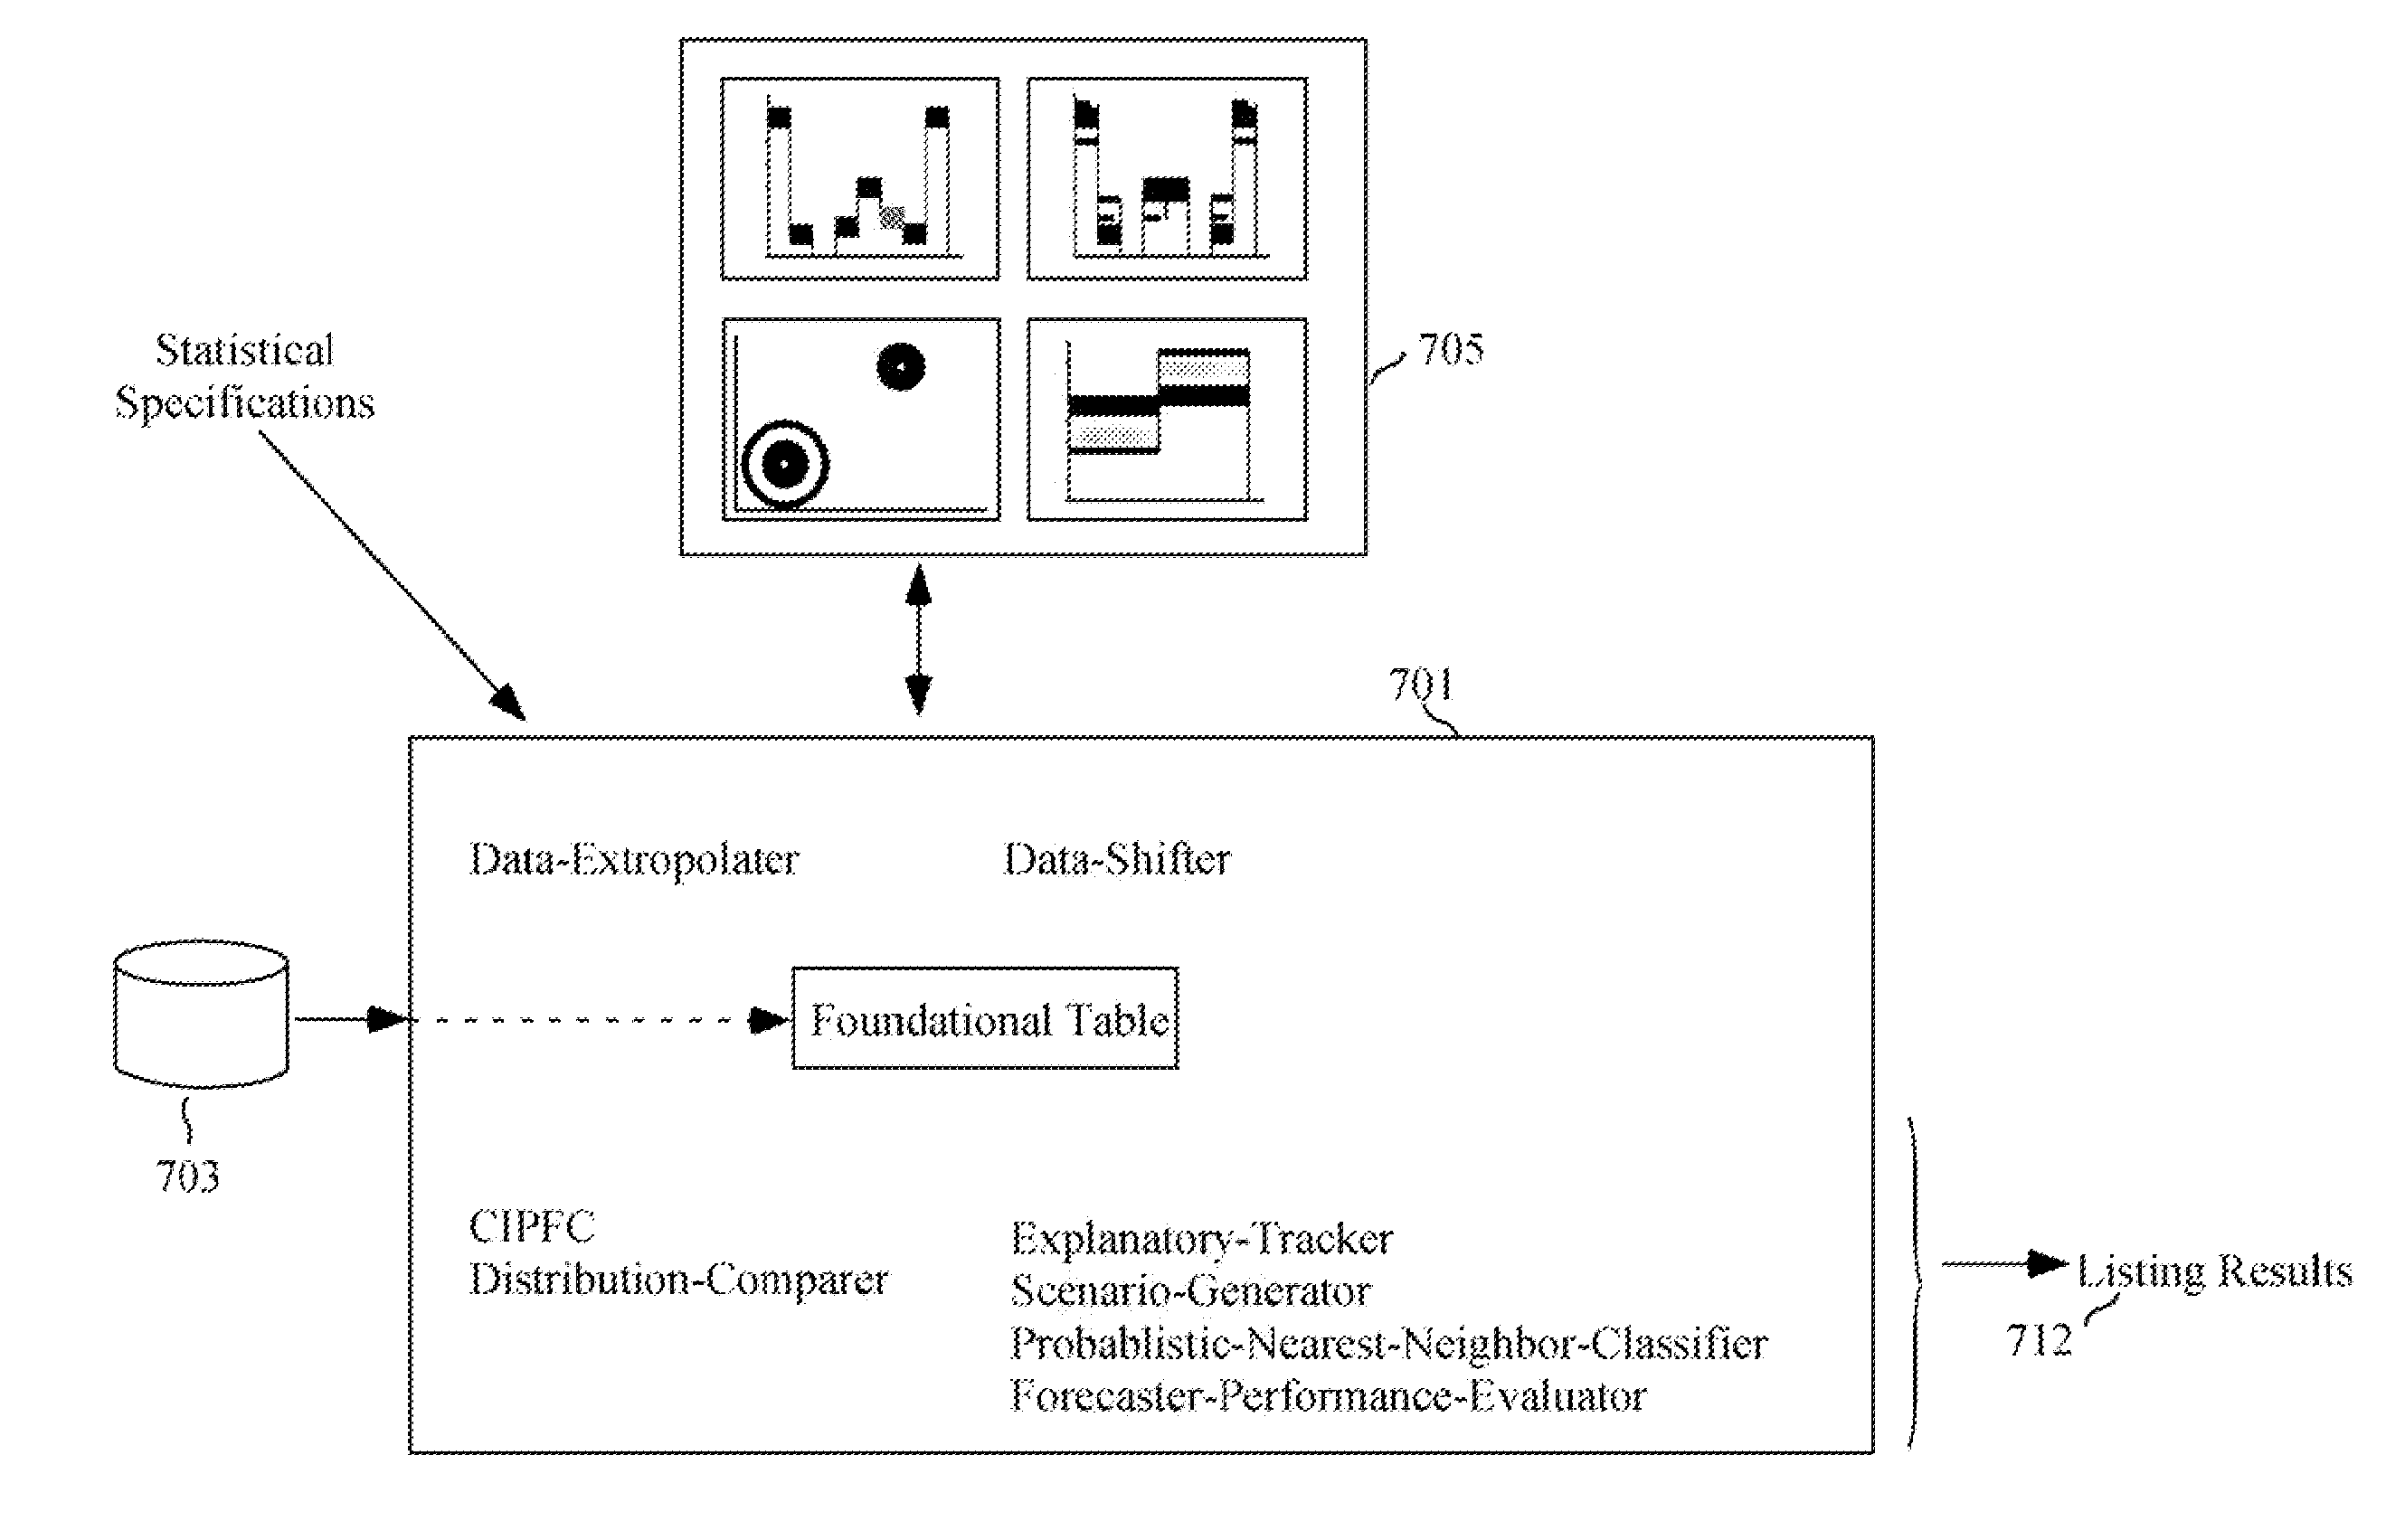
[0964] Medical records of many people are loaded into the Foundational Table as shown in FIG. 57. These records are updated and columns created as more information becomes available, as are the BinTabs and DMBs.

[0965] During a consultation with a patient, a medical doctor estimates EFDs that regard the patient's condition and situation, which are used to weight the Foundational Tables rows. The CIPFC determines row weights. The doctor then views the resulting distributions of interest to obtain a better understanding of the patient's condition. The doctor triggers a Probabilistic-Nearest-Neighbor search to obtain a probabilistic scenario set representing likely effects of a possible drug. Given the scenario probabilities, the doctor and patient decide to try the drug. During the next visit, the doctor examines the patient and enters results into the Foundational Table for other doctors / patients to use.

[0966] A medical researcher triggers Explanatory-Tracker to identify v...

example # 2

EXAMPLE #2

[0967] The trading department of an international bank employs the present invention. The Foundational Table of FIG. 57 contains transaction, in particular pricing, data regarding currencies, government bonds, etc. Data-Extrapolator projects bond prices using Rails in order to meet certain necessary conditions.

[0968] Employee-speculators (commonly called traders, and corresponding to the Forecasters and Traders generally referenced in through-out this specification) enter EFDs. The CIPFC determines Foundational Table row weights. Scenarios are generated and inputted into Patents '649 and '577. Patents '649 and '577 optimizes positions / investments. Trades are made to yield an optimal portfolio. Employee-speculators are paid according to Equation 3.0.


PUM


Abstract

An integrated and unified method of statistical-like analysis, scenario forecasting, risking sharing, and risk trading is presented. Variates explanatory of response variates are identified in terms of the “value of the knowing.” Such a value can be direct economic value. Probabilistic scenarios are generated by multi-dimensionally weighting a dataset. Weights are specified using Exogenous-Forecasted Distributions (EFDs). Weighting is done by a highly improved Iterative Proportional Fitting Procedure (IPFP) that exponentially reduces computer storage and calculations requirements. A probabilistic nearest neighbor procedure is provided to yield fine-grain pinpoint scenarios. A method to evaluate forecasters is presented; this method addresses game-theory issues. All of this leads to the final component: a new method of sharing and trading risk, which both directly integrates with the above and yields contingent risk-contracts that better serve all parties.

Description

CROSS REFERENCE TO RELATED APPLICATIONS [0001] The present application is a continuation application of U.S. patent Ser. No. 10 / 696,100 filed Oct. 29, 2003, which claims the benefit of Provisional Patent Application, Optimal Scenario Forecasting, Ser. No. 60 / 415,306 filed on Sep. 30, 2002, Provisional Patent Application, Optimal Scenario Forecasting, Ser. No. 60 / 429,175 filed on Nov. 25, 2002, and Provisional Patent Application, Optimal Scenario Forecasting, Risk Sharing, and Risk Trading, Ser. No. 60 / 514,637 filed on Oct. 27, 2003. [0002] The present application further incorporates by reference, issued U.S. Pat. No. 6,032,123, Method and Apparatus for Allocating, Costing, and Pricing Organizational Resources, which is termed herein as Patent '123. [0003] The present application further incorporates by reference, issued U.S. Pat. Nos. 6,219,649 and 6,625,577, Method and Apparatus for Allocating Resources in the Presence of Uncertainty, which is termed here as Patents '649 and '577....

Claims


Application Information

Patent Timeline
Patent Type & Authority Applications(United States)
IPC IPC(8): G06Q10/00G06F17/10G06Q99/00G06Q10/06G06Q40/08
CPCG06Q10/063G06Q40/08G06Q10/06393G06Q10/0635
Inventor JAMESON, JOEL
Owner JAMESON JOEL
Why Eureka
Try Eureka