Because of the dynamic site conditions, information is frequently out of date, incomplete, inaccurate, or unavailable when needed.
However, these tools do not use a common language to communicate among the
project team members and require special knowledge on the part of the user to interpret the data.
Suhanic (2001) states that inadequate control of a project is derived from a lack of systematic analysis of information gathered on a
common base.
The discovery of this commonality is the principal challenge of this research.
However, it is dependent on the current visual status and doesn't reveal the
impact of current circumstances on construction activity going forward.
Nor do they capture the necessary interrelated information and their interdependencies in a legible manner for efficient
project control.
Such discrete and massive reports are produced throughout the life of a project and do not explicitly convey level of performance, problems, their causes, or their
impact associated with physical construction situation.
Consequently, the
project manager needs vast amounts of time and effort to sort through, prioritize, and interpret these data.
Measuring progress by comparing remaining inventory of material to the actual amount of material that has been used during construction can result in serious error.
Thus, the measurement lacks objectivity and is ineffective at presenting progress due to its abstract nature (See, Table 1).
Thus, they can not be considered as a control tools.
The functions and user interfaces of these systems do not distinguish between planning and control or the needs and disciplines of the users.
However, due to its complexity and function-oriented interface, in practice it is rarely used for anything other than scheduling by professional schedulers.
Although it offers scheduling, cost, resource, contingency
management functions as well as reporting and communication functions, it is an aggregate of many different systems into one
package rather than one system having many functions, and thus may lack full integration among the multiple functions.
However, without data collection or a comparison of planned and actual performance, there would be no basis for control decisions.
It is not easy for project managers to manage vast amounts of
raw data from many disciplines in a complex and dynamic situation without a
computer management system.
Currently, there is no appropriate system that can effectively collect and compile such
raw data and comprehensively and systematically deliver it to the
project manager.
Partial communication and document management can be performed using a web-based project
extranet, but as yet, there is no way to integrate large quantities of data produced in diverse formats.
Even though raw information can be collected from the job site, if the necessary information cannot be identified at the right time, the time period within which to control critical issues may be compromised.
Cost increases and time losses could be incurred due to management's failure to notice potential problems.
It is important to monitor their progress regularly, but the
project manager reviewing the vast amount of information constantly produced, and then making control decisions for variance or conflicts is both impossible and inefficient.
Project managers are overwhelmed with excessive detail (e.g., CPM chart), which requires a lot of effort and time to analyze, or alternatively, important issues are minimized with over simplified data (e.g., Earned value chart) which are unable to give full explanations on the cause and
impact of variances.
Currently, however, there is no way of integrating and connecting updated data from many parties.
The problem is that the authority to control a project is fragmented.
Decisions are rarely made by an individual entity because most issues that arise during construction are related to and have an effect on many disciplines.
In practice, the difficulty lies in achieving control of a project as a whole when decisions on objectives, financing, planning, design and construction are divided among the owner, engineers, architects, contractors and sub-contractors.
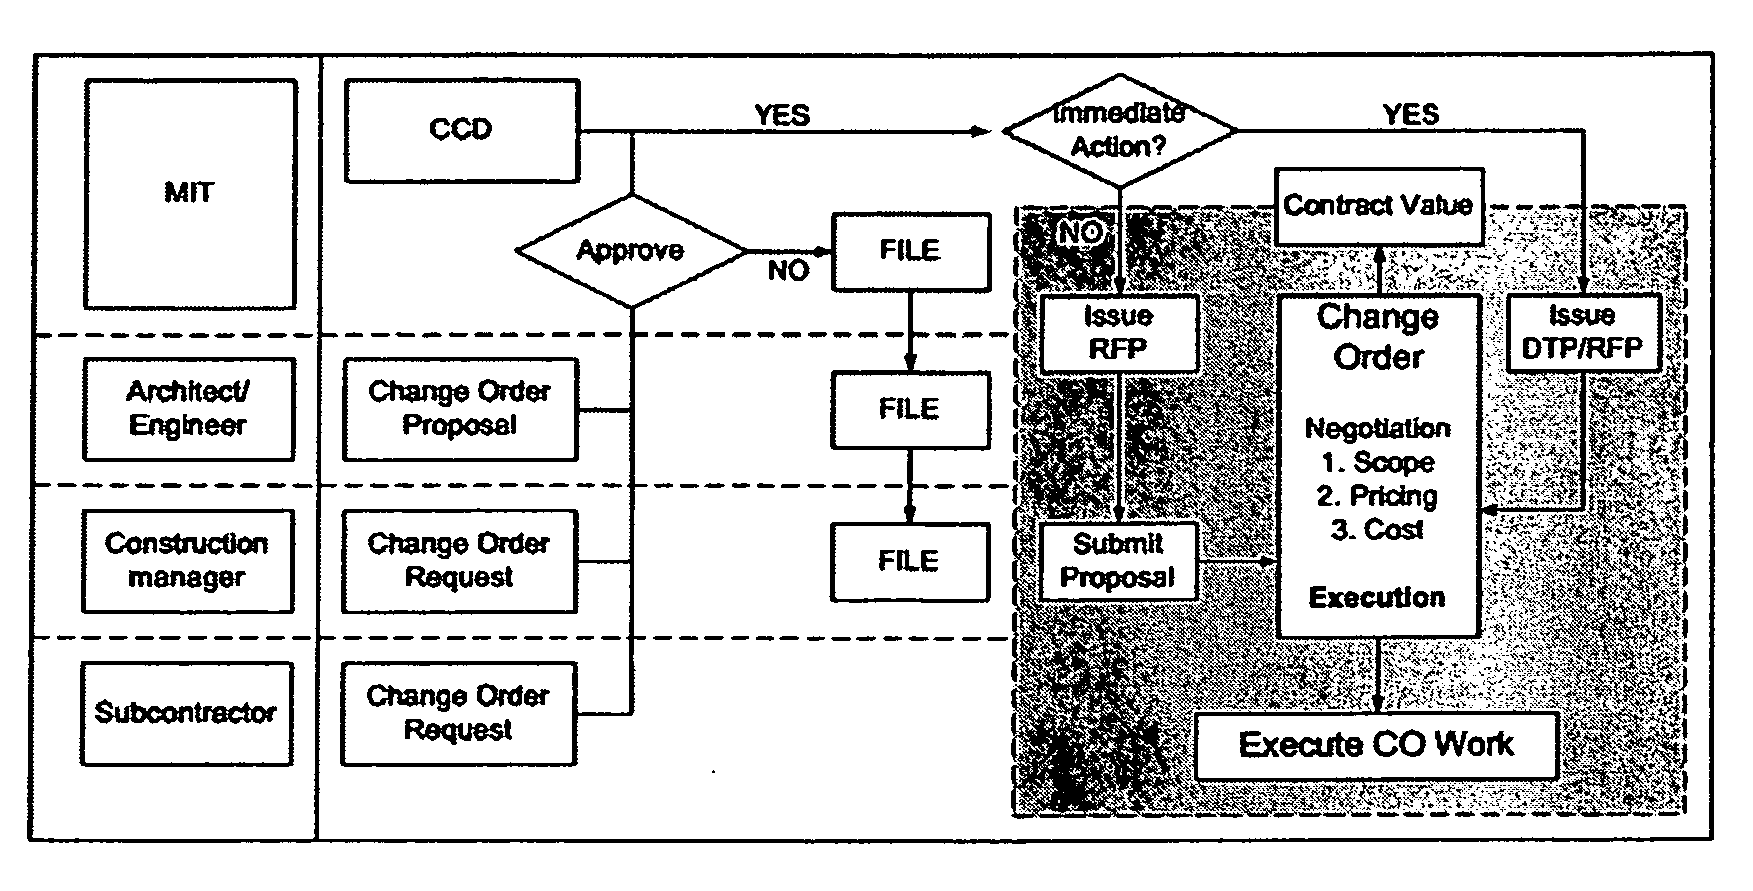
Consequently, a complicated control process unnecessarily consumes effort and time as even the simplest issues demand authority of the various parties. FIG. 7 is a typical example of a control process during construction with MIT as building owner and Turner Construction with responsibility as
construction management and contractor.
A complicated process of review by many parties is required to obtain permission for even one change.
This saves a lot of effort and time when issues need to be resolved immediately.
However, the idea of a single “project director” is unrealistic in actuality for the following reasons: All entities participating in a project share a certain amount of risk.
This makes it difficult for them to accept an arbitrary decision by a project director who has total authority on relevant issues.
It is almost impossible for such a project director to represent the position of all parties and be completely neutral.
Therefore, the hypothetical project director has very little chance of being realized in
actual practice.
However, if a truly neutral, virtual project director, independent of any entity, existed, the issue of inefficient and time-consuming project controls could be resolved.
The methods mentioned in FIG. 8 have evolved in terms of information capability and functionality, but have not address a graphical efficiency or specific
user needs in construction projects.
In other words, as scheduling techniques have evolved in terms of functionality, they have stalled in terms of their graphic manifestation.
However, this method has two limitations as the main control method in a construction project.
Firstly, it only shows time-related information by scaleable bars.
Reliability as a
control system is very low because it does not show the relational impact between time, cost, resource, and performance.
Even if the bar chart shows the progress of an activity is on schedule, it does not mean that the activity is going well since cost and
resource information are not included.
If the 20 percent cost overrun is a result of resource usage, this activity will have a resource shortage soon.
If management doesn't recognize this problem in time, it may cause a schedule
delay due to the need for an additional resource delivery at the last moment.
Secondly, information presented in a conventional spreadsheet format, which lays out data in columns and rows, is only useful to show a relatively small amount of data, such as weekly meetings or a summary schedule.
Such a vast amount of data presented in separate pages whether on paper or screen cannot possibly convey a clear or comprehensible picture of a project.
For less routine projects there is more uncertainty in the completion times, and this uncertainty limits the usefulness of the deterministic CPM model.
Even though CPM is most commonly used at the lower levels in a cost / schedule
control system in construction projects, it is not an adequate control method for the extremely uncertain construction field.
Drawbacks of Networked Diagram Method Even though the calculation of the critical path is precise and systematic, the concept of it is unrealistic.
Recalculation necessitated by the new data may result in a completely different critical path than before causing serious consequences (Pollalis 1993).
Therefore, this is not an adequate tool for identifying the reasons for cost or schedule issues or their impact.
George Suhanic (2001) noted that “Although both CPM and PERT are logically elegant and analytically powerful tools, they are visual disaster.” CPM is a method well-known to schedulers and most project managers at construction sites, but it is not fully understood.
Even if it were fully understood, it has only limited usage in calculating simple critical paths and floats.
Even though the newer interfaces provide more data and better functionality, they are overly complex and poorly reflect the true nature of construction project.
Thus users become overwhelmed and give up using it.
As already noted above, PERT was ignored by industry, and failed due to ineffective implementation by the government and lack of
computer software technology.
Current scheduling interfaces are code-based, and demand a great deal of time and effort for the project manager to identify the physical location and responsible entities for activities outside the jobsite.
However, once construction begins, this information has no significance for
project management teams that must meet fixed deadlines, and criticality due to various constraints.
Unless the cause of the
delay is identified, the problem cannot be resolved.
However, as FIG. 14 shows, CPI / SPI indices depict a summary trend of the entire project, and therefore it is impossible to identify the source of the trend.
Thus, while this tool performs the important but limited function of alerting management that an unfavorable trend is developing, it is unable to analyze the causes of such a trend or explain what impact it will have in the future.
Construction project produces massive amount of data in different forms through complex processes.
However, none of these methods effectively present the multivariable information of time, cost, resource and performance in a holistic manner, not do they reflect the unique circumstances of each construction project.
It is
extremely hard for a project manager to monitor and control all aspects of a project on the basis of firsthand observation alone.
Text-based information is often overly detailed or too technical detail or technical.
Moreover, most organizations do not have standardized reporting procedures, which further complicate the situation.
Fragmentation of data by non-standardized formats and information expressed by discipline-specific methods limit a project manager's ability to effectively monitor and control a project.
The current hidden structure of hierarchical tables of contents in digital format requires users to unnecessarily turn pages to find certain information and doesn't provide a clue as to the amount or the location of that information.
As a result, it is very hard for users to spend the time and effort needed to finish the contents.
