
Methods for determining glycemic responses of foods

a glycemic response and food technology, applied in the field of glycemic response determination of foods, can solve the problems of milk intolerance, incomplete or rapid glucose absorption, poor etc., to reduce the variation in analytical accuracy, improve the accuracy of fasting blood glucose estimation, and reduce the effect of minute-to-minute variation in blood glucos

Inactive Publication Date: 2005-11-03
WOLEVER THOMAS M S +2
View PDF4 Cites 33 Cited by
  • Summary
  • Abstract
  • Description
  • Claims
  • Application Information

AI Technical Summary

Benefits of technology

This patent describes improved methods for determining the glycemic responses of foods by measuring fasting glucose and controlling the timing of the blood sample. The methods involve measuring glucose in multiple samples taken at different times and averaging the results. This reduces the variation in the estimate of fasting glucose and improves the accuracy and precision of glycemic index values and other measures of glycemic response. The variation in iAUC is found to be greater if the blood sample is obtained 5 minutes before starting to eat, and reducing analytical variation has a greater effect on the variation of iAUC compared to reducing minute-to-minute variation.

Problems solved by technology

The absorption of other monosaccharides is not well understood, but is not as complete or rapid as that of glucose.
A low level of lactase activity may result in milk intolerance.
Humans have no enzymes capable of digesting some disaccharides, such lactitol (a sugar alcohol), and these carbohydrates are completely indigestible.
Resistant starch is not able to be digested in the human small intestine.
However, if the digestion of starch is slow, it may not be completely absorbed during its passage through the small intestine.
Thus, carbohydrates which are not digested or absorbed do not elicit a glycemic response.
While the iAUC is a scientifically valid way of expressing glycemic responses, it is not a practical way of classifying the glycemic responses of carbohydrate foods because iAUC differs markedly in different individuals.
However, the costs and the benefits of such methods need to be considered before they can be recommended.
Other methods of reducing intra-individual variation might also add cost, such as having to provide subjects with a standard meal the night before tests.
In addition, if subjects' activities were restricted (eg. no smoking, or no vigorous exercise allowed for 24 h before the test) this might reduce the willingness of subjects to participate in tests, and increase costs of recruitment and reduce the rate at which tests could be conducted.
However, we showed recently that not allowing any smoking or vigorous physical activity before for 24 h, providing subjects with a standard dinner, and controlling the time of fasting to within ±15 minutes, paradoxically, tended to increase intra-individual variability of glycemic responses compared to restricting smoking only on the morning of the test, restricting only unusual vigorous activity, asking subjects to eat their normal dinner the night before and allowing the time of fasting to vary between 10 and 14 h.

Method used


Image

  • Methods for determining glycemic responses of foods
  • Methods for determining glycemic responses of foods
  • Methods for determining glycemic responses of foods

Examples


example # 1

EXAMPLE #1

Intra-Individual Variation of IAUC

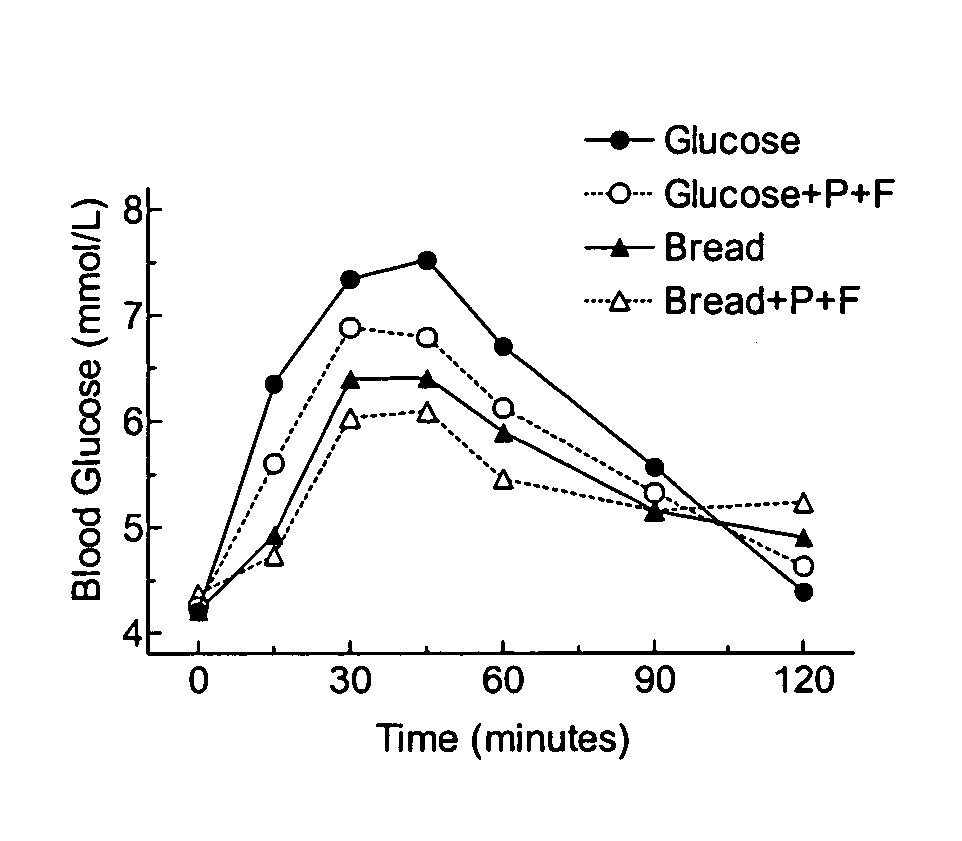
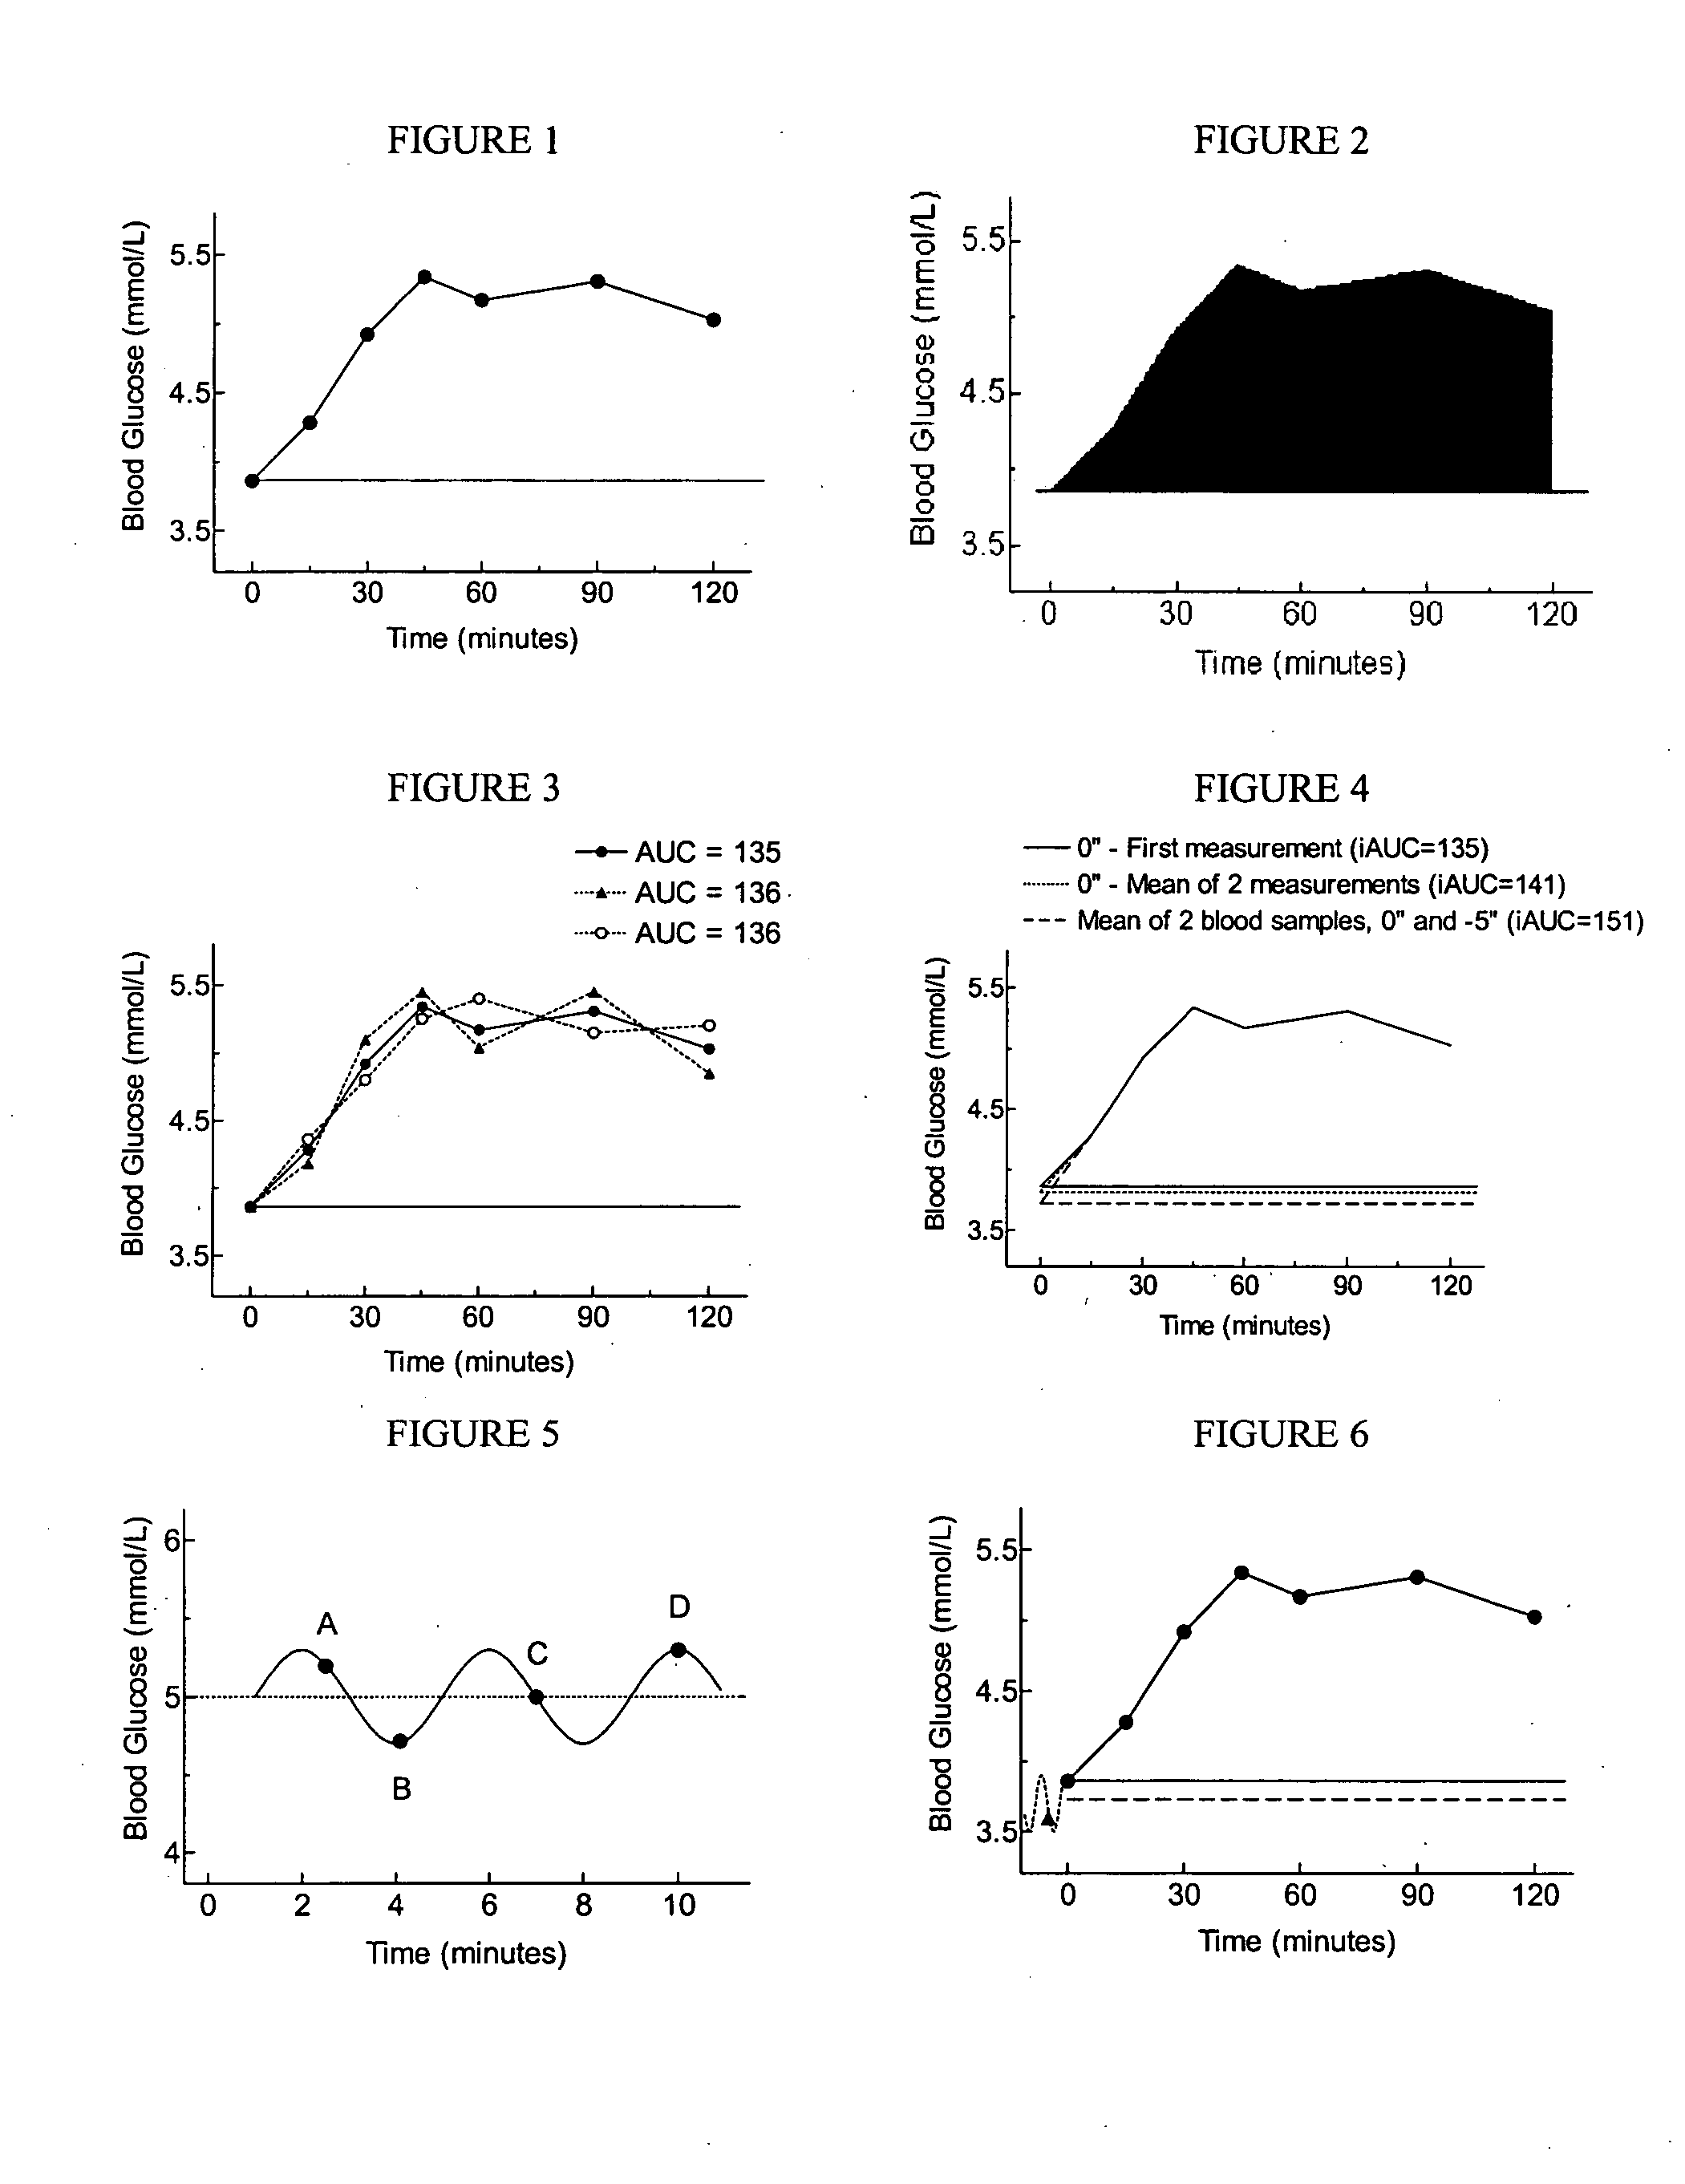
[0057] Fourteen (14) normal subjects (Table 1) were studied on 4 occasions after overnight fasts. They consumed 4 different test meals consisting of either: 50 g glucose, 50 g glucose plus 10 g protein from soy protein concentrate plus 10 g fat from corn oil, a 50 g available carbohydrate portion of white bread, or a 50 g available portion of white bread plus 10 g protein from low fat cottage cheese plus 10 g fat from margarine.

[0058] Blood samples (2-3 drops) were taken by finger-stick. On each occasion, 2 fasting blood samples were taken separated by a 5 minute interval; these samples are termed −5 min and 0 min. As soon as possible after the second fasting blood sample, the subject started to eat one of the test meals and further blood samples were obtained 15, 30, 45, 60, 90 and 120 minutes after starting to eat. Glucose was analyzed using an automatic analyzer (Model 2300 STAT, Yellow Springs Instruments, Yellow Springs, Wis.). Bloo...

example # 2

EXAMPLE #2

Precision of Estimate of Relative Glucose Response

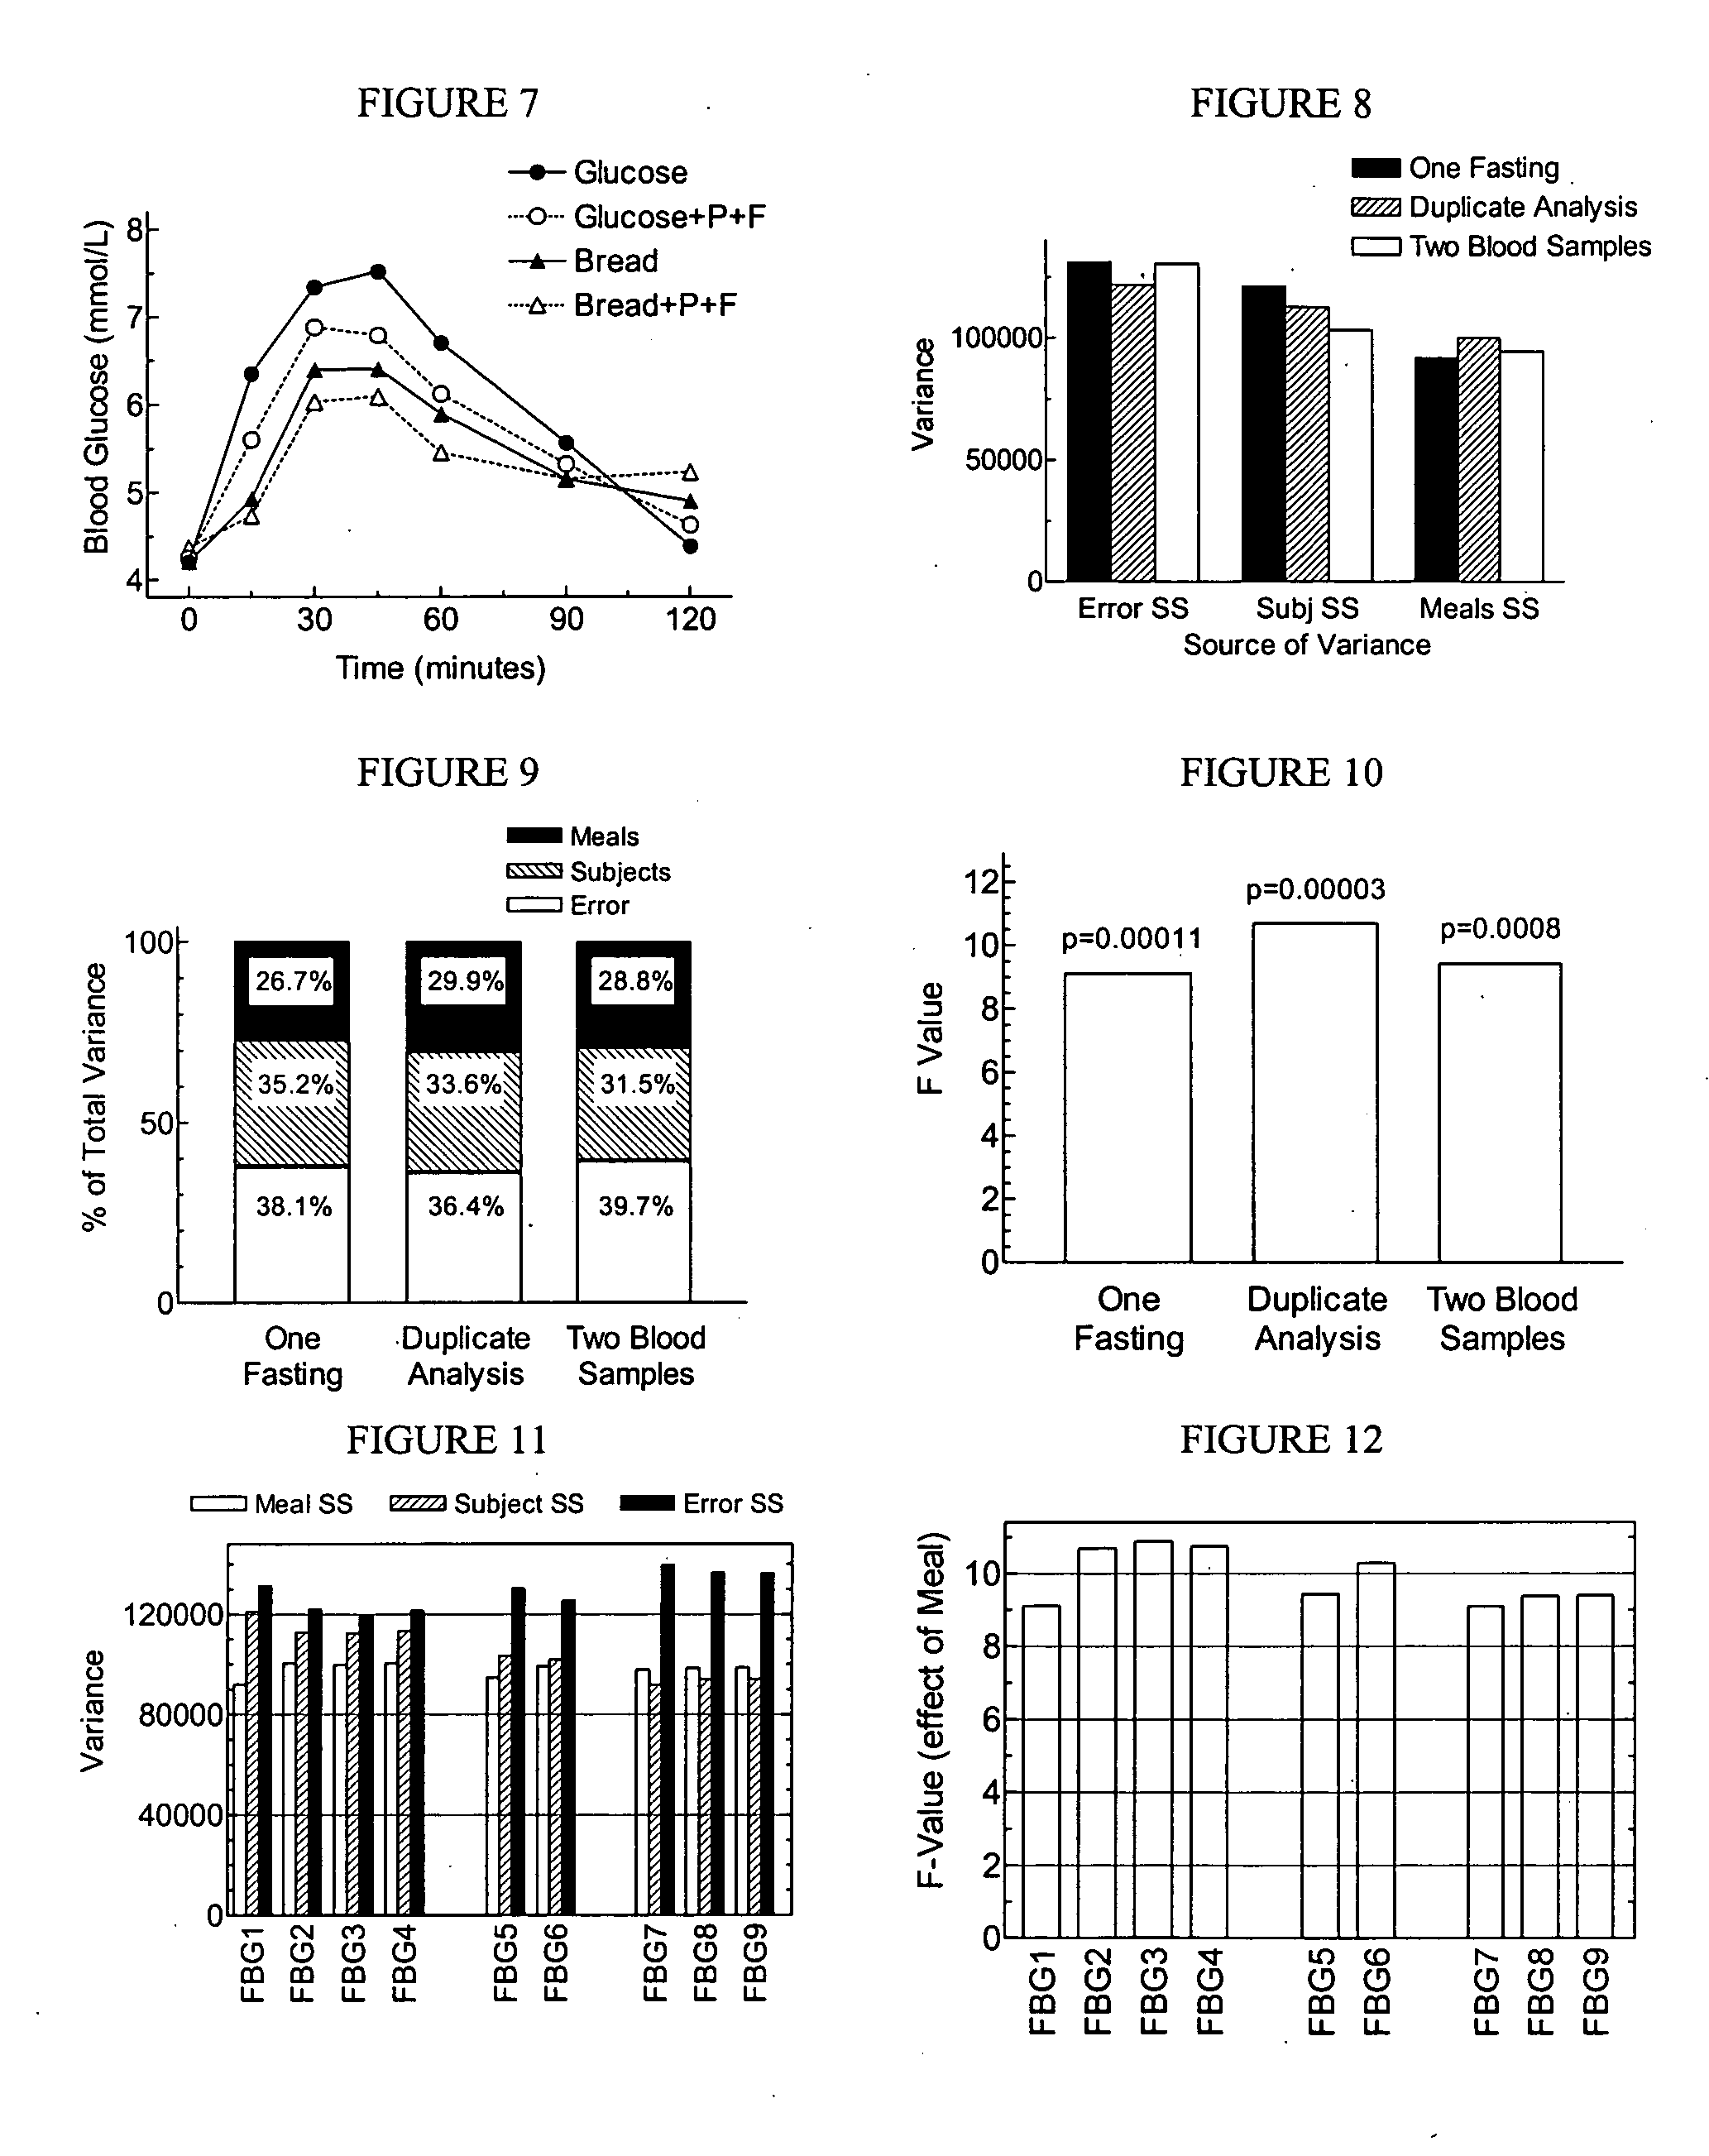
[0075] The data from example #1 can by used to calculate the iAUC elicited by white bread as a percentage of that elicited by glucose. Each subject's iAUC after white bread alone was expressed as a percentage of the same subject's response after glucose alone, and the mean, SEM, CV and 95% confidence interval of the resulting values shown in Table 3. Compared to iAUC calculated from a single measure of glucose in the 0 min blood sample (FBG1), duplicate analysis of glucose in the 0 min sample (FBG2) reduced the SEM, CV and 95% confidence interval, and these values were not reduced any further by triplicate analysis of glucose in this blood sample (FBG3 and FBG4). By contrast, the precision of the estimate of white bread relative glycemic response was actually reduced (ie. higher SEM, CV and 95% confidence interval) by taking the average of blood glucose at −5 min and 0 min (FBG5), and was even worse when glucose in the −5 ...

example # 3

EXAMPLE #3

Reducing Number of Subjects without Loss of Statistical Power

[0076] The data from example #1 can be used to show how duplicate analysis of fasting glucose allows for fewer subjects to be studied. Here, the F value for the main effect of test meal in 12 or 13 subjects is compared with the F value for all 14 subjects. The F value for all 14 subjects for iAUC values calculated using a single measure of glucose in the 0 min sample (usual method) was 9.11. Since there were 14 subjects, there are 14 different ways to obtain 13 subjects (removing each of the 14 subjects in turn, and calculating F for the remaining 13 subjects). When this is done for iAUC values calculated by the usual method, the resulting F value was less than 9.11 in 11 of the 14 (79%) cases. In other words, if only 13 subjects were used, there is about an 80% chance of obtaining a less significant result than using 14 subjects. However, if iAUC is calculated using the average of 2 measures of glucose in the 0...


PUM

PropertyMeasurementUnit
concentrationaaaaaaaaaa
timeaaaaaaaaaa

Abstract

The present invention provides precise methods for determining the glycemic responses of foods, including: (a) the incremental area under the glycemic response curve, (b) the Glycemic Index value of a food, (c) the Equivalent Glycemic Load or Glycemic Glucose Equivalent of a food, and (d) other similar measures.

Description

BACKGROUND OF THE INVENTION [0001] The present invention relates to methods for determining the glycemic responses elicited by the consumption of foods. Foods elicit glycemic responses primarily due to their content of available carbohydrates. Dietary Carbohydrates [0002] Carbohydrates are polyhydroxy aldehydes, ketones, alcohols, acids, their simple derivatives and their polymers having linkages of the acetal type. Carbohydrates can be classified based on their chemical composition or their physiological effects. [0003] The chemical classification of carbohydrates includes the number and nature of the monosaccharide units contained in the carbohydrate molecule. Monosaccharides are the basic building blocks of carbohydrates and usually contain 5 or 6 carbon atoms, 5 or 6 oxygen atoms and a number of hydrogen atoms. There are many types of monosaccharides including glucose, fructose, galactose, ribose, xylose and mannose. These monosaccharides can be reduced by the addition of hydro...

Claims


Application Information

Patent Timeline
Patent Type & Authority Applications(United States)
IPC IPC(8): C12Q1/54G01N33/02G01N33/66G06F19/00
CPCG01N33/66
Inventor WOLEVER, THOMAS M.S.IP, BLANCHEMOGGHADAM-BOZORGI, ELHAM
Owner WOLEVER THOMAS M S
Learn More