
Applied artificial intelligence technology for evaluating drivers of data presented in visualizations

an artificial intelligence and visualization technology, applied in the field of data visualization, can solve problems such as difficulty in understanding and the inability of conventional visualization systems to provide users with an automated means

Active Publication Date: 2021-10-12
NARRATIVE SCI
View PDF333 Cites 13 Cited by
  • Summary
  • Abstract
  • Description
  • Claims
  • Application Information

AI Technical Summary

Benefits of technology

[0014]Moreover, in example embodiments, the entities representing these derived features or categories can be represented (and presented to the user) in entirely notional terms—that is, they can represent objects or entities with specific, relevant properties, even if the user (or, for that matter, the system itself) doesn't yet know the actual objects or entities which have those properties. For example, if there is an analytic that computes the percentage increase in some metric over some interval, and additionally, one that ranks actual (input) entities according to this percentage increase, then it is possible to present to the user the possibility of selecting, to produce a more specific and focused visualization (and narrative), the following notional entity: “the (input) entity with the greatest percentage increase in the metric over the interval”— whether or not we know (yet) the actual entity that fits that description. Indeed, by combining this description of the notional entity with appropriate metadata from the initial visualization (concerning, e.g., the nature of the metric and / or of the entities in question) it is possible to present the user with the option of selecting, for a more focused view and narrative: “the company with the greatest percentage increase in revenue over the third quarter.” In either case, this will of course turn out to be some specific company, Company A. But the point is that the user can select this company, and the data about it, simply by selecting the notional reference described in terms of the result of this analytic—i.e., not solely by using the name of the company as manifest in the raw data or metadata comprising the visualization. This is the difference between being able to say, “Tell me about the three teams with the best records,” and “Tell me about the Yankees, the White Sox, and the Red Sox.” You can specify the former without knowing which teams actually fit the bill—in fact the point of the resulting narrative and visualization will be, in part, to inform you of which teams actually fit that description. This enables the user to focus the subsequent visualization (and narrative) by reference to the narratively interesting aspects or components of the data, in purely functional terms.
[0017]The use of automatic narrative generation, or its component technologies such as narrative analytics, linked with a visualization system, can also provide other opportunities to augment a user's ability to focus a visualization, beyond the use of notional entities that may have interesting aspects as described above. In particular, such an approach can make it possible for a user to interactively investigate the drivers (causes or inputs) of particular data presented in the visualization; or to directly select specific analytics to be both presented in the visualization and utilized in constructing the accompanying narrative.

Problems solved by technology

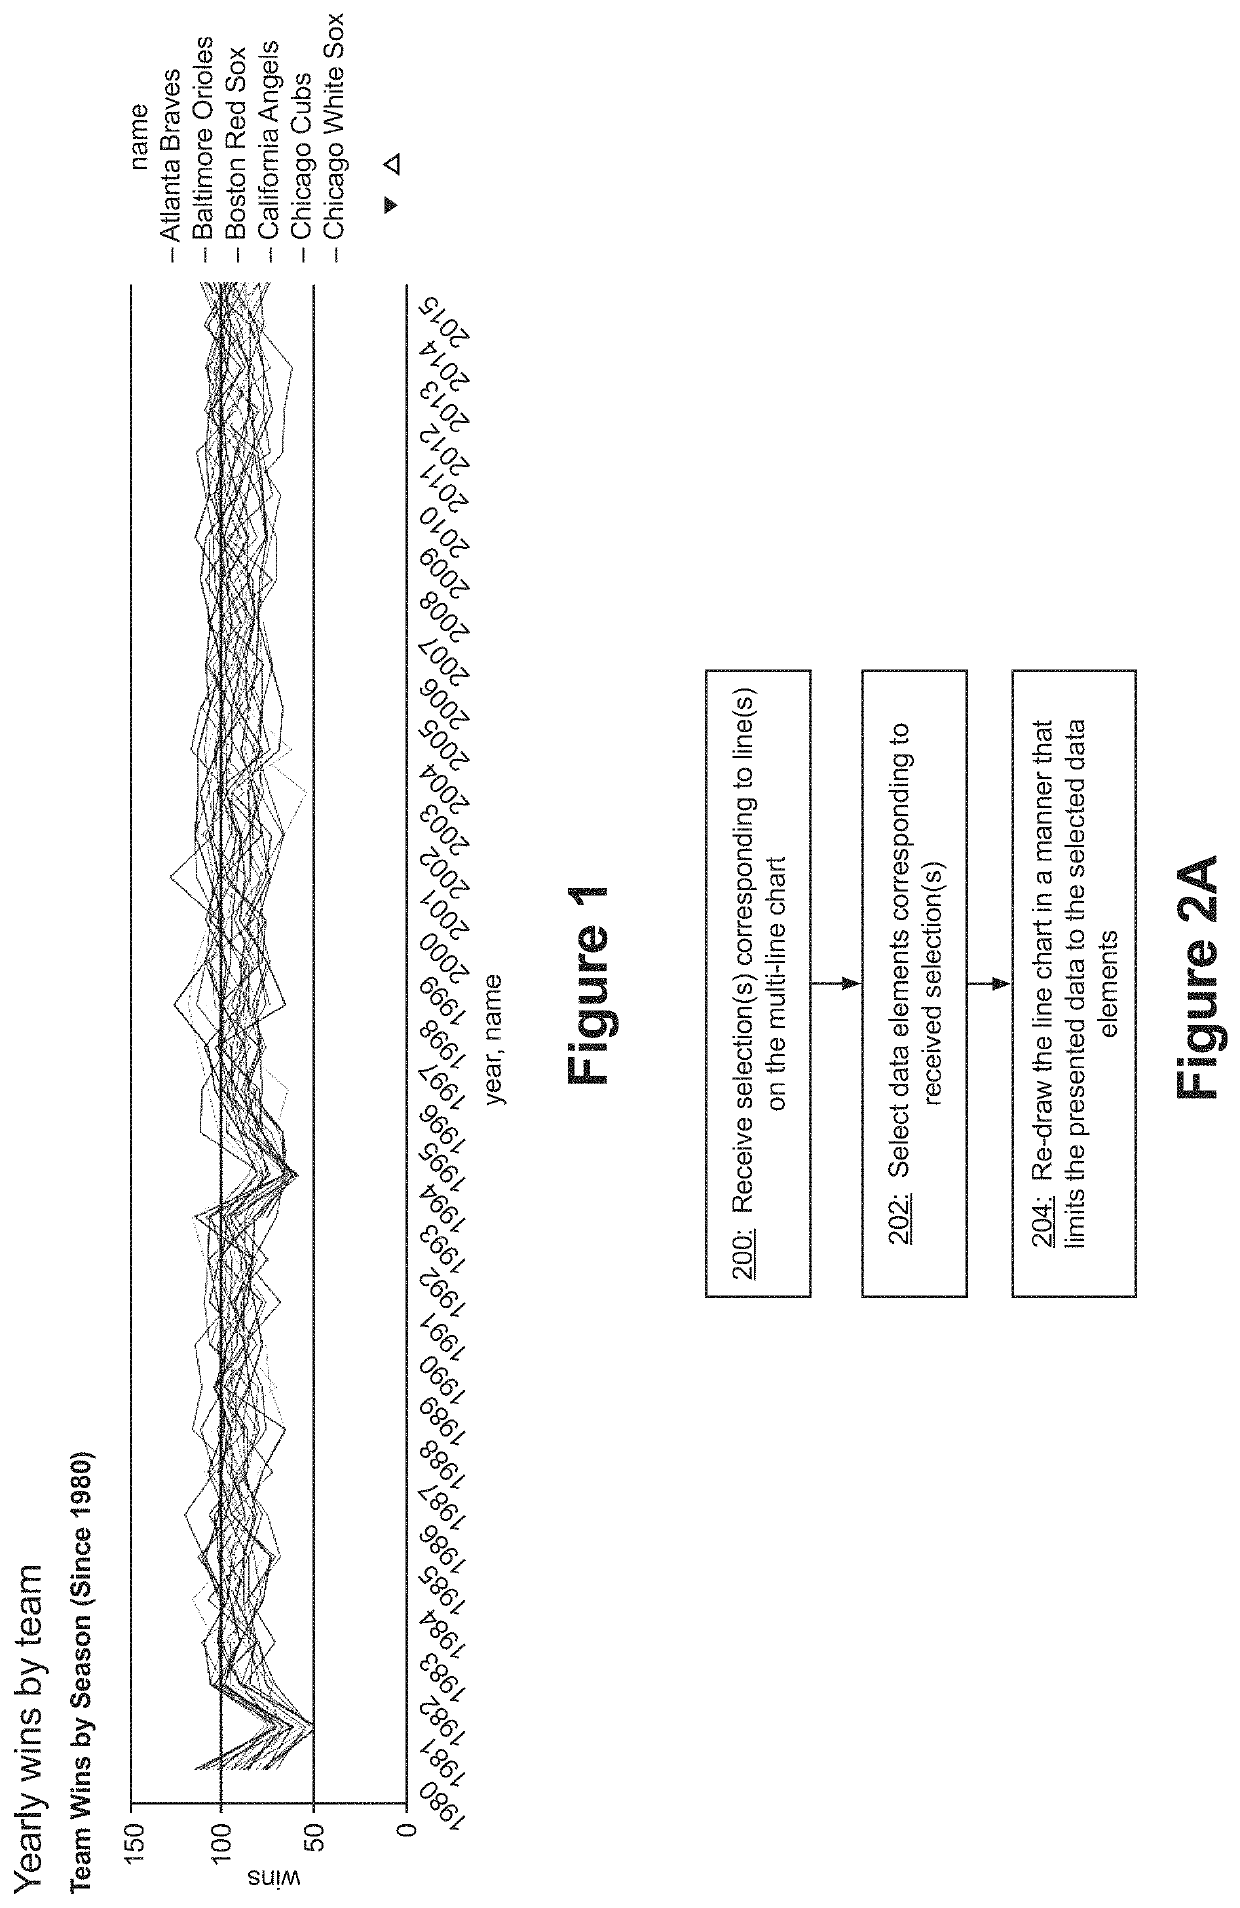
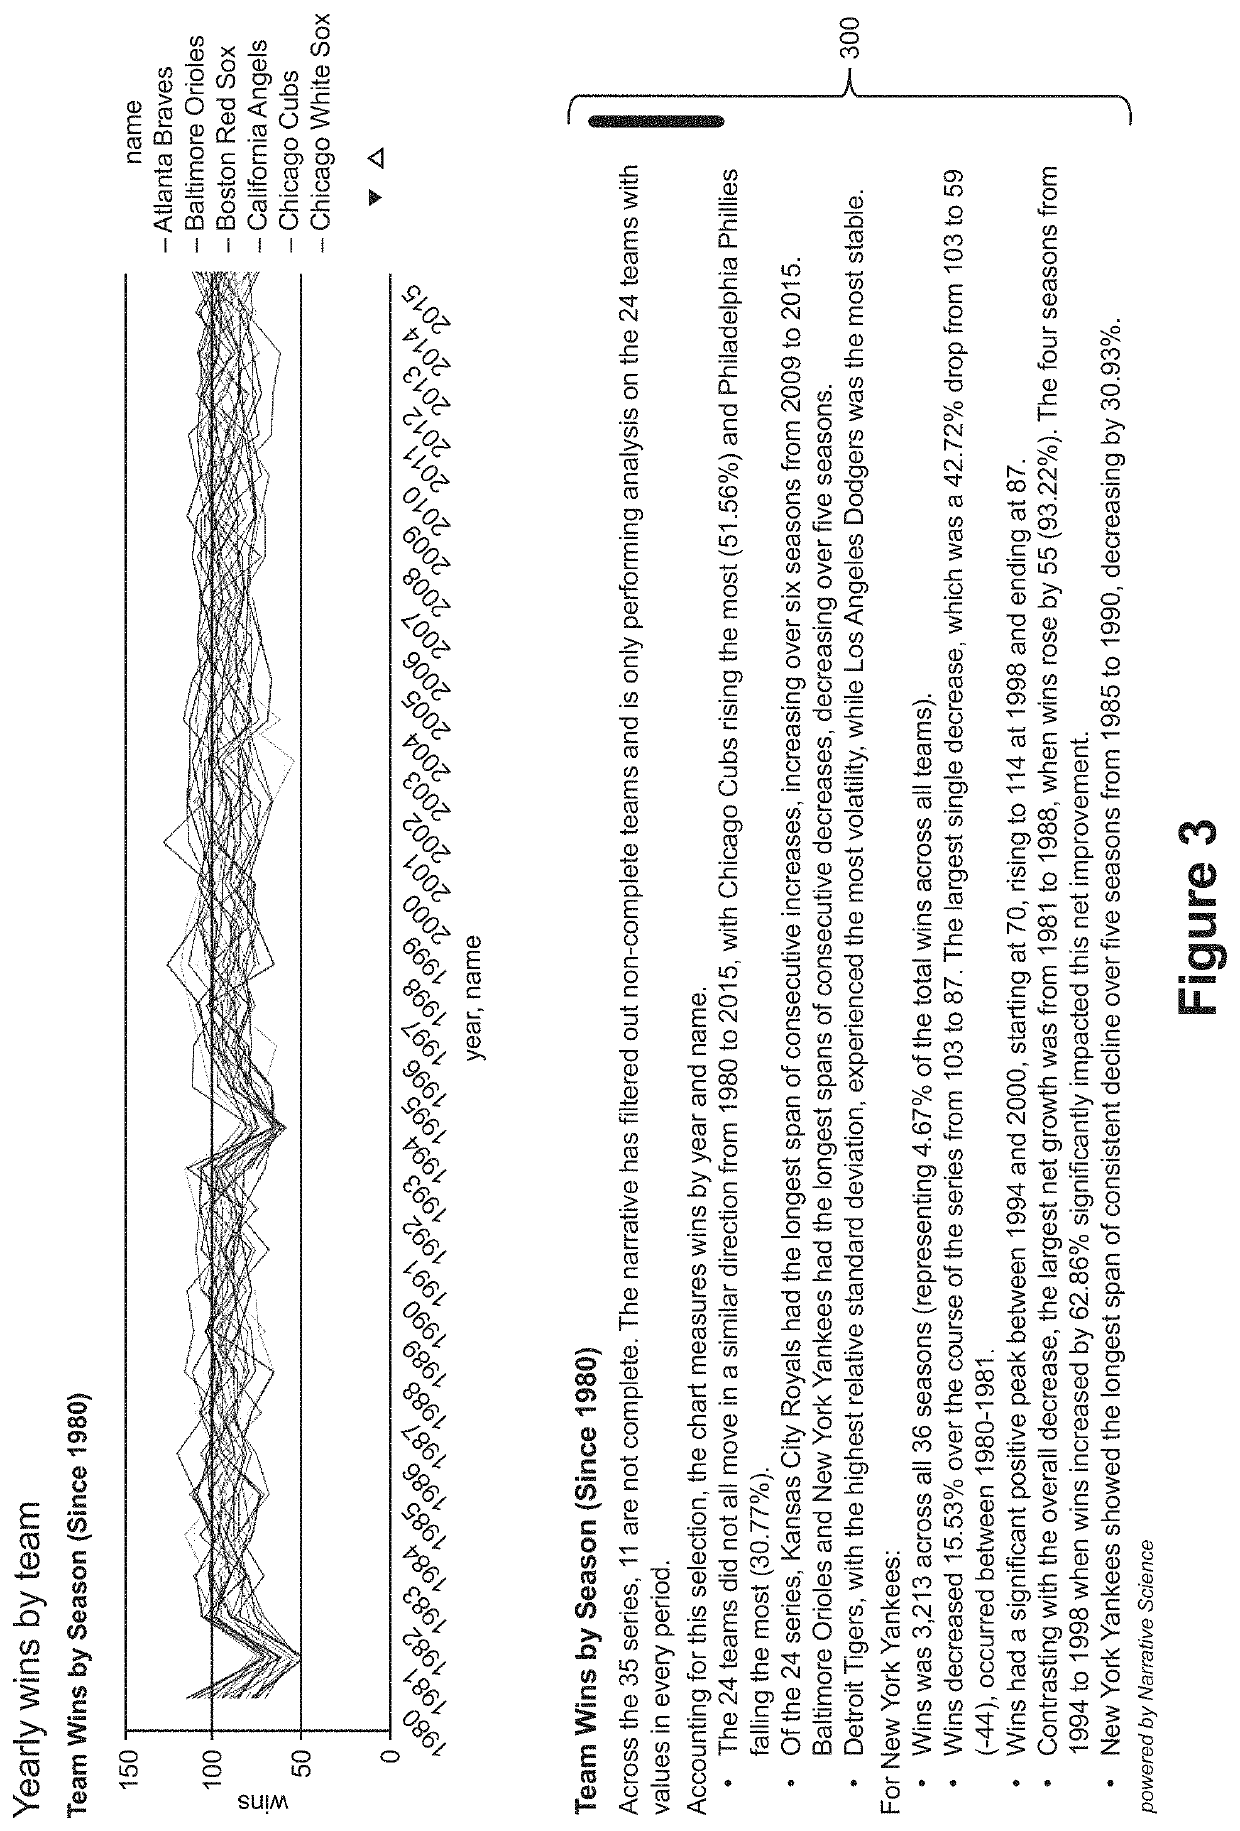
As can be seen by FIG. 1, this multi-line chart is extremely dense in terms of information conveyed, and so rather difficult to understand; a user may therefore want to focus in on certain aspects of this visualization in order to understand it better.
Unfortunately, conventional visualization systems are unable to provide users with an automated means for discovering these interesting aspects of the data that are worth focusing on, and then specifying what to focus on in terms of these interesting aspects.

Method used


Image

  • Applied artificial intelligence technology for evaluating drivers of data presented in visualizations
  • Applied artificial intelligence technology for evaluating drivers of data presented in visualizations
  • Applied artificial intelligence technology for evaluating drivers of data presented in visualizations

Examples


Embodiment Construction

[0051]FIG. 4 depicts an example process flow for focusing visualizations with the aid of narrative analytics. The process flow of FIG. 4 can be executed by a processor in cooperation with computer memory. For ease of illustration, FIG. 5 depicts an example system for executing the process flow of FIG. 4. The system of FIG. 5 includes a visualization platform 500 and narrative analytics 510. The visualization platform provides the visualization data 502 that serves as the source for a visualization produced by the visualization platform. The narrative analytics 510 can access this visualization data 502 through an application programming interface (API) or other suitable data access / sharing techniques. Examples of visualization platforms that may be suitable for use with the system of FIG. 5 include the Qlik visualization platform and the Tableau visualization platform. An example of a narrative analytics platform 510 that is suitable for use with the system of FIG. 5 is the Quill na...


PUM


Abstract

Disclosed are new data structures and artificial intelligence logic that can be utilized to evaluate the drivers of data presented in visualizations. For example, a processor can translate a specification of a driver to be evaluated with respect to a measure shown in a visualization into narrative analytics, where the narrative analytics are configured to evaluate the driver in the context of a data set for the visualization based on a plurality of data structures and processing logic. In turn, a narrative story can be automatically generated about the evaluated driver (for example, describing an impact that the driver candidate may have had on the subject measure of the visualization).

Description

CROSS-REFERENCE AND PRIORITY CLAIM TO RELATED PATENT APPLICATION[0001]This patent application claims priority to U.S. provisional patent application Ser. No. 62 / 382,063, filed Aug. 31, 2016, and entitled “Applied Artificial Intelligence Technology for Interactively Using Narrative Analytics to Focus and Control Visualizations of Data”, the entire disclosure of which is incorporated herein by reference.[0002]This patent application is also related to (1) U.S. patent application Ser. No. 15 / 666,151, filed this same day, and entitled “Applied Artificial Intelligence Technology for Interactively Using Narrative Analytics to Focus and Control Visualizations of Data”, and (2) U.S. patent application Ser. No. 15 / 666,192, filed this same day, and entitled “Applied Artificial Intelligence Technology for Selective Control over Narrative Generation from Visualizations of Data”, the entire disclosures of each of which are incorporated herein by reference.INTRODUCTION[0003]Many data visualizatio...

Claims


Application Information

Patent Timeline
Patent Type & Authority Patents(United States)
IPC IPC(8): G06N5/04G06F40/169G06F3/0482G06T11/20
CPCG06N5/04G06F40/169G06F3/0482G06T11/206G06F40/56G06F40/30G06F3/04847G06F40/40G06F40/103G06F40/289G06F3/0484G06N3/08G06N5/02G06T2200/24
Inventor PLATT, DANIEL JOSEPHSIPPEL, ALEXANDER RUDOLFMUJICA-PARODI, III, MAURO EDUARDO IGNACIOHUGHES, KATHRYN MCCARTHYHE, BOBIRNBAUM, LAWRENCE A.
Owner NARRATIVE SCI
Learn More