


Quick Research
Generate reliable direction feasibility study reports for your R&D in just a few steps.

Technical Q&A
Discover and master advanced knowledge NOW. Basics, ideas, possibilities, all at once.

Find Solutions
As an expert in R&D theories, this can generate solutions to your technical problems instantly.

Evaluate Feasibility
Analyze your overall solution with one click, know your potential R&D risks in advance.

Monitor Landscape
Get weekly tech updates, stay abreast of the latest tech innovations and key insights.
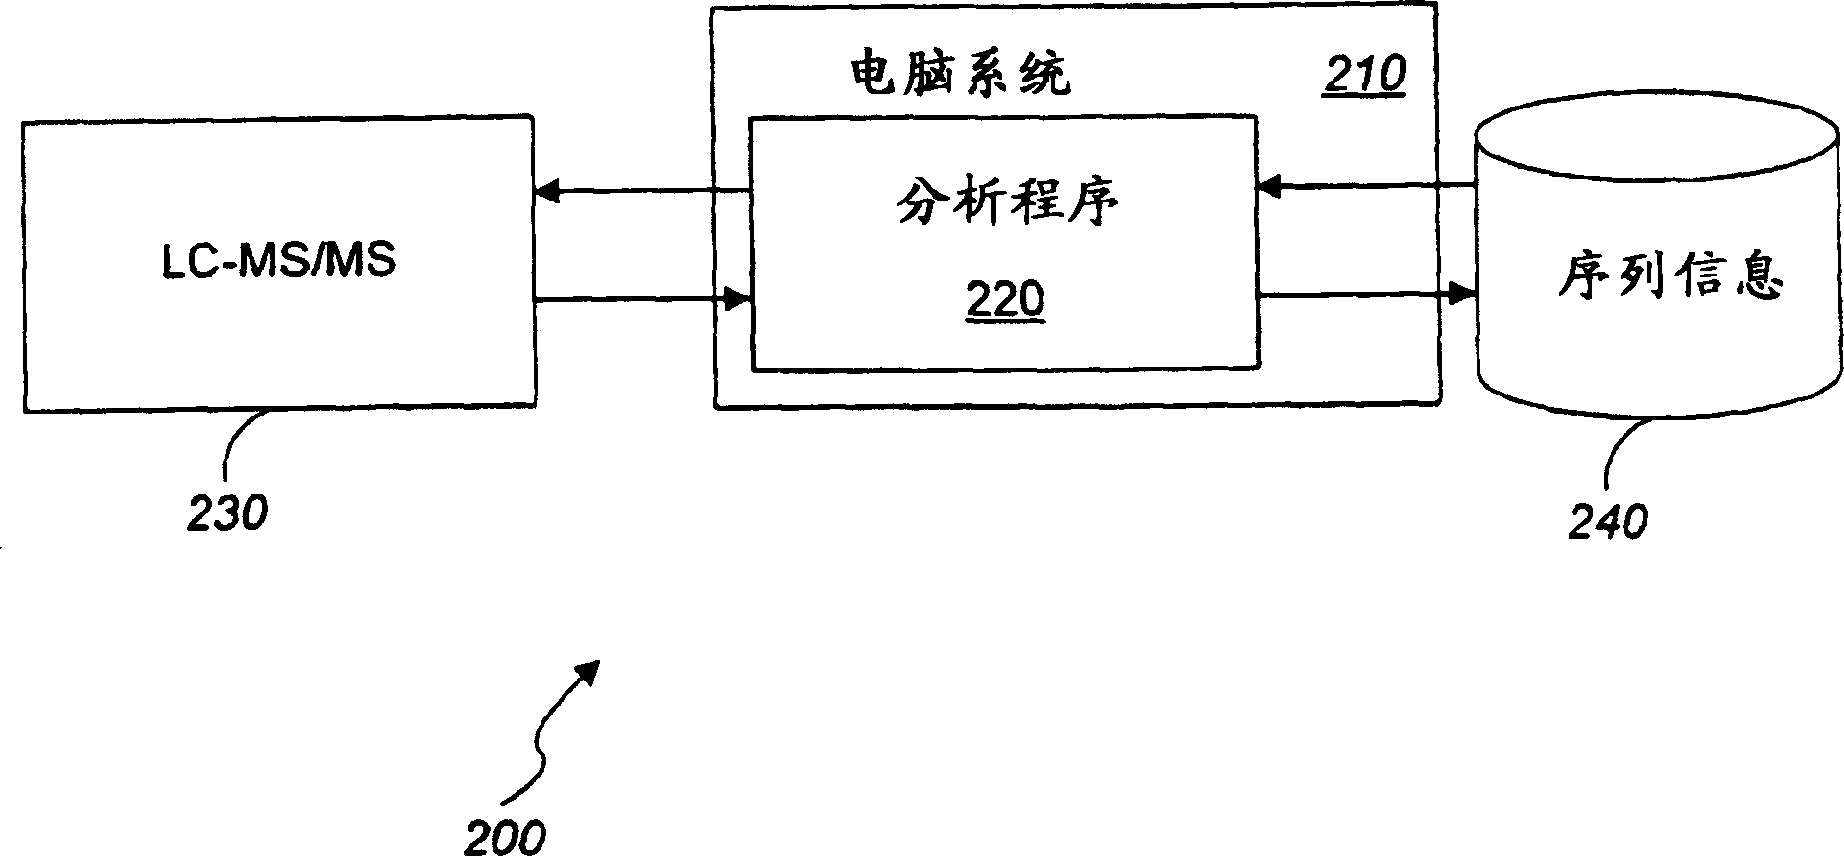
Quantitation of biological molecules
A technology for biological samples and mixtures, which is applied in the field of analysis technology for peptide identification and quantification, and can solve problems such as expensive isotope labeling reagents
- Summary
- Abstract
- Description
- Claims
- Application Information
AI Technical Summary
Problems solved by technology
Method used
Image


Examples
Embodiment 1
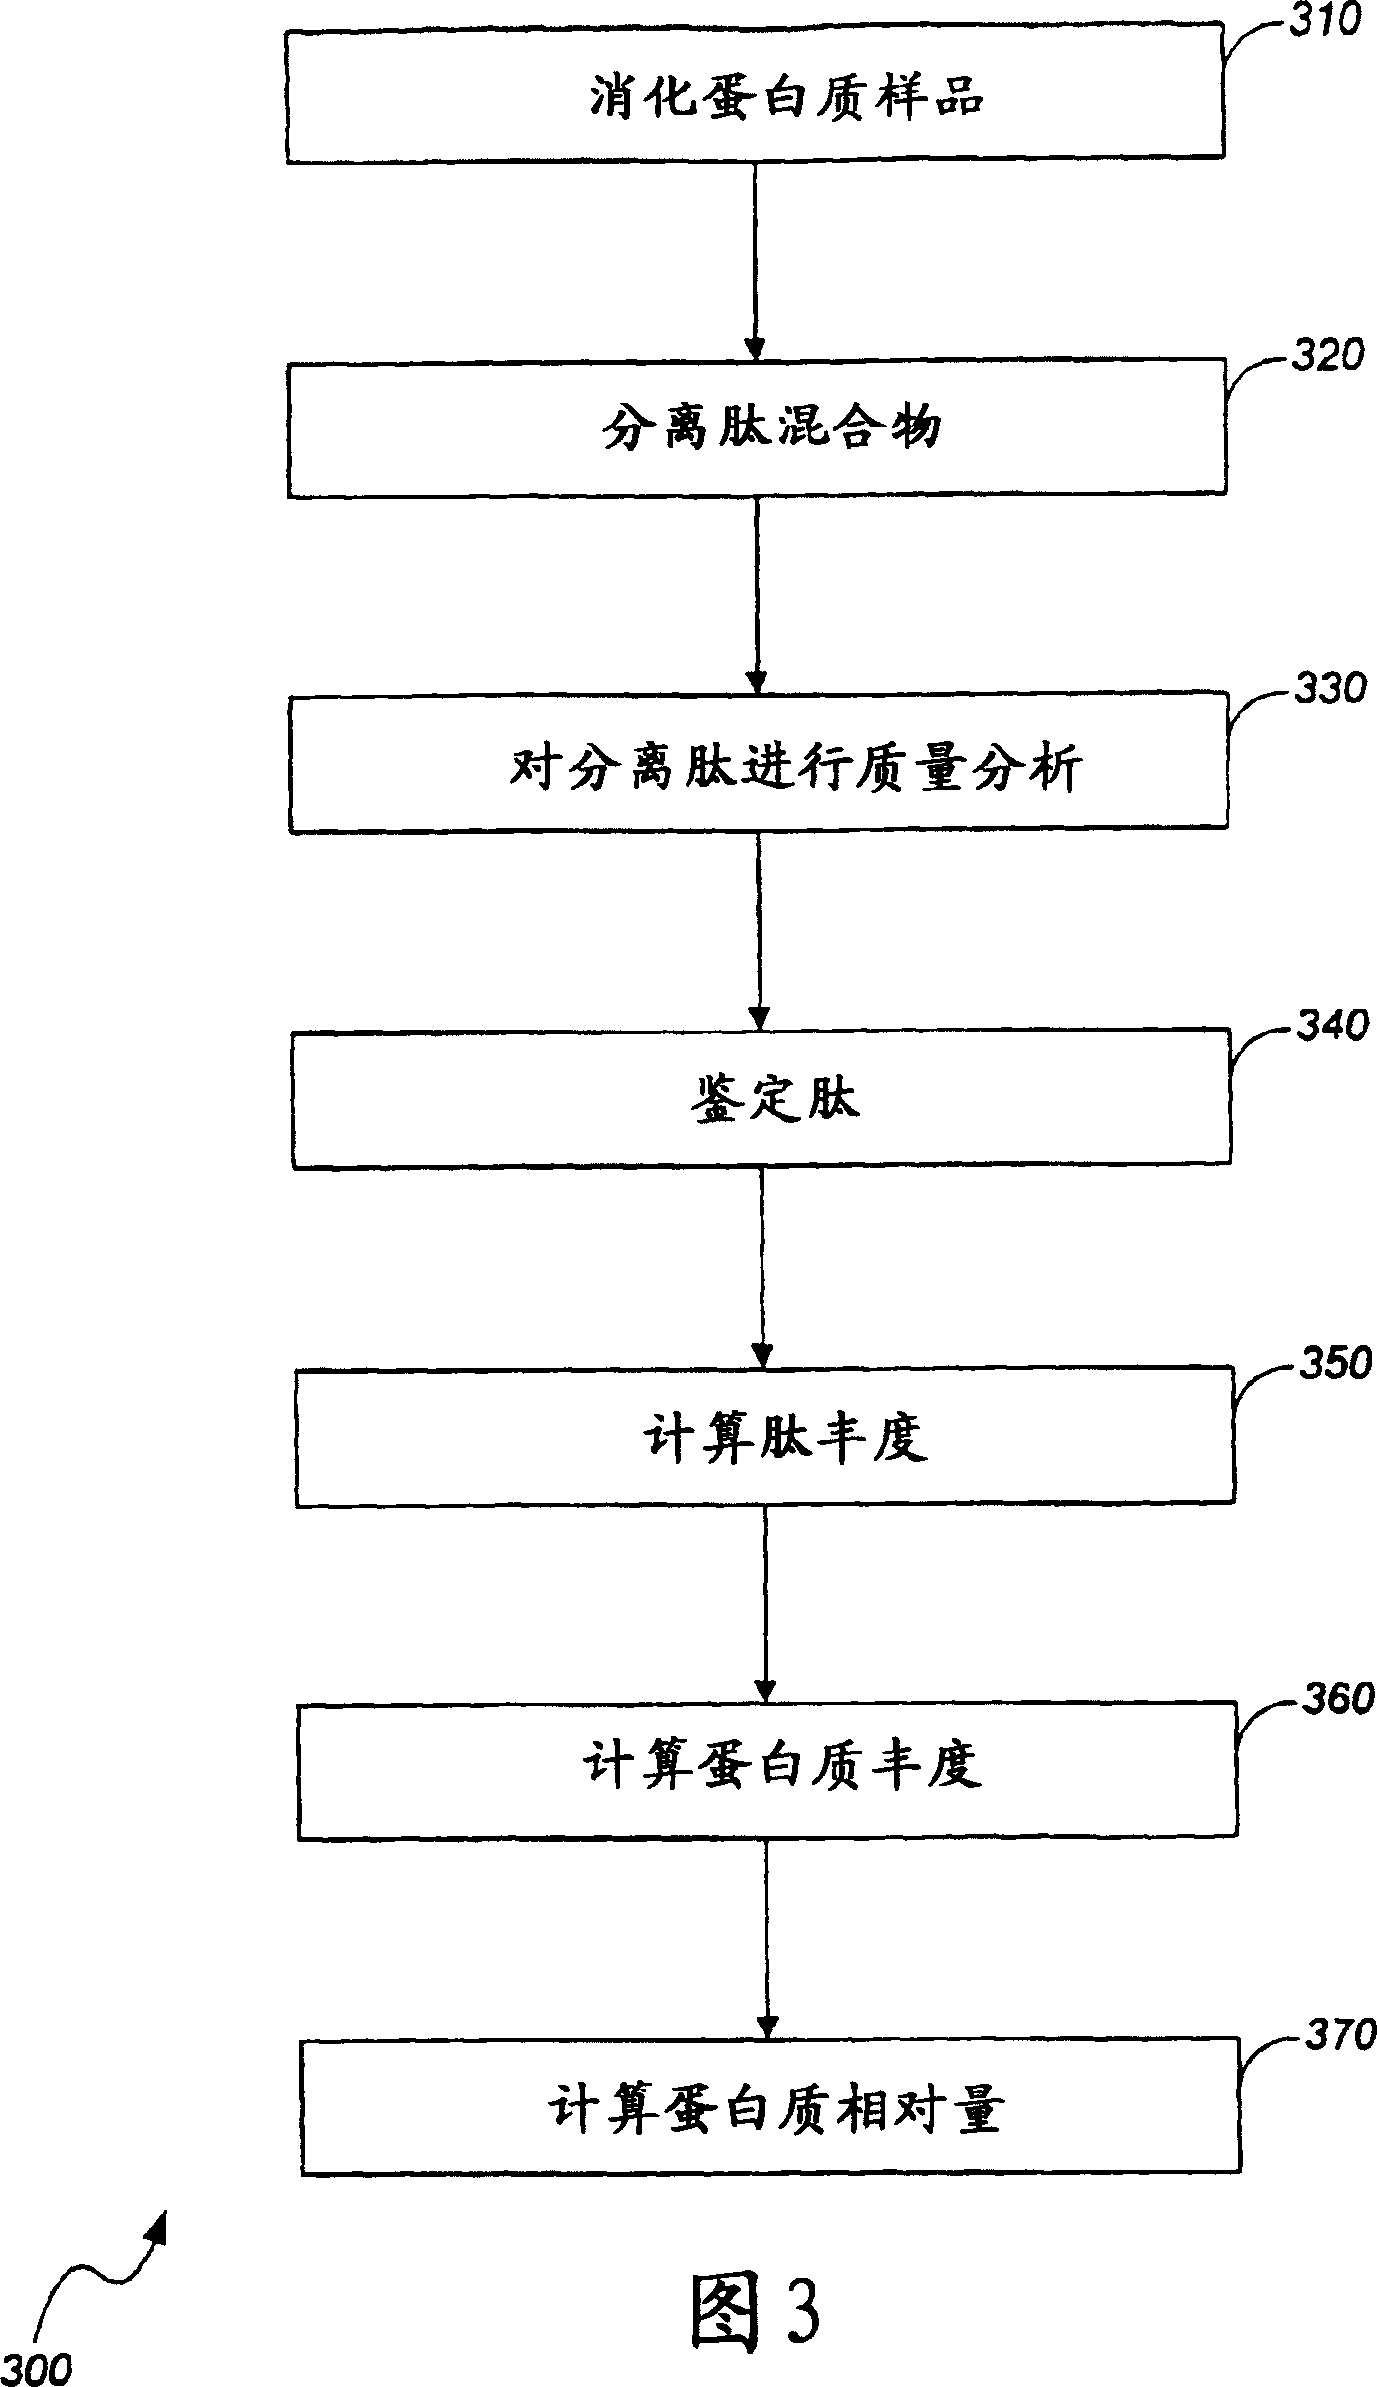
[0058] The disclosed method was used for a mixture of five standard proteins - bovine albumin, equine hemoglobin, equine ferritin, equine cytochrome, and equine myoglobin. The first four proteins were maintained at a constant concentration (200 fmol), while the concentration of the fifth protein (myoglobin) varied widely. The peak area of the protein digest was normalized to that of the albumin digest. The whole process was repeated three times. The RSD was 20% after three measurements and the calculated peak areas were constant for the four constant concentration protein digests. The relative peak area of the fifth protein (myoglobin) showed a linear increase with increasing concentration from 10 fmol to 1000 fmol.
[0059] Sample Preparation
[0060] Five proteins were purchased from Sigma (St. Louis, MO) as lyophilized powders: bovine albumin, A-7638; horse hemoglobin, H-4632; horse ferritin, A-3641; horse myoglobin, M- 0630; Equine Cytochrome C, C-7752. Solvents a...
Embodiment 2
[0075] Lyophilized protein samples (1 mg human serum and 1 mg horse myoglobin, Sigma-Aldrich, St. Louis, Missouri, USA) were dissolved in 1 ml ammonium bicarbonate buffer (100 mM pH 8.5) and 3 μl DTT (1M, Sigma-Aldrich , St.Louis, Missouri, USA). The mixture was incubated at 37°C for 30 minutes. To alkylate the protein, 7 μl of iodoacetic acid (1M in 1M KOH, Sigma-Aldrich, St. Louis, MO, USA) was added and the mixture was incubated for an additional 30 minutes at room temperature in the dark. 13 [mu]l DTT (1M) was added to quench iodoacetic acid. 20 μl of trypsin (0.5 mg / ml, Promega, Madison, Wisconsin, USA) was added to digest the reduced and alkylated protein. The mixture was incubated at 37°C for 6 hours, then an additional 20 µl of trypsin (0.5 mg / ml) was added and the incubation was continued at 37°C for 16 hours.
[0076] Aliquots of sample digests (as indicated below) were placed in wells of a 96-well plate. Plates were sealed with plastic film to reduce evaporation...
Embodiment 3
[0084] Eleven aliquots containing different amounts (ranging from 10 fmol to 100 pmol) of myoglobin digest were analyzed by LC / MS / MS and the peak areas of five selected peptides were calculated. Experiments were repeated three times to ensure reproducibility. The peak area increases with increasing peptide concentration injected. In this experiment, the lower limit of peak detection was 10 fmol and the upper limit was 100 pmol. The peak areas for all five myoglobin peptides were combined and plotted against the amount of myoglobin. From 10fmol to 100pmol, the peak area is linearly related to the myoglobin concentration (r 2 =0.991), and the results were reproducible. A summary of the results is shown in Table 4 and Figure 11 . It should be noted that peak areas with a value of 0 (see Table 4) cannot be displayed on the logarithmic scale, but are included in the linear regression.
[0085] concentration
PUM
 Abstract
Description
Claims
Application Information
 - R&D Engineer
- R&D Manager
- IP Professional
- Industry Leading Data Capabilities
- Powerful AI technology
- Patent DNA Extraction
Browse by: Latest US Patents, China's latest patents, Technical Efficacy Thesaurus, Application Domain, Technology Topic, Popular Technical Reports.
© 2024 PatSnap. All rights reserved.Legal|Privacy policy|Modern Slavery Act Transparency Statement|Sitemap|About US| Contact US: help@patsnap.com