Method for detecting glucose in beverage by using composite probe based on SERS (Surface Enhanced Raman Scattering)
A compound probe and glucose technology, which is applied in the field of analysis and detection, can solve the problems of complex and time-consuming glucose methods, and achieve the effects of improving detection accuracy, enhancing Raman signal, and strengthening grasping
- Summary
- Abstract
- Description
- Claims
- Application Information
AI Technical Summary
Problems solved by technology
Method used
Image
Examples
Embodiment 1
[0049] Example 1 Preparation of AgNPs@COF substrate
[0050] The preparation method of AgNPs@COF substrate includes the following steps:
[0051] In two 50 mL centrifuge tubes, add trimesic acid chloride (TMC, 4 mmol) in ethyl acetate solution (30 mL) and p-phenylenediamine (PPD, 3 mmol) in ethyl acetate solution (15 mL), respectively, and sonicate for 10 min. Dissolve the solid completely; in a low temperature environment of 10°C, add the ethyl acetate solution of p-phenylenediamine (PPD) dropwise to the ethyl acetate solution of trimesoyl chloride (TMC) in a stirring state at a uniform speed; all dropwise additions are completed Then, continue to stir at low temperature for 1 h, then transfer to room temperature and let stand for 24 h; collect the yellow precipitate obtained by centrifugation, and then wash with deionized water and absolute ethanol for 3-4 times respectively; and finally dry under vacuum at 65 ° C for 8 h , to obtain COF materials.
[0052] Mix 100 mL of s...
Embodiment 2
[0053] Example 2 Construction of standard curve
[0054] (1) Prepare the sample solution:
[0055] Taking 50mg / L glucose solution as mother liquor, and taking the solution of mother liquor diluted to 1, 2, 3, 4, 5, 6, 8, 10, 20, 40 mg / L respectively to obtain gradient concentration of glucose aqueous solution;
[0056] The AgNPs@COF base solution and TMB solution of Example 1 were mixed with the beverage sample to be tested and the aqueous glucose solution in a volume ratio of 1:2:1:1, and vortexed for 1 min to obtain concentrations of 0.2, 0.4, 0.6, and 0.8, respectively. , 1, 1.2, 1.6, 2, 4, 8 mg / L standard solution as the test sample solution;
[0057] (2) Carry out Raman detection:
[0058] The obtained test sample solution does not need any preprocessing procedure, and the Raman spectrometer is used for direct Raman detection under the conditions of excitation light source wavelength of 532 nm, integration time of 20 s, and laser power of 10% to obtain the Raman spectru...
Embodiment 3
[0063] Example 3 Influence of different ratios of substrate and TMB on the intensity of Raman characteristic peaks
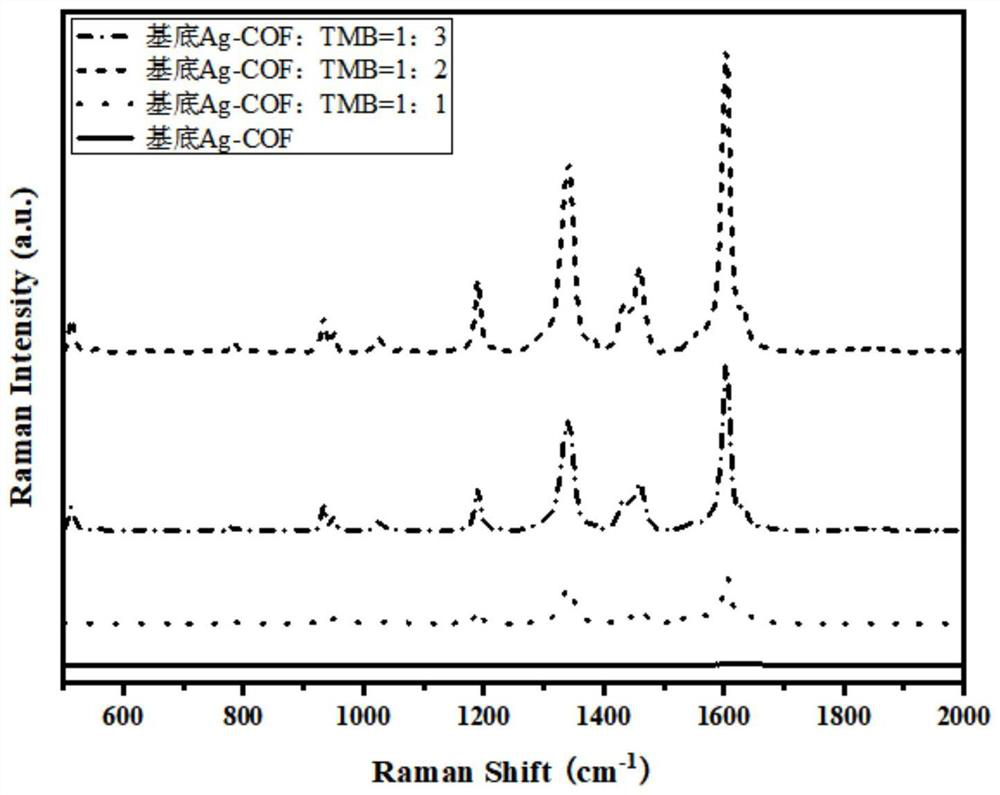
[0064] According to the time of vortex oscillation in step (1) of Example 2, the time of vortexing was 1 min, and the ratio relationship between the volume of substrate AgNPs@COF and TMB solution in step (1) of Example 2 was adjusted to be 1:1, 1:2 and 1:3; Carry out Raman detection according to the step (2) of embodiment 2, and the detection result is as follows:
[0065] image 3 For the Raman spectra of the mixed solutions of substrate and TMB in different proportions in Example 3, it can be seen that the AgNPs@COF substrate solution does not have obvious Raman characteristic peaks after direct measurement and observation. image 3 Approximate to a straight line in the -1 ) is the largest, so the ratio of substrate to TMB was chosen to be 1:2 in the subsequent experiments.
PUM
 Abstract
Description
Claims
Application Information
 - R&D
- Intellectual Property
- Life Sciences
- Materials
- Tech Scout
- Unparalleled Data Quality
- Higher Quality Content
- 60% Fewer Hallucinations
Browse by: Latest US Patents, China's latest patents, Technical Efficacy Thesaurus, Application Domain, Technology Topic, Popular Technical Reports.
© 2025 PatSnap. All rights reserved.Legal|Privacy policy|Modern Slavery Act Transparency Statement|Sitemap|About US| Contact US: help@patsnap.com


