Transformer area electric energy quality analysis method adopting multi-dimensional section scanning data

A technology for power quality analysis and scanning data, applied in data processing applications, neural learning methods, measurement devices, etc., can solve the problems of extracting feature quantities or complex calculations, inability to accurately identify real-time calculations, and increasing difficulty in accurate identification, etc. The effect of improving the recognition accuracy, improving the accuracy, and reducing the amount of calculation

Pending Publication Date: 2022-06-17
STATE GRID JIANGSU ELECTRIC POWER CO LTD SUQIAN POWER SUPPLY BRANCH +2
View PDF0 Cites 0 Cited by
  • Summary
  • Abstract
  • Description
  • Claims
  • Application Information

AI Technical Summary

Problems solved by technology

[0003] Power quality disturbances are one of the main problems existing in power systems; disturbances or disturbances are usually caused by many factors, such as nonlinear or fluctuating loads, power electronic equipment, system failures, etc., and in some extreme cases, these factors are Can cause distortion of the waveform; if identification and control actions are not taken to properly prevent and mitigate these disturbances, an overall interruption of the transmission and distribution network may occur, causing significant social impact and huge economic losses
[0004] Power quality disturbance recognition usually uses signal processing technology for feature extraction and supervised classification method for pattern recognition; currently in the feature extraction stage, signal processing technology applications include short-time Fourier transform, S transform, Kalman filter, wavelet transform, Hill Burt-Huang transform, etc., these methods require a certain amount of manual intervention to extract feature quantities or complex calculations (such as S-transform), and cannot be accurately identified or real-time calculated in the current situation of complex waveform changes; with big data and The development of artificial intelligence and the use of relevant methods make it possible to accurately identify real-time
[0005] Actual power quality disturbances are divided into single disturbances and compound disturbances, but simple single disturbances occur less frequently, and compound disturbances, especially double disturbances, occur more often, for example, accompanied by voltage swells and harmonics. ; Therefore, the actual power quality disturbance has feature aliasing phenomenon, and the pattern similarity between the compound disturbance and the single disturbance leads to a significant increase in the difficulty of accurate identification; at present, deep learning technology is rapidly developed and widely used. It can be well applied in the field of power quality analysis and recognition, and can still achieve high recognition accuracy under certain noise

Method used


Image

  • Transformer area electric energy quality analysis method adopting multi-dimensional section scanning data
  • Transformer area electric energy quality analysis method adopting multi-dimensional section scanning data
  • Transformer area electric energy quality analysis method adopting multi-dimensional section scanning data

Examples


Embodiment Construction

[0054] A method for analyzing power quality of a station area using multi-dimensional cross-sectional scan data, the method includes:

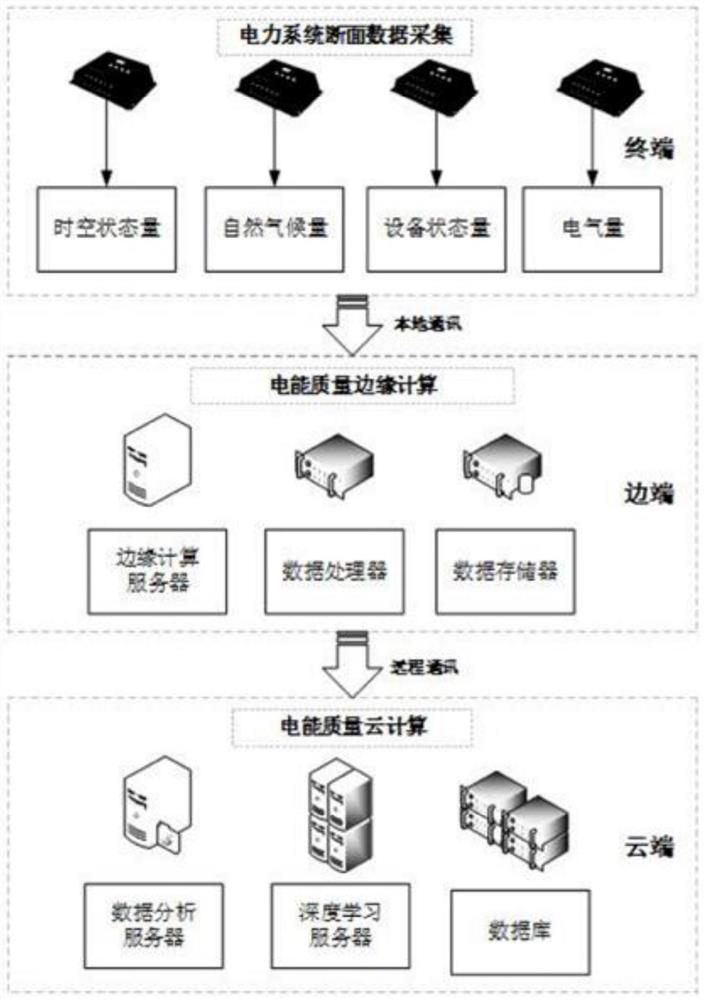
[0055] 1. Build a power quality analysis system with cloud-side-end architecture, and collect multi-dimensional cross-sectional data;

[0056] 2. Connect and reconstruct incomplete section data;

[0057] 3. Based on the multi-dimensional cross-sectional data of electrical quantity and non-electric quantity, the type and location of power quality disturbance are identified by cloud computing.

[0058] The method for analyzing the power quality of a station area using multi-dimensional cross-sectional scan data is suitable for analyzing the power quality of a 380V station area.

[0059] like figure 1 As shown, the power quality analysis system of the cloud-side-end architecture specifically includes a terminal, an edge, and a cloud. The terminal and the edge adopt a local communication mode, and the edge and the cloud adopt a remote communicat...


PUM


Abstract

The invention provides a transformer area electric energy quality analysis method adopting multi-dimensional section scanning data, which comprises the following steps of: 1, constructing an electric energy quality analysis system of a cloud-edge-end framework, and collecting the multi-dimensional section data; 2, connection and reconstruction of incomplete section data are carried out; and 3, based on the electrical quantity-non-electrical quantity multi-dimensional section data, carrying out cloud computing identification on the type and position of the power quality disturbance. According to the method, cloud computing and edge computing are combined, the cloud end, the edge end and the terminal are matched with one another, electrical quantity and non-electrical quantity section data of a section are collected, corrected, stored and analyzed, the calculated amount of cloud data can be reduced, the requirements of high communication of a single cloud end and high cost of a single edge end are balanced, and the economical efficiency of the system is effectively improved.

Description

technical field [0001] The invention relates to a power quality analysis method of a station area using multi-dimensional cross-sectional scanning data, and belongs to the field of power quality analysis and identification of power systems. Background technique [0002] New energy power generation has become one of my country's important development strategies, but unlike the stable and reliable traditional energy power generation, new energy power generation has randomness and volatility, which will bring more disturbances to the power system than traditional energy power generation. [0003] Power quality disturbance is one of the main problems in power systems; disturbances or disturbances are usually caused by many factors, such as nonlinear or fluctuating loads, power electronic equipment, system faults, etc. In some extreme cases, these factors are Can cause waveform distortions; if identification and control actions are not taken to properly prevent and mitigate these...

Claims


Application Information

Patent Timeline
Patent Type & Authority Applications(China)
IPC IPC(8): G06Q10/06G06Q50/06G06F17/18G06N3/04G06N3/08G01D21/02
CPCG06Q10/06395G06Q50/06G06F17/18G06N3/084G01D21/02G06N3/047G06N3/044G06N3/045
Inventor 周磊马建黄昊缪春旺张圆明韩少华安薇薇张济凡
Owner STATE GRID JIANGSU ELECTRIC POWER CO LTD SUQIAN POWER SUPPLY BRANCH
Why Eureka
Try Eureka