Immunochromatographic test strip for quantitatively detecting procalcitonin and quantitative detection method thereof
An immunochromatographic test strip, procalcitonin technology, applied in biological testing, measuring devices, analytical materials, etc., can solve problems such as low detection sensitivity, and achieve the effects of simple operation, improved linear range and stability, and rapid detection.
- Summary
- Abstract
- Description
- Claims
- Application Information
AI Technical Summary
Problems solved by technology
Method used
Image
Examples
Embodiment 1
[0050] The optimization of embodiment 1 PCT labeling antibody optimum loading amount
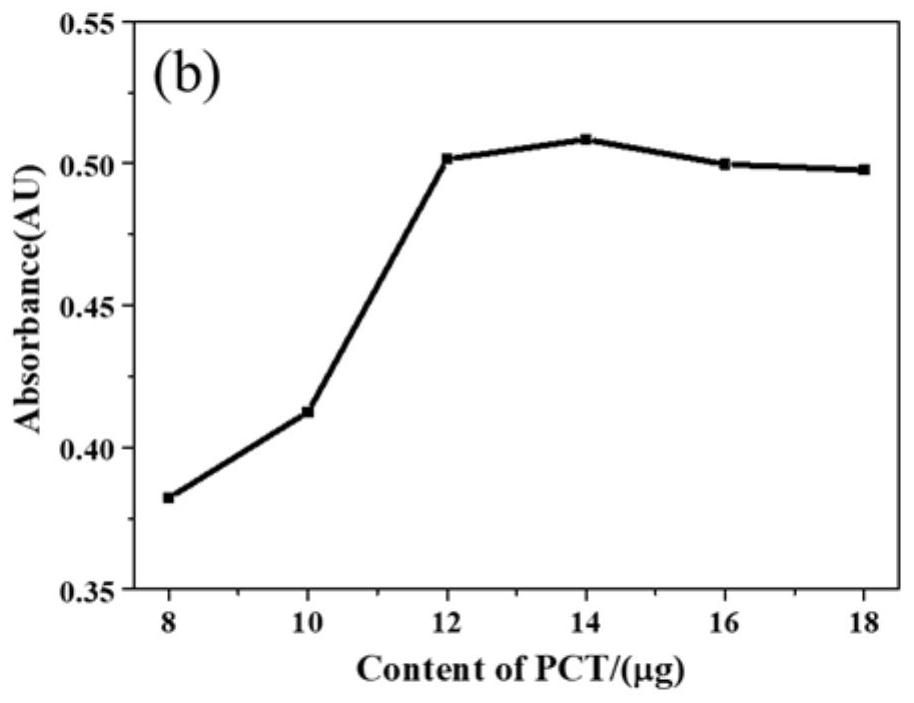
[0051]In order to determine the optimal labeling amount of nano-gold-labeled PCT antibody, we carried out spectrophotometric determination on the gold-labeled antibody solution. The results of spectrophotometry were as figure 2 As shown in the figure, the absorbance values measured at 525nm by adding 8, 10, 12, 14, 16, and 18 μL of 1 mg / mL PCT antibody solution respectively, it can be seen from the figure that when the amount of PCT antibody added reaches 12 μL and above , the absorbance value of the nano-gold mixture remains almost unchanged, so it is determined that the optimal antibody labeling amount of stable nano-gold is 12 μg / 1mL nano-gold, and an additional 20% is added on this basis, that is, 12×(1+0.2)=14.4 μg, for the convenience of adding, the final determination is to use 15 μg of PCT antibody addition / 1mL nano-gold.
Embodiment 2
[0052] Embodiment 2 detects procalcitonin with the test strip that the present invention makes
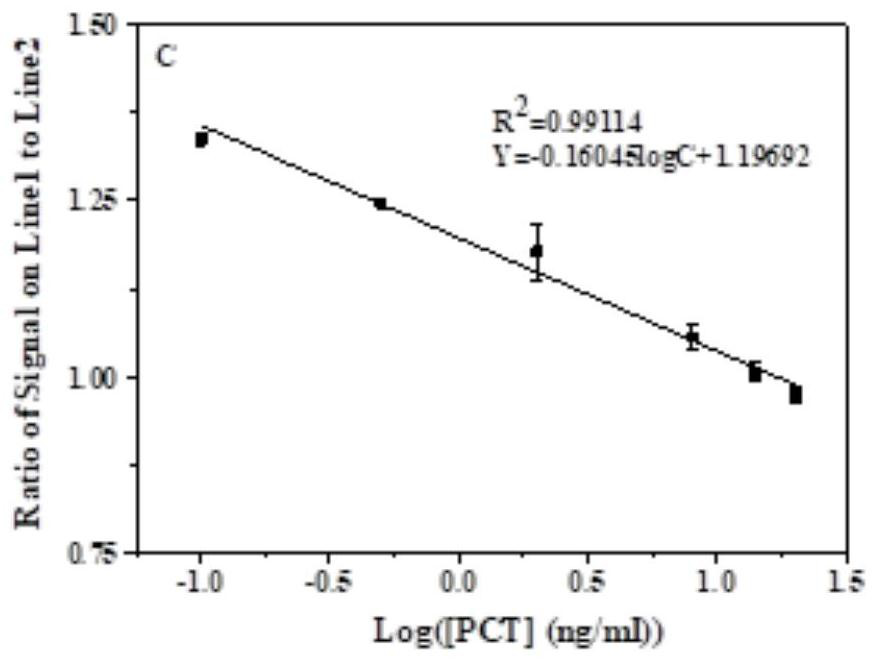
[0053] A kind of immunochromatographic test strip for quantitative detection of procalcitonin was used to detect different concentrations of procalcitonin standard samples (take 7 different concentrations, respectively 0, 0.1, 0.5, 2, 8, 14, 20ng / mL, three parallel samples were made for each concentration). After a period of chromatographic reaction, use a self-assembled fluorescent immunochromatographic analysis device to detect the fluorescence signals at the detection line T1 and control line T2, and obtain the relative fluorescence signal value T1 / T2, with the logarithm value of the PCT antigen concentration as the abscissa log C , with T1 / T2 as the ordinate y, establish an equation and fit it into a standard curve.
[0054] Depend on image 3 It can be seen from the standard curve that the T1 / T2 signal value and the logarithmic value of the PCT antigen concentration present...
PUM
| Property | Measurement | Unit |
|---|---|---|
| Diameter | aaaaa | aaaaa |
Abstract
Description
Claims
Application Information
 - R&D
- Intellectual Property
- Life Sciences
- Materials
- Tech Scout
- Unparalleled Data Quality
- Higher Quality Content
- 60% Fewer Hallucinations
Browse by: Latest US Patents, China's latest patents, Technical Efficacy Thesaurus, Application Domain, Technology Topic, Popular Technical Reports.
© 2025 PatSnap. All rights reserved.Legal|Privacy policy|Modern Slavery Act Transparency Statement|Sitemap|About US| Contact US: help@patsnap.com


