Biomarkers of oral, pharyngeal and laryngeal cancers
A technique for oral cancer and oral cavity, applied in the field of head and neck cancer
- Summary
- Abstract
- Description
- Claims
- Application Information
AI Technical Summary
Problems solved by technology
Method used
Image
Examples
example
[0137] general method
[0138] Head and neck squamous cell carcinoma (HNSCC) serum samples were obtained from subjects with informed consent, approved by the ethics committees of the University of Technology and the Royal Prince Alfred Hospital. Serum samples were selected from pathologically diagnosed oral cavity tumors (n=42; mean age 62.1 years; 68% males), oropharyngeal tumors (n=5; mean age 71.4 years; 60% males), or pharynx / larynx tumors 52 HNSCC patients (n=5; mean age 60.8 years; 80% male). Details are provided in Table 3 below.
[0139] table 3
[0140]
[0141]
[0142] Sera were also collected from 11 healthy (HNSCC-free) subjects (mean age 55.7 years; 63% male) to serve as controls for this study (see also Table 3 above).
[0143] From each subject, 5 mL of blood was collected directly into the BD in the blood collection tube. All samples were collected at room temperature (before surgery in the case of HNSCC patients) and BD by centrifugation at 800rpm...
example 1
[0151] Example 1 - Differential miRNA expression between HNSCC and tumor-free controls
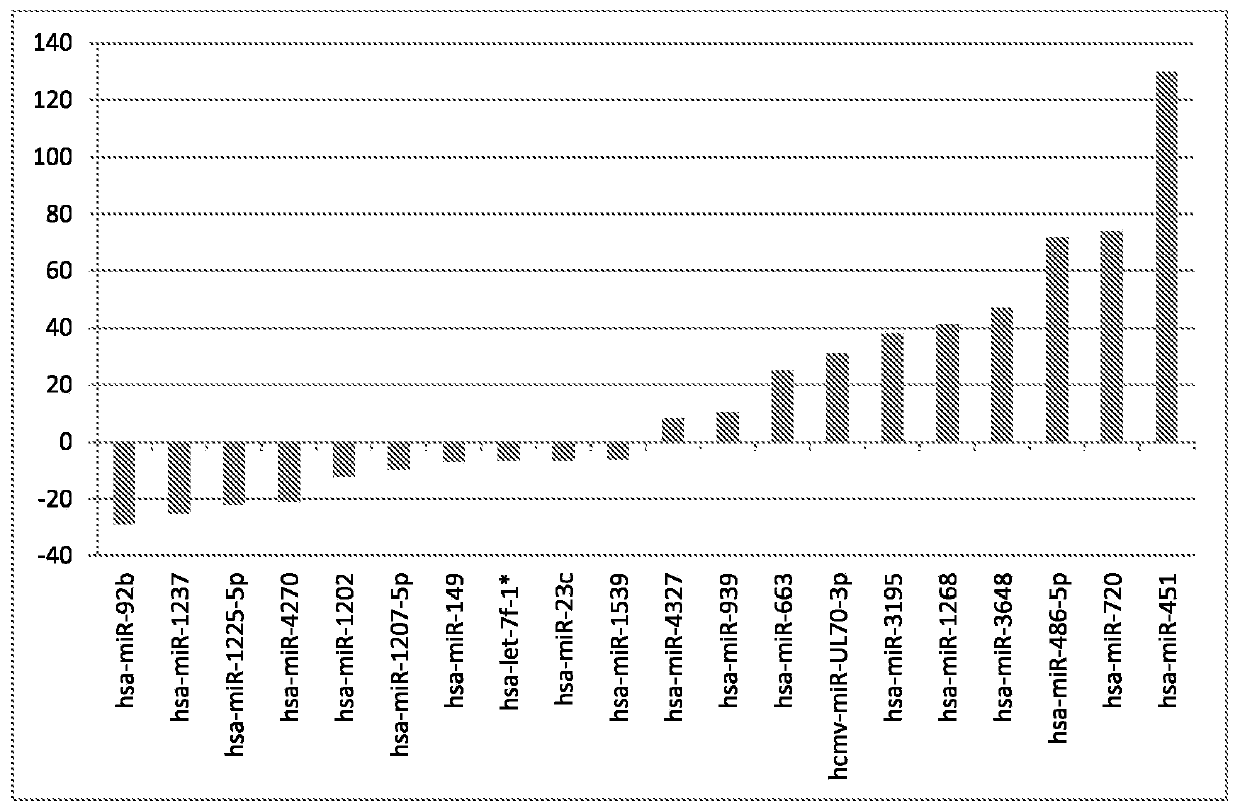
[0152] The inventors first investigated miRNA expression in compiled pooled HNSCC serum samples (n=52) compared to tumor-free control serum samples (n=11). Volcano plot analysis identified 53 miRNAs that were significantly overexpressed (upregulated) and 40 miRNAs that were significantly underexpressed (downregulated) in sera from HNSCC subjects compared with sera from tumor-free control subjects.
[0153] figure 1 Shown are the ten most overexpressed and ten least expressed miRNAs with p-values less than 0.000001 in sera from HNSCC subjects compared to sera from tumor-free control subjects, as determined from volcano plot analysis. Table 4 presents the figure 1 p-values and fold changes for the six most overexpressed and three least expressed miRNAs, and the number of known gene targets for each miRNA.
[0154] Table 4
[0155]
example 2
[0156] Example 2 - Differential miRNA expression between oral tumor group and tumor-free control group
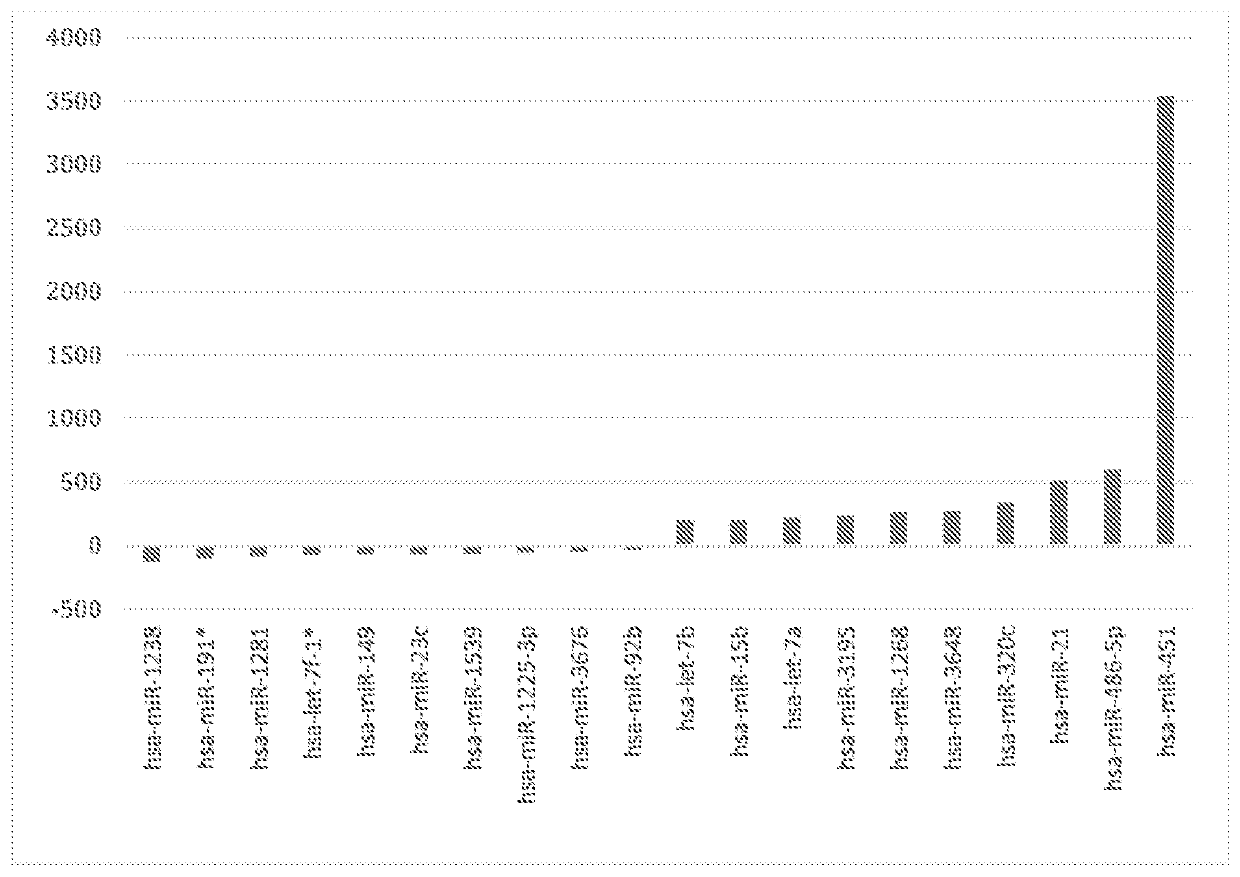
[0157] The inventors then investigated miRNA expression in oral tumor pooled serum samples (n=42) and tumor-free control samples (n=11). Volcano plot analysis identified 130 miRNAs that were significantly overexpressed (upregulated) and significantly underexpressed (downregulated) in sera from subjects with oral tumors compared with sera from tumor-free control subjects. 36 miRNAs.
[0158] figure 2 Shown are the ten most overexpressed and ten least expressed miRNAs with a p-value less than 0.000001 in sera from subjects with oral cavity tumors compared to sera from tumor-free control subjects, as analyzed from the volcano plot determined. Most of the differentially expressed miRNAs were found to be overexpressed (increased between 100 and 1000 fold). The lowest expressed miRNA (miR-129-3p) exhibited a relatively modest 100-fold decrease in expression.
[0159] Gene o...
PUM
| Property | Measurement | Unit |
|---|---|---|
| Sensitivity | aaaaa | aaaaa |
Abstract
Description
Claims
Application Information
 - R&D
- Intellectual Property
- Life Sciences
- Materials
- Tech Scout
- Unparalleled Data Quality
- Higher Quality Content
- 60% Fewer Hallucinations
Browse by: Latest US Patents, China's latest patents, Technical Efficacy Thesaurus, Application Domain, Technology Topic, Popular Technical Reports.
© 2025 PatSnap. All rights reserved.Legal|Privacy policy|Modern Slavery Act Transparency Statement|Sitemap|About US| Contact US: help@patsnap.com


