A method for decompose and forecasting electric quantity of meteorological influence
A forecasting method and meteorological technology, applied in forecasting, data processing applications, instruments, etc., can solve problems such as large forecasting errors and lack of theoretical basis, and achieve the effect of improving accuracy and reducing errors
- Summary
- Abstract
- Description
- Claims
- Application Information
AI Technical Summary
Problems solved by technology
Method used
Image
Examples
Embodiment 1
[0022] In this embodiment, a method for predicting the decomposition and prediction of electricity influenced by weather is proposed, which includes the following steps:
[0023] S1: Set the base month: the default spring base month is May, and the autumn base month is October;
[0024] S2: Calculate meteorological correlation: divide the data into two parts, winter and summer, and calculate the data separately. If the month belongs to November-April, then calculate the winter correlation. If the month belongs to June-September, calculate the summer correlation. The base month is not involved in the calculation, the correlation calculation formula is get correlation data;
[0025] S3: Calculating the growth rate of monthly weather-influenced electricity: pass y to the correlation data in S2 t =y i -y j and δ=(y t / y j )*100% formula to calculate the monthly weather-affected electricity growth rate and display the correlation coefficient;
[0026] S4: Display: display t...
Embodiment 2
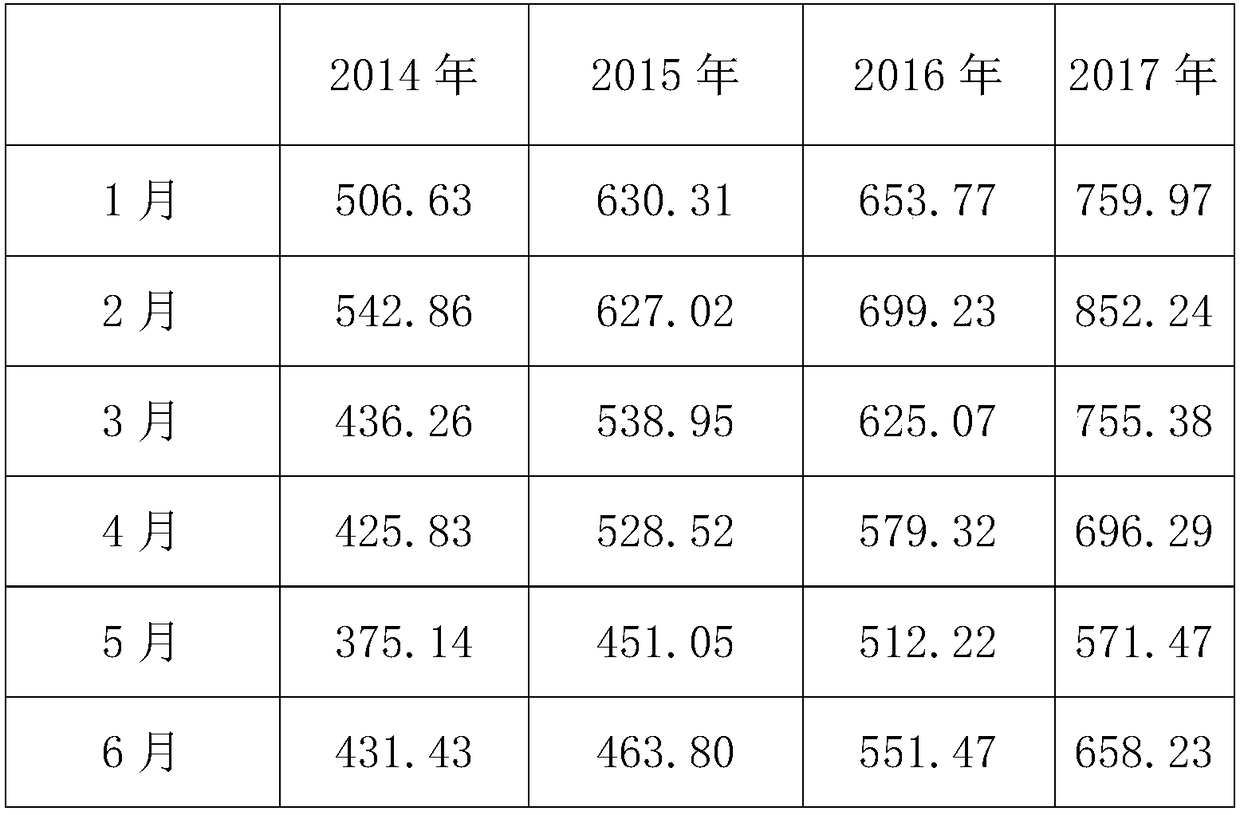
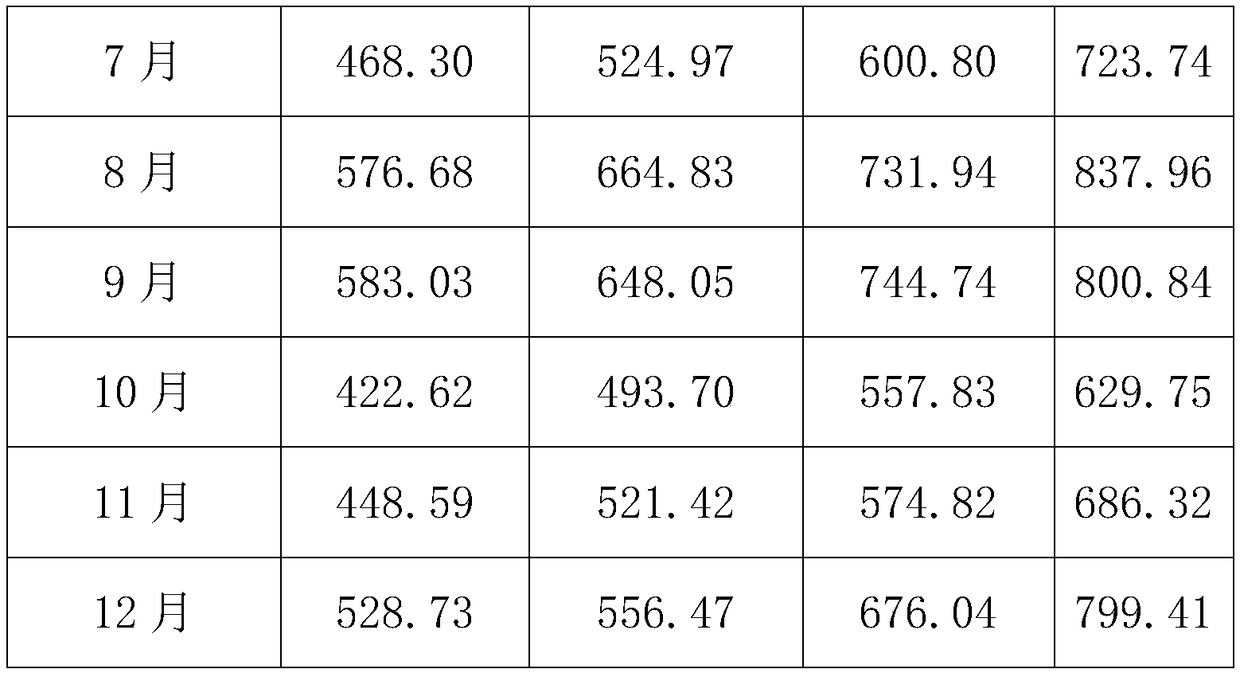
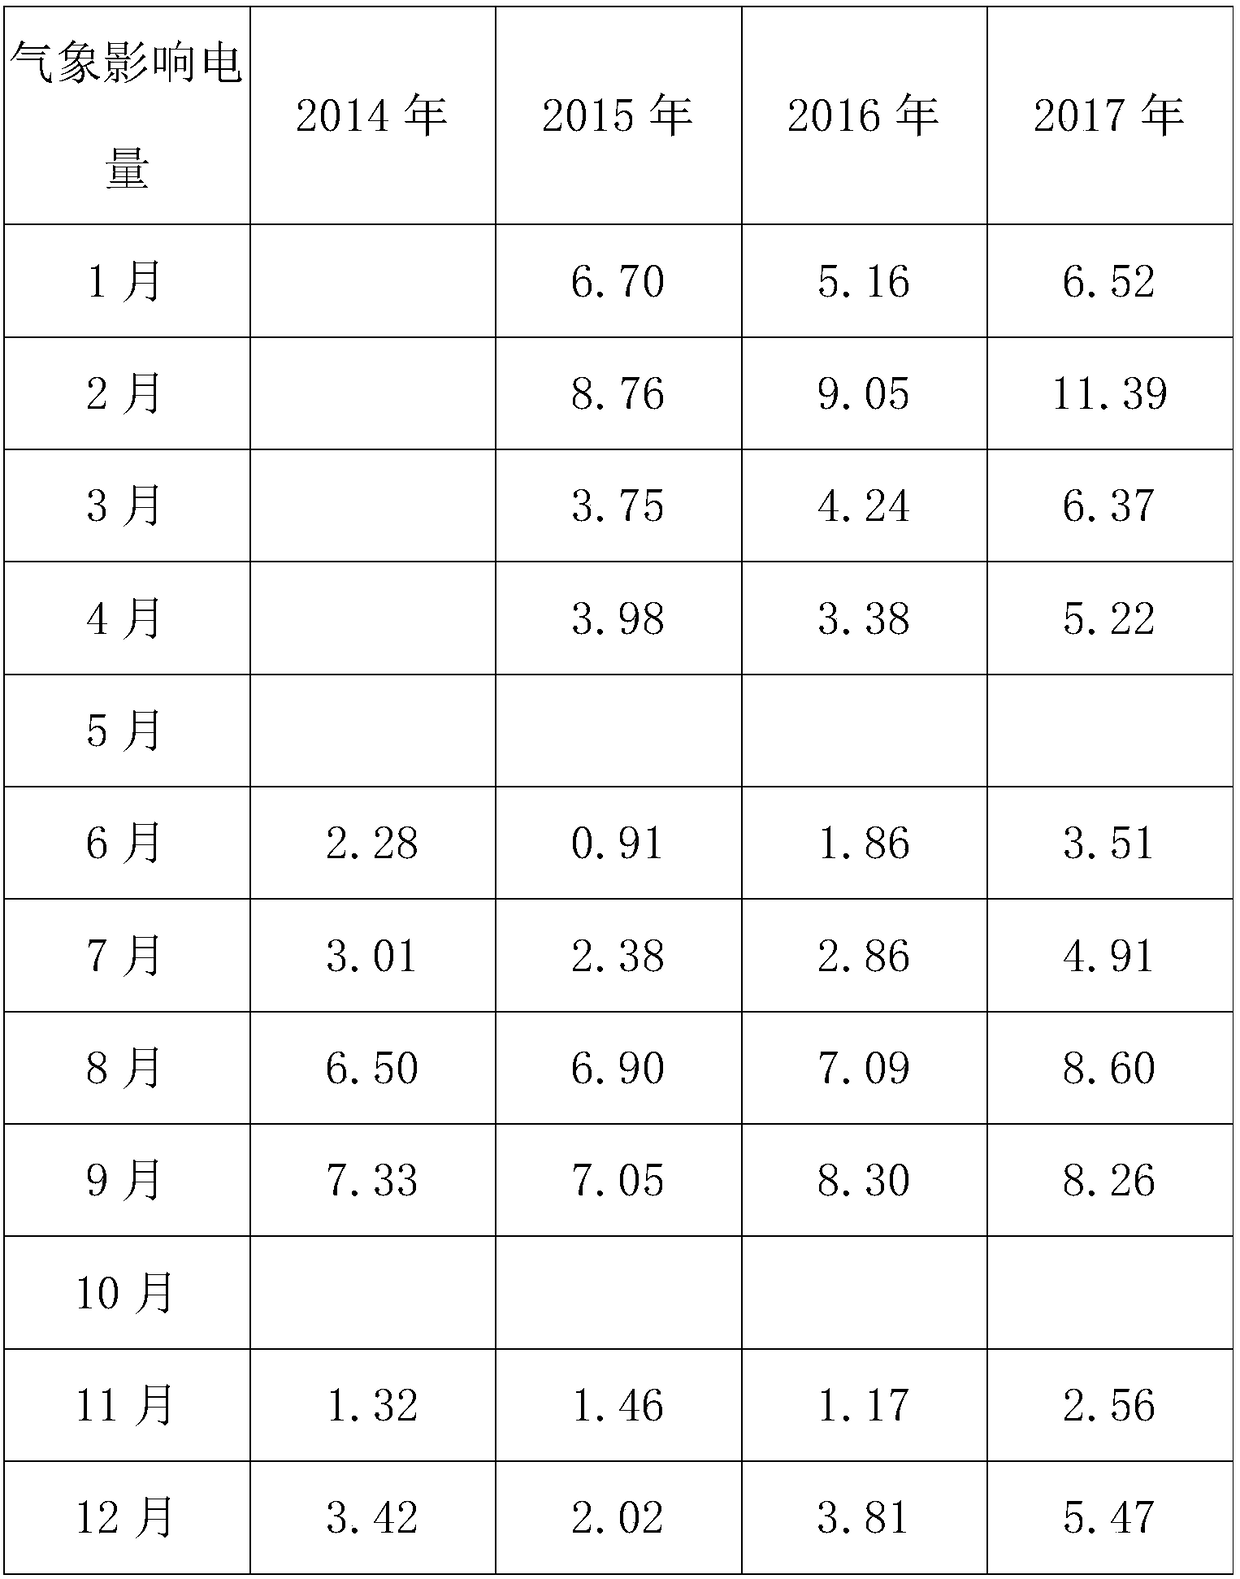
[0031] Taking the data of a certain region from 2014 to 2017 as an example, Table 1 shows the monthly electricity consumption of businesses in a certain region over the years. The amount of weather-affected electricity is obtained by subtracting the closest historical basic monthly electricity from the average amount of electricity, as shown in Table 3. Table 4 shows the growth rate of commercial weather-affected electricity in a certain area from 2014 to 2017, and calculates summer weather-related indicators and weather-affected electricity, and winter weather-affected electricity. The correlation between weather-related indicators and weather-affected electricity has been standardized in order to unify each year. The analysis results are shown in Table 5 and Table 6.
[0032]
[0033]
[0034] Table 1
[0035] Average daily electricity
Year 2014
2015
2016
2017
January
16.34
20.33
21.09
24.52
February
19.39
22.39...
PUM
 Abstract
Description
Claims
Application Information
 - R&D Engineer
- R&D Manager
- IP Professional
- Industry Leading Data Capabilities
- Powerful AI technology
- Patent DNA Extraction
Browse by: Latest US Patents, China's latest patents, Technical Efficacy Thesaurus, Application Domain, Technology Topic, Popular Technical Reports.
© 2024 PatSnap. All rights reserved.Legal|Privacy policy|Modern Slavery Act Transparency Statement|Sitemap|About US| Contact US: help@patsnap.com


